www.orientjchem.org
An International Open Free Access, Peer Reviewed Research Journal
2016, Vol. 32, No. (3): Pg. 1493-1502
Optimization Central Composite Design for the Simultaneous
Determination of Cd(II) ion in Fruit and Vegetable Samples by
Adsorptive Stripping Voltammetry
DESwATI
1*, IzzATI RAHMI H.G
2, HAMzAR SUYANI
1, RAHMIANA zEIN
1and ADMIN ALIF
11Department of Chemistry, Faculty of Mathematics and Natural Science,
Andalas University, Kampus Limau Manis, Padang 25163, Indonesia.
2Department of Mathematics, Faculty of Mathematics and Natural Science,
Andalas University, Kampus Limau Manis, Padang 25163, Indonesia. *Correspondence author E-mail : [email protected]
http://dx.doi.org/10.13005/ojc/320323 (Received: May 11, 2016; Accepted: June 19, 2016)
ABSTRACT
This work describes a procedure for the simultaneous determination of cadmium in fruit and vegetable samples using adsorptive stripping voltammetry of complexes with calcon at a hanging mercury drop electrode (HMDE) has been optimized using central composite design (CCD). The selection of the experimental conditions was made using experimental of the influence of several parameters were studied : variations of calcon concentration, pH, accumulation potential and accumulation time. The design experiment was a central composite design with 4 factors/variables, 3 levels and 31 treatment combinations. From analysis of variance, it was decided to accept the second-order model and the independent variable, concluded that a significant effect on the response variable (peak current). Based on data analysis with central composite design, the determination of cadmium obtained optimum conditions were : calcon concentration 0.8435 mM, pH 8.0047, accumulation potential -0.6346 Volt and accumulation time 81.85 seconds with a maximum peak current 61.8146 nA. At the optimum condition were obtained relative standard deviation 0.84%, recovery 98.88%, the linear range up to 110 µg/L, limit of detection 1.009 µg/L and LOQ 3.363 µg/L. The procedure was successfully applied to the determination of cadmium in fruit and vegetable samples without prior treatment.
Keywords : simultaneous, cadmium, adsorptive stripping voltammetry, fruit and vegetable samples, central composite design.
INTRODUCTION
Cadmium is known to be a hazardous environmental pollutant with toxic effects. Adverse
organs affected by cadmium are lungs, kidney, bones and teeth.
The concentration of cadmium in various samples is low, so sensitive and selective methods for determination of cadmium in environmental samples are required. Sensitive methods for the determination of trace amounts of metal ions in natural samples have received much attention and many techniques have been employed.
Analysis of heavy metals at trace levels in fruit and vegetable samples are very important in the field of environmental analysis due to their important roles in life. For that, atomic absorption techniques have been usually used. However, they offer many difficulties due to insufficient detection limits and/or matrix interferences of real samples and a preconcentration step is often required1-4.
The use of electroanalytical techniques is another alternative widely employed, specially the stripping voltammetry. These methods are well-established for trace metal analysis and adsorp- tive processes (AdSV) can further lower detection limits of stripping voltammetry to the picomolar concentration levels. In addition, these techniques are inexpensive, simple, quick and very useful for saline matrices like seawater and estuarine water samples and for speciation studies1-6.
The previous study, to find optimization in the determination of trace metals Cd, Cu, Pb and Zn1-3 and trace metals Fe, Co, Ni and Cr4 in both
individual and simultaneous by adsorptive stripping volt ammetry (AdSV), carried out by observing the effect of one variable is changed, while the other variables are kept at a constant level. This optimization technique is called optimization of one variable or a factor at the current time.The main drawback of the results of the optimization of the factors that such optimization does not take into account the effect of the interaction between the variables studied. Therefore, this technique does not describe the full effect on the response parameter7.
Another disadvantage of optimization of these factors is the increase in the number of trials required to do research, which leads to increased time and increased consumption of reagents and materials. To overcome this problem, an optimization technique
of analytical procedures is by using multivariate statistical techniques7-9.
The most relevant multivariate techniques used in analytical optimization is the Response Surface Method (RSM) with a Central Composite Design (CCD). RSM is a collection of mathematical and statistical techniques, which are used for modeling and analysis of problems in a response that is influenced by several variables, whose purpose is to optimize the response or optimize these variables to achieve the best system performance7-11. The RSM
was done using Minitab.
Adsorptive stripping voltammetry is a highly sensitive technique12, the response obtained in
the form of the peak current (Ip) is influenced by variables (parameters) the following, namely: calcon concentration, pH , accumulation potential and accumulation time. Therefore it is very important to determine the optimization of these parameters, which will affect the measurement of the peak flow in order to improve the quality of analytical results 8-10. The research design used in this study, as a tool
for optimization was central composite design with 4 variables, 3 level/degree and 31 a combination of treatments. The first step of 2k factorial design optimization are: provide the code, where the value of the highest level (+1), the lowest level (-1) and code (0) as the center point. Programs for statistical data processing Minitab 16 using Response Surface Methodology.
The purpose of this study was to obtain the optimum condition of cadmium, so it can be applied to the analysis of cadmium in fruit and vegetable samples. To achieve these objectives, required an optimization technique using analytical procedures that RSM with a CCD7-14. Some parameters were
studied : variations of calcon concentration, pH, accumulation potential and accumulation time.
EXPERIMENTAL
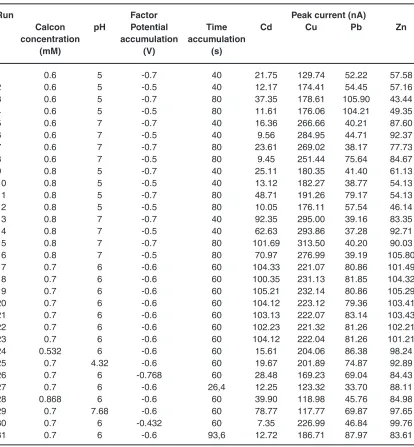
Tabel 1: Optimization Cetral Composite Design (CCD) for the Simultaneous Determination of Cd, Cu, Pb, and zn using calcon
Run Factor Peak current (nA)
Calcon pH Potential Time Cd Cu Pb zn concentration accumulation accumulation
(mM) (V) (s)
1 0.6 5 -0.7 40 21.75 129.74 52.22 57.58
2 0.6 5 -0.5 40 12.17 174.41 54.45 57.16
3 0.6 5 -0.7 80 37.35 178.61 105.90 43.44
4 0.6 5 -0.5 80 11.61 176.06 104.21 49.35
5 0.6 7 -0.7 40 16.36 266.66 40.21 87.60
6 0.6 7 -0.5 40 9.56 284.95 44.71 92.37
7 0.6 7 -0.7 80 23.61 269.02 38.17 77.73
8 0.6 7 -0.5 80 9.45 251.44 75.64 84.67
9 0.8 5 -0.7 40 25.11 180.35 41.40 61.13
10 0.8 5 -0.5 40 13.12 182.27 38.77 54.13
11 0.8 5 -0.7 80 48.71 191.26 79.17 54.13
12 0.8 5 -0.5 80 10.05 176.11 57.54 46.14
13 0.8 7 -0.7 40 92.35 295.00 39.16 83.35
14 0.8 7 -0.5 40 62.63 293.86 37.28 92.71
15 0.8 7 -0.7 80 101.69 313.50 40.20 90.03
16 0.8 7 -0.5 80 70.97 276.99 39.19 105.80
17 0.7 6 -0.6 60 104.33 221.07 80.86 101.49
18 0.7 6 -0.6 60 100.35 231.13 81.85 104.32
19 0.7 6 -0.6 60 105.21 232.14 80.86 105.29
20 0.7 6 -0.6 60 104.12 223.12 79.36 103.41
21 0.7 6 -0.6 60 103.13 222.07 83.14 103.43
22 0.7 6 -0.6 60 102.23 221.32 81.26 102.21
23 0.7 6 -0.6 60 104.12 222.04 81.26 101.21
24 0.532 6 -0.6 60 15.61 204.06 86.38 98.24
25 0.7 4.32 -0.6 60 19.67 201.89 74.87 92.89
26 0.7 6 -0.768 60 28.48 169.23 69.04 84.43
27 0.7 6 -0.6 26,4 12.25 123.32 33.70 88.11
28 0.868 6 -0.6 60 39.90 118.98 45.76 84.98
29 0.7 7.68 -0.6 60 78.77 117.77 69.87 97.65
30 0.7 6 -0.432 60 7.35 226.99 46.84 99.76
31 0.7 6 -0.6 93,6 12.72 186.71 87.97 83.61
and the equipment to be very clean and should be careful in its use. It aims to avoid or protect from contamination.
Voltammetric measurements were carried out using a Metrohm 797 VA. Electrode stand with a multimode electrode (MME) operating in the HMDE mode. An Ag/AgCl/KCl reference electrode and a platinum wire auxilary electrode were used. pH meter 80 models Griffin, Griffin & George
Loughborough, England; and analytical balance Mettler AE 200, Toledo OH-USA; and glassware used in the laboratory
work Procedure
Table 2: Level CCD variables for parameters independent (free) of a mixture of metal ions (Cd, Cu, Pb and zn)
Factor Level (Cd, Cu, Pb, zn)
-1 0 +1
Calcon concentration (mM) C 0,6 0,7 0,8
pH pH 5 6 7
Accumulation Potensial (V) E -0,7 -0,6 -0,5
Accumulation time (s) T 40 60 80
Source : level 0 taken from previous research [1] potential accumulation and time accumulation is set
according to the experimental design of the Central Composite Design (CCD) in Table 1. From Table 1 was obtained peak current response of Cd, Cu, Pb and Zn ions.
Experimental design
The CCD system is an effective model and used for sequential experimentation which provides information for testing ‘the goodness of fit’ and does not require unusual large number of design points thereby reducing the overall cost associated with the experiment. A four-factor central composite design (CCD) obtained by using Minitab 16 was applied. The four factors considered to affect the peak current were calcon concentration, pH, potential accumulation and time accumulation. The level and ranges chosen for the factors are shown in Table 2. Sample Preparation
Vegetable samples were used in this study are: cauliflower, cabbage, eggplant and broccoli, while the fruit samples are used : apples, bananas kepok, melon and dragon fruit.
Vegetable and fruit samples before the specified metal content of Cd are determined once the water content, then wet destruction with the addition of nitric acid and perchloric acid pa. Each sample weighed 0.5000 grams carefully dried and crushed, put in a flask digestion/kjeldahl flask. Furthermore, wet destruction with the addition of 5 mL of concentrated nitric acid and 0.5 mL of concentrated perchloric acid, shaked and left overnight. Onwards, heated at block digestor started with a temperature of 100oC, after the yellow steam
discharged elevated temperature up to 200 oC.
Destruction ended when already out of white vapor and liquid in the flask remained about 0.5 mL, cooled and diluted with double destilation and matched into a 50 mL volume, shaken until homogeneous and left overnight and filtered with whatman paper 41. The clear solution is ready determined metal content Cd with Voltammeter tools and Atomic Absorption Spectrophotometer. Determining the optimum conditions used in this study was the procedures that have been developed prior research team1-2. The
data processing is done with the help of software Minitab 16.
RESULTS AND DISCUSSION
Optimization of Cadmium Using One Variable The optimization of one variable in the simultaneous determination of trace metal cadmium in the presence of calcon has been done1-3. The
optimum condition as follow: calcon concentration 0.6 mM, pH 6, accumulation potential -0.6 V, accumulation time 60 seconds. This technique does not describe the full effect on the response parameters and optimization of these factors is the increase in the number of trials required to do research, which leads to increased time and increased consumption of reagents and materials. Therefore to overcome this problem, an optimization technique of analytical procedures is by using Central Composite Design (CCD).
Optimization of Cadmium Using CCD
Table 4: ANOVA of First-Order Model of Copper
Source DF Seq SS Adj SS Adj MS F P
Regression 4 9647,8 9647,8 2411,94 2,08 0,138
Linear 4 9647,8 9647,8 2411,94 2,08 0,138
X1 1 4997,4 4997,4 4997,43 4,31 0,057
X2 1 2671,6 2671,6 2671,60 2,31 0,151
X3 1 1750,8 1750,8 1750,79 1,51 0,239
X4 1 227,9 227,9 227,93 0,20 0,664
Residual Error 14 16214,7 16214,7 1158,19
Lack-of-Fit 12 16201,3 16201,3 1350,11 201,34 0,005
Pure Error 2 13,4 13,4 6,71
Total 18 25862,5
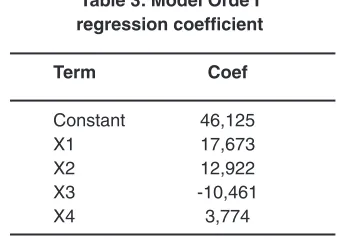
Table 3: Model Orde I regression coefficient
Term Coef
Constant 46,125
X1 17,673
X2 12,922
X3 -10,461
X4 3,774
Based on Table 2, regression equation of first-order model was :
Y = 4 6 , 1 2 5 + 1 7 , 6 7 3 X 1 + 1 2 , 9 2 2 X2 -10,4610X3+3,774X4
Table 5: Regression Coefficients in the Second-Order Model
Term Coef
Constant 96,2949
X1 14,9424
X2 14,1358
X3 -9,3687
X4 2,8248
X1*X1 -16,7662
X2*X2 -9,1791
X3*X3 -20,2443
X4*X4 -22,1637
X1*X2 15,9094
X1*X3 -3,4256
X1*X4 1,0019
X2*X3 0,2856
X2*X4 -0,6719
X3*X4 -3,1994
where X1 = calcon concentration (mM), X2 = pH, X3 = accumulation potential (Volt), X4 = accumulation time (seconds), and v = peak current (nA), whereas the results of Analysis of Variance (ANOVA) of first-order model can be seen at Table 3.
Table 3 test procedure used to determine whether first-order models can be used or not. This hypothesis test was used to test the significance of regression models, which test whether there was a independent variable that significantly influence the response/dependent variable.
Ho: bi = 0,
H1: bi ≠ 0; i = 1,2,3,4
Based on Table 3, the test regression parameters simultaneously produce p-value of 0.138, meaning that the p-value is greater than the significance level used in the amount of á = 0.05. Thus it was decided not to reject Ho and conclude that none of the independent variables that significantly influence the response variable, so the first-order model can not be used
Based on Table 4, the model regression equation :
Y = 9 6 , 2 9 4 9 + 1 4 , 9 4 2 4 X1+ 1 4 , 1 3 5 8 X2 -9,3687X3+2,8248X4-16,7662X12-9,1791X
22
-20,2443X32-22,1637X
42+15,9094X1X2-3,4256X1X3
+1,0019X1X4+0,2856X2X3 -0,6719X2X4-3,1994X3X4 where X1 = calcon concentration (mM), X2 = pH, X3 = accumulation potential (Volt), X4 = accumulation time (seconds), and v = peak current (nA). Results of ANOVA second-order model data were presented in Table 5.
Ho: bi = 0,
H1: bi ≠ 0; i = 1,2,3, ..., k
Based on Table 5 test procedure against the second-order model. This hypothesis test was used to test the significance of regression models, which test whether there is a independent variable (including quadratic and interaction effects) significantly affects the response variable. Test regression parameters simultaneously produce p-value of 0.000, meaning that the p-value obtained
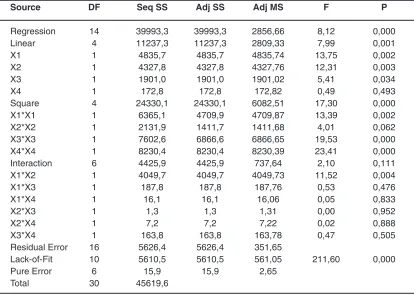
Table 6: ANOVA of Second-Order Model
Source DF Seq SS Adj SS Adj MS F P
Regression 14 39993,3 39993,3 2856,66 8,12 0,000
Linear 4 11237,3 11237,3 2809,33 7,99 0,001
X1 1 4835,7 4835,7 4835,74 13,75 0,002
X2 1 4327,8 4327,8 4327,76 12,31 0,003
X3 1 1901,0 1901,0 1901,02 5,41 0,034
X4 1 172,8 172,8 172,82 0,49 0,493
Square 4 24330,1 24330,1 6082,51 17,30 0,000
X1*X1 1 6365,1 4709,9 4709,87 13,39 0,002
X2*X2 1 2131,9 1411,7 1411,68 4,01 0,062
X3*X3 1 7602,6 6866,6 6866,65 19,53 0,000
X4*X4 1 8230,4 8230,4 8230,39 23,41 0,000
Interaction 6 4425,9 4425,9 737,64 2,10 0,111
X1*X2 1 4049,7 4049,7 4049,73 11,52 0,004
X1*X3 1 187,8 187,8 187,76 0,53 0,476
X1*X4 1 16,1 16,1 16,06 0,05 0,833
X2*X3 1 1,3 1,3 1,31 0,00 0,952
X2*X4 1 7,2 7,2 7,22 0,02 0,888
X3*X4 1 163,8 163,8 163,78 0,47 0,505
Residual Error 16 5626,4 5626,4 351,65
Lack-of-Fit 10 5610,5 5610,5 561,05 211,60 0,000
Pure Error 6 15,9 15,9 2,65
Total 30 45619,6
is smaller than the significance level used in the amount of a = 0.05. Thus it was decided to reject Ho and conclude that there was a independent variable that significantly influence the response variable, so that the second-order model can be accepted.
Based on the regression coefficient values in Table 3 can be arranged matrix b and B as follows:
dan
= 2,8248 9,3687 -14,1358 14,9424 b = 22,1637 1,5997 0,33594 0,5009 1,5997 20,2443 0,14281 1,7128 - 0,3359 0,1428 9,17908 7,9547 0,5009 1,7128 7,95469 16,7662 -B
In order to obtain a stationary point as follows: = − = − 0,09073 0,34581 -2,00468 1,43476 2 1
0 B b
a. Contour and surface plot on conditions X3 and X4 in the stationary point Contour Plot of Y4 vs X2, X1 Surface Plot of Y4 vs X2, X1
b. Contour and surface plot on conditions X2 and X3 in the stationary point Contour Plot of Y4 vs X3, X1 Surface Plot of Y4 vs X2, X1
d. Contour and surface plot on conditions X1 and X4 in the stationary point Contour Plot of Y4 vs X3, X2 Surface Plot of Y4 vs X3, X2
e. Contour and surface plot on conditions X1 and X3 in the stationary point Contour Plot of Y4 vs X3, X2 Surface Plot of Y4 vs X4, X2
f. Contour and surface plot on conditions X3 and X4 in the stationary point Contour Plot of Y4 vs X4, X3 Surface Plot of Y4 vs X4, X3
Thus, the solution in response to the stationary point is obtained as follows:
Furthermore, the stationary point can be restored to the true value, acquired conditions that provide the optimal solution (Table 6) was as follows:
Table 7: Optimal Value of cadmium
Variable Optimal value Optimal value (with coding) (without coding)
X1 1,43476 0,8435
X2 2,00468 8,0047
X3 -0,34581 -0,6346
X4 0,09073 61,8146
where X1 = calcon concentration (mM), X2 = pH, X3 = accumulation potential (Volt), and X4 = accumulation time (seconds). To get an idea of the characteristics of the surface of the response calculating eigen values (l) of the matrix B and obtained :
[
-
23,1582
-
22,5219
-
18,5531
-
4,1201
]
=
l
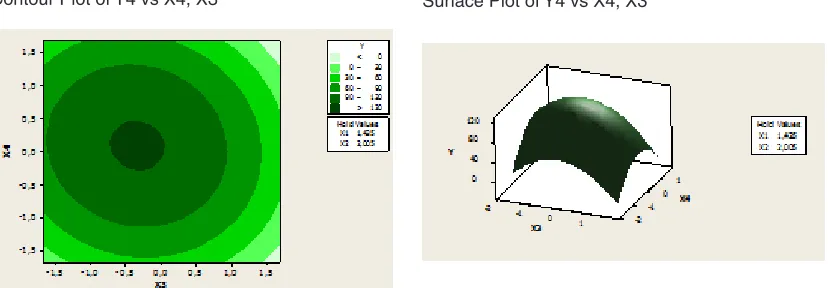
Because all four eigen values is negative, then the surface shape is the maximum response. It can be seen plot contour and response surface plot. By making constans two of the four factors were observed at a stationary point, then it may be possible to plot contour and response surface as shown in Figure 1.
Based on data analysis with CCD, it is concluded that the peak flow will reach its maximum value at the time of calcon concentration 0.8435 mM, pH 8.0047, accumulation potential -0.6346 Volt and accumulation time 81.85 seconds with a maximum peak current value of cadmium 61.8146 nA.
Contour and surface plot of cadmium at stationary point
By making constant two of the four factors used, then it can be shown that the shape and surface contour is the maximum response. The following will be presented contour plot and the surface on every possible pair of factors used.
Analysis of Real Samples
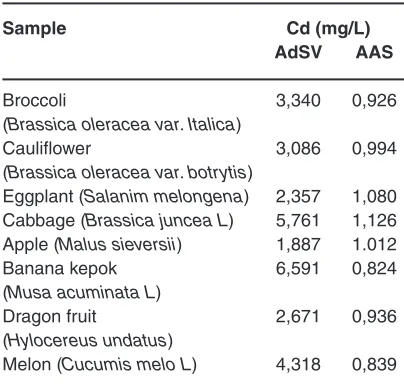
To evaluate the validity of the proposed method for real sample analysis, the proposed procedure was applied to various fruit and vegetable samples. The cadmium contents of fruit and vegetable samples were determined by standard addition method using the recommended procedure under optimum conditions. The results in Tables 7 show that the method is good results with relative standard deviation of 0.84%, recovery 98.884%, the linear range up to 110 µg/L, limit of detection 1.009 µg/L and LOQ 3.363 µg/L). Also, as it can be seen, the assay results for all the fruit and vegetable samples were in good agreement with the values that were obtained by standard atomic absorption spectroscopy.
CONCLUSION
Based on data analysis with central composite design, the simultaneous determination Table 8: Determination of Cd using Adsorptive stripping voltammetry (AdSV) and Atomic
absorption spectroscopy (AAS)
Sample Cd (mg/L) AdSV AAS
Broccoli 3,340 0,926
(Brassica oleracea var. Italica)
Cauliflower 3,086 0,994
(Brassica oleracea var. botrytis)
Eggplant (Salanim melongena) 2,357 1,080 Cabbage (Brassica juncea L) 5,761 1,126 Apple (Malus sieversii) 1,887 1.012
Banana kepok 6,591 0,824
(Musa acuminata L)
Dragon fruit 2,671 0,936
(Hylocereus undatus)
1. Deswati; Suyani, H. and Safni. Indo. J. Chem. 2012, 12(1) : 20 -27
2. Deswati; Suyani, H; Safni; Loekman, U and Pardi,H. Indo. J. Chem.2013, 13(3) : 236- 241.
3. Deswati; Amelia, L; Suyani, H; Zein, R and Jin, J. Rasayan. J. Chem. 2015, 8(3) : 362- 372. 4. Deswati; Munaf, E; Suyani, H; Loekman, U
and Pardi,H. Res. J. Pharm, Biol. Chem. Sci. 2014, 5(4): 990-999.
5. Gholivand, M.B; Sohrabi, A and Abbasai, S. Electroanalysis. 2007, 19, 319-322.
6. Deswati; Munaf, E; Suyani, H; Zein, R and Pardi, H. Asian J. Chem. 2015, 27(11) : 3978- 3982.
7. Bezerra, M.A; Santelli, R.E; Oliveir, E.P; Villar, L.S and Escaleira, L.A. Talanta. 2008, 76 :
965 - 977.
8. Deswati; Rahmi HG, I; Suyani, H; Zein, R and Alif, A. Rasayan J. Chem. 2016, 9(1) : 8-17 9. Rahmi HG, I; Deswati; Suyani, H and Zein, R.
Res. J. Pharm, Biol. Chem. Sci. 2016, 7(3): 673-682
10. Deswati; Suyani, H; Zein, R and Rahmi,I. J. Chem. and Parm Res. 2015, 7(8) : 750-757.
11. Oramahi, H.A.Theory and aplication of Respon Surface Methodology, Publisher Ardana Media, Yogyakarta. 2008, 6 -12. 12. Ensafi, A.A; Abbasiand, S and Mansour, H.R.
Anal. Sci.2001, 17 : 609-612
13. Paolicchi, I; Renedo, O.D; Lomillo, M.A.L and Martinez, M.A.A. Anal. Chem. Acta. 2004, 511: 223 – 229
14. Dewi, A.K; Sumarjaya, I.w and Srinadi, I.G.A.M. E-Journal of Math. 2013, 2(2) : 32-36. REFERENCES
of cadmium obtained optimum conditions, namely: calcon concentration 0.8435 mM, pH 8.0047, accumulation potential -0.6346 Volt and accumulation time 81.85 seconds with a maximum peak current value of cadmium 61.8146 nA. The method has a very excellent with relative standard deviation of 0.84%, recovery 98.884%, the linear range up to 110 µg/L, limit of detection 1.009 µg/L and LOQ 3.363 µg/L. The central composite design can be applied to the determination of cadmium in fruit and vegetable samples quickly, effectively and efficiently.
ACKNOwLEGMENT