332 | P a g e
DETERMINE STRESS CONCENTRATION FOR SIMPLY
SUPPORTED BEAM WITH OPPOSITE ELLIPTICAL
NOTCH SUBJECTED TO PURE BENDING
Bhavik Padhiyar
1, Dr.Pushpendra Kumar Sharma
2, Prof. Yogesh Mishra
31
M.tech Research Scholar,
2Guide & Head,
3Co-guide & Assistant Professor,
Mechanical Engineering Department, NRIIST, Bhopal M.P. (India)
ABSTRACT
The stress-concentration factor under bending has been studied for various types of notch and hole. The results have
been widely used for engineering design. Bending is a fundamental and inevitable type of loading, so that the effect of
plastic deformation on the Stress concentration factor under bending should be ascertained. The elementary formulas
used in design are based on members having a constant section or a section with gradual change of contour. Such
conditions however, are hardly ever attained in actual machine parts and structural members. The finite element
method (FEM) (its practical application often known as finite element analysis (FEA)) is a numerical technique for
finding approximate solution of partial differential equation (PDE) as well as integral equation.
In solving partial differential equations, the primary challenge is to create an equation that approximates the equation to
be studied , but is numerically stable , meaning that error in the input and intermediate calculation do not accumulate
and cause the resulting output to be meaningless. There are many ways of doing this, all with advantages and
disadvantage. The finite element method is a good choice for solving partial differential equation over complicated
domain (like beam or notch analysis etc), when domain changes (as during a solid state reaction with a moving
boundary) etc.
Key Words
:
Finite Element Analyses, FEA, Partial Differential Equation, PDE, Stress Concentration
I STRESS CONCENTRATION
The fracture of a material is dependent upon the forces that exist between the atoms. Because of the forces that exist between the atoms, there is a theoretical strength that is typically estimated to be one-tenth of the elastic modulus of the material. However, the experimentally measured fracture strengths of materials are found to be 10 to 1000 times below this theoretical value. The discrepancy is explained to exist because of the presence of small flaws or cracks found either on the surface or within the material. These flaws cause the stress surrounding the flaw to be amplified where the magnification is dependent upon the orientation and geometry of the flaw.
333 | P a g e
increasing distance away from the crack. The stress is concentrated around the crack tip or flaw developing the concept of stress concentration. Stress raisers are defined as the flaws having the ability to amplify an applied stress in the local.Fig. 1.1: (a) The geometry of surface and internal cracks. (b) Schematic stress profile along the line X-X' in (a),
demonstrating stress amplification at crack tip positions.
It is important to bring in notice that stress amplification not only occurs on a microscopic level (e.g. small flaws or cracks,) but can also occur on the macroscopic level in the case of sharp corners, holes, fillets, and notches. Fig. 1.2 depicts the theoretical stress concentration factor curves for several simple and common material geometries.
Fig. 1.2: Stress Concentration Factor Plots for Three Different Macroscopic Flaw Situations.
334 | P a g e
II ANALYSES AND INTERPRETATION
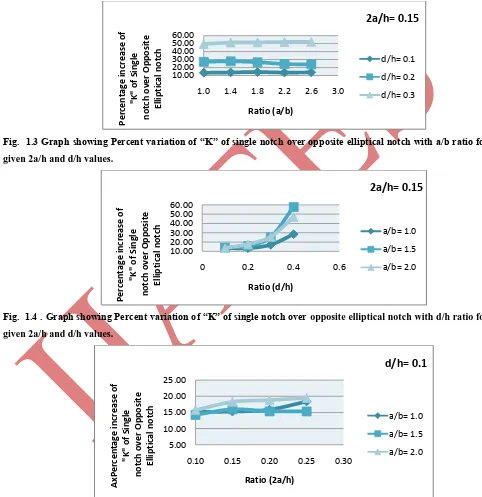
Stress Concentration Factor for a series of beams with varying a/b, d/h and 2a/h ratios are analyzed. A Plot of Stress Concentration Factor “K” with respect to a/b for given 2a/h and d/h ratio. The percentage increase of the stress concentration factor of the single variable radius notch over the optimum opposite semi elliptical notch as a function of various ratios of a/b, d/h and 2a/h ratios are shown in figure as below:
Fig. 1.3 Graph showing Percent variation of “K” of single notch over opposite elliptical notch with a/b ratio for
given 2a/h and d/h values.
Fig. 1.4 . Graph showing Percent variation of “K” of single notch over opposite elliptical notch with d/h ratio for
given 2a/h and d/h values.
Fig. 1.5 Graph showing Percent variation of “K” of single notch over opposite elliptical notch with 2a/h ratio for
given a/b and d/h values.
10.00 20.00 30.00 40.00 50.00 60.00
1.0 1.4 1.8 2.2 2.6 3.0
Per ce n tage in cr e ase o f "K " o f Si n gl e n o tc h o ve r Op p o si te El lip tical n o tc h Ratio (a/b)
2a/h= 0.15
d/h= 0.1 d/h= 0.2 d/h= 0.3 10.00 20.00 30.00 40.00 50.00 60.000 0.2 0.4 0.6
Per ce n tage in cr e ase o f "K " o f Si n gl e n o tc h o ve r Op p o si te El lip tical n o tc h Ratio (d/h)
2a/h= 0.15
a/b= 1.0 a/b= 1.5 a/b= 2.0 5.00 10.00 15.00 20.00 25.000.10 0.15 0.20 0.25 0.30
335 | P a g e
The test results show a significant reduction in the stress concentration factor for the opposite elliptical notch relative to the single semielliptical notch for the ranges of d/h for given 2a/h value and a/b from 1.0 to 2.6, approximately 13 to 53 percent. Similarly, the reduction in stress concentration factor for the ranges of a/b for given 2a/h value and d/h from 0.1 to 0.4, approximately 13 to 58 percent. Considerable amount of percentage reduction is also found for the ranges of a/b for given d/h value and 2a/h from 0.1 to 0.25, approximately 14 to 20 percent.Modeling:
The modeling software used in this work is Pro-E in which the rectangular cross section beam with notches at the opposite faces is produced and is utilized in the ANSYS 12.0 for analysis.
Fig. 1.6: Pro-E model of Beam with double notch
Material Property:The below mentioned properties of Homalite 100 is applied to the model.
Properties Values
Young's Modulus 3860 MPa
Poisson’s Ratio 0.35
Density 1230 kg/cubic meter
Table 1.7: Properties of material used in FEM analysis Meshing:
Hexagonal mesh is done on the whole volume of the model. The element size is of 2 mm.
336 | P a g e
The reductions in stress concentration factors varied from a maximum of about 58 percent to a minimum of 13 percent. This order of reduction in stress concentration factors or stress level is significant in the design of lighter aerospace structures, especially structural components subjected to fatigue from cyclic loading.III POSTPROCESSOR
The results can be evaluated once the simulation has been completed and the displacements, stresses, or other fundamental variables have been calculated. The evaluation is generally done interactively using the Visualization module of ANSYS or another postprocessor. The Visualization module, which reads the neutral binary output database file, has a variety of options for displaying the results, including color contour plots, animations, deformed shape plots, and X–Y plots. These results allow the engineer to evaluate the design from the aspects of loading conditions and load requirements. The modeling simulation shows the optimum design that can be adopted for pure bending condition.
REFRENCES
[1] Peterson RE. Stress concentration factors. New York: Wiley; 1974.
[2] Pilkey WD. Peterson’s stress concentration factors, 2nd ed. New York: John Wiley & Sons; 1997. [3] ANSYS. User manual, version 12.0. Canonsburgh (PA): ANSYS Inc.
[4] Leven, M.M., Frocht, M.M., 1952. Stress-concentration factors for single notch in flat bar in pure and central bending. J. Applied Mechanics.
[5] Shigley JE, Mischke CR. Standard handbook of machine design. McGraw-Hill.
[6] Troyani N, Gomes C, Sterlacci G. Theoretical stress concentration factors for short rectangular plates with centered circular holes. J. Mech. Design 2002;124:126–8.
[7] Ching, A., Okubo, S., and Tsao, C. Stress concentration factors for multiple semielliptical notches in beams under pure bending. Expl Mechanics, 1968, 8, 19N–24N.
[8] Pedersen, P. Suggested benchmarks in shape optimization for minimum stress concentration. Structure Multidisciplinary Optimization, 2007.
337 | P a g e
[10]Design for Strength tutorial, version 2, Mechanical Engineering, IIT Kharagpur.[11]Photo elastic Analysis of Stress Concentration for beams in pure bending with a central hole by D.Y. James Rayan and Leander j Fischer, Mechanical Engineering Department, University of Minnesota.
[12]Interaction of dynamic mode-I cracks with inclined interfaces V.B. Chalivendra and A.J. Rosakis, Department of Mechanical Engineering, University of Massachusetts Dartmouth.