RESEARCH
Cost-effectiveness analysis of a universal
mass vaccination program with a PHiD-CV 2
+
1
schedule in Malaysia
Xiao Jun Wang
1,2, Ashwini Saha
3and Xu‑Hao Zhang
1,2*Abstract
Background: Currently, two pediatric pneumococcal conjugate vaccines are available in the private market of Malaysia—13‑valent pneumococcal conjugate vaccine (PCV13) and pneumococcal polysaccharide and non‑typeable Haemophilus influenzae protein D conjugate vaccine (PHiD‑CV). This study aimed to evaluate the cost‑effectiveness of a universal mass vaccination program with a PHiD‑CV 2+1 schedule versus no vaccination or with a PCV13 2+1 schedule in Malaysia.
Methods: A published Markov cohort model was adapted to evaluate the epidemiological and economic conse‑ quences of programs with no vaccination, a PHiD‑CV 2+1 schedule or a PCV13 2+1 schedule over a 10‑year time horizon. Disease cases, deaths, direct medical costs, quality‑adjusted life‑years (QALYs) and incremental cost‑effec‑ tiveness ratios (ICERs) were estimated. Locally published epidemiology and cost data were used whenever possible. Vaccine effectiveness and disutility data were based on the best available published data. All data inputs and assump‑ tions were validated by local clinical and health economics experts. Analyses were conducted from the perspective of the Malaysian government for a birth cohort of 508,774. Costs and QALYs were discounted at 3% per annum. One‑ way and probabilistic sensitivity analyses were performed.
Results: Compared with no vaccination, a PHiD‑CV 2+1 program was projected to prevent 1109 invasive pneumo‑ coccal disease (IPD), 24,679 pneumonia and 72,940 acute otitis media (AOM) cases and 103 IPD/pneumonia deaths over 10 years, with additional costs and QALYs of United States dollars (USD) 30.9 million and 1084 QALYs, respec‑ tively, at an ICER of USD 28,497/QALY. Compared with a PCV13 2+1 program, PHiD‑CV 2+1 was projected to result in similar reductions in IPD cases (40 cases more) but significantly fewer AOM cases (30,001 cases less), with cost savings and additional QALYs gained of USD 5.2 million and 116 QALYs, respectively, demonstrating dominance over PCV13. Results were robust to variations in one‑way and probabilistic sensitivity analyses.
Conclusions: A PHiD‑CV 2+1 universal mass vaccination program could substantially reduce pneumococcal disease burden versus no vaccination, and was expected to be cost‑effective in Malaysia. A PHiD‑CV 2+1 program was also expected to be a dominant choice over a PCV13 2+1 program in Malaysia.
Keywords: Pneumococcal conjugate vaccines, Malaysia, Cost‑effectiveness, PHiD‑CV, PCV13
© The Author(s) 2017. This article is distributed under the terms of the Creative Commons Attribution 4.0 International License (http://creativecommons.org/licenses/by/4.0/), which permits unrestricted use, distribution, and reproduction in any medium, provided you give appropriate credit to the original author(s) and the source, provide a link to the Creative Commons license, and indicate if changes were made. The Creative Commons Public Domain Dedication waiver (http://creativecommons.org/ publicdomain/zero/1.0/) applies to the data made available in this article, unless otherwise stated.
Background
Streptococcus pneumoniae can result in a range of dis-eases, from invasive pneumococcal diseases (IPDs) (e.g. meningitis and bacteremia) to pneumonia and acute
otitis media (AOM) [1]. Data from the World Health Organization (WHO) suggest that pneumococcal dis-eases caused around 480,000 deaths among children under 5 years of age in 2008 [2], making it the leading cause of vaccine-preventable death among children glob-ally [3]. In addition, pneumonia has been reported as the fourth leading cause of death in 2009 among the Minis-try of Health hospitals in Malaysia, accounting for 10.4%
Open Access
*Correspondence: [email protected]
2 GSK, 150 Beach Road, #22‑00 Gateway West, Singapore 189720, Singapore
of inpatient deaths [4]. Although AOM is a much milder disease than pneumonia or IPDs, it is very common and is therefore associated with substantial impacts on healthcare costs and quality of life [5, 6]. Invasive disease, pneumonia and AOM can also be caused by microorgan-isms other than S. pneumoniae, including non-typeable Haemophilus influenzae (NTHi) [7, 8].
Pneumococcal conjugate vaccines (PCVs) were rec-ommended as a priority for inclusion in national child-hood immunization programs in all countries by the WHO in 2007 [9]. Although they are not currently included in the national immunization program in Malaysia, two PCVs are available in the private mar-ket of Malaysia: a 13-valent pneumococcal conjugate vaccine (PCV13; Prevenar 13) and a pneumococcal polysaccharide and NTHi protein D conjugate vaccine (PHiD-CV; Synflorix).
Two prior cost-effectiveness analyses have com-pared a 3+1 schedule using either PHiD-CV or PCV13 in Malaysia [10, 11], but the results are inconsistent. Aljunid et al. [10] predicted that PHiD-CV would be more cost-effective than PCV13, but Wu et al. [11] predicted the opposite. Unlike Aljunid et al. [10], Wu et al. [11] did not account for the protective effects of PHiD-CV in a number of key areas: (1) cross-protec-tion against serotypes 6A and 19A, which has been demonstrated in a number of recent studies [12–14]; (2) indirect (herd) protection against IPD, which has been shown in surveillance data from Finland [15] and New Zealand [16]; and (3) protection against NTHi AOM, which has been shown in both the randomized controlled Clinical Otitis Media and Pneumonia Study (COMPAS) study [17] and the randomized controlled Pneumococcal Otitis Efficacy Trial (POET) study of PHiD-CV’s 11-valent precursor [18]. Wu et al.’s [11] methodology has recently been critiqued by Varghese et al. [19]. Excluding the protective effects of PHiD-CV in these key areas is against the current evidence and could have had a significant impact on the cost-effectiveness of PHiD-CV versus PCV13. It is therefore necessary to conduct another cost-effectiveness analy-sis, taking into account the latest evidence of vaccine effectiveness.
The goal of this economic evaluation was to assess the cost-effectiveness of universal mass pneumococcal vac-cination with a PHiD-CV 2+1 vaccination strategy ver-sus no vaccination or a PCV13 2+1 vaccination strategy from the perspective of the Malaysian government. The results from this study can provide scientific evidence for Malaysian healthcare policymakers to support their deci-sion making on the introduction of PCV into the national immunization program (Additional file 1).
Methods
A published Markov cohort model [20] was adapted to simulate the epidemiological and economic burden of pneumococcal and NTHi-related diseases (IPD, pneumo-nia and AOM) over a 10-year time horizon in Malaysia. In this study, infants could be vaccinated with PHiD-CV 2+1 or PCV13 2+1 or neither, as these are the
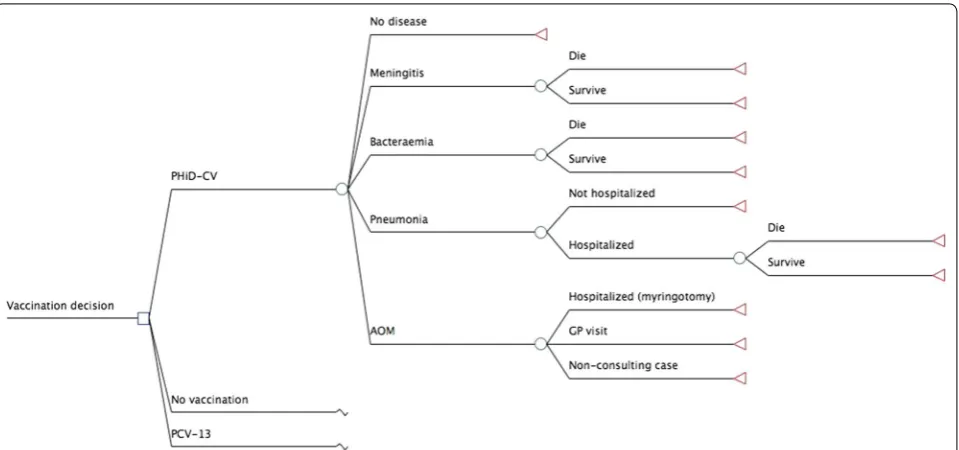
vaccina-tions being considered for inclusion in the Malaysian universal mass vaccination program. The model has a number of mutually exclusive disease-related outcomes, namely pneumococcal meningitis, pneumococcal bacte-remia, all-cause pneumonia, AOM and no pneumococcal infection (Fig. 1). Patients with AOM could be hospital-ized (myringotomy), visit their general practitioner (GP) or be non-consulting. Patients with pneumonia could be treated as outpatients or inpatients. Those with meningi-tis, bacteremia or hospitalized pneumonia were at risk of death. Individuals of the birth cohort moved between the Markov states according to estimated transition prob-abilities. The reason for choosing 10 years’ time horizon in the base case is because we assumed that the duration of vaccine protection to be 10 years for the 2+1 regimen.
In addition, it is because the serotypes are changing over time due to the vaccination program [21].
The analyses were conducted from the perspective of the Malaysian government for a birth cohort of 508,774 in 2012 [22]. Costs and quality-adjusted life-years (QALYs) were discounted at 3% per annum according to Malaysian guidelines [23]. All costs are reported in 2014 United States dollars (USD), converted when neces-sary from Malaysian Ringgits (MYR) using the exchange rate as at 31 Dec 2014 (3.5 MYR = 1 USD) [24]. The
model and all-related data inputs and assumptions were reviewed and validated by a group of local clinical and health economics experts to ensure the validity of the model adaptation in the local setting.
Epidemiological data (Table 1)
were also lacking in Malaysia, but hospitalized pneumo-nia incidence rates were available. Therefore, an estimate was calculated, based on Malaysian hospitalization rates [25] and the ratio of Taiwanese GP consultation to hospi-talization rates [26], considering similar healthcare access level within a country. Due to a lack of local/regional
data on the long-term sequelae of IPD, these were not included.
Age-specific AOM GP consultation rates (Additional file 2: Table S3) were based on published data from the Philippines [27] due to the lack of Malaysian data. Myrin-gotomy rates (Additional file 2: Table S3) were adapted
Fig. 1 Model structure. PHiD-CV pneumococcal polysaccharide and NTHi protein D conjugate vaccine, PCV13 13‑valent pneumococcal conjugate vaccine, AOM acute otitis media, GP general practitioner
Table 1 Country-specific model parameters for Malaysia
AOM acute otitis media, CFR case fatality ratio, GP general practitioner, PSA probabilistic sensitivity analysis, NA not applicable
a Ranges used in the one-way sensitivity analyses
b Age-specific values are in Additional file 2: Table S1
c Age-specific values are in Additional file 2: Table S2
d Age-specific values are in Additional file 2: Table S3
Parameter Value in children aged <5 y References Rangea PSA distribution
Birth cohort size (2012) 508,774 [21] Not varied NA
Hospitalized pneumococcal meningitis
Incidence (per 100,000)b 34.7 [25] ±50% Triangular
CFR (%)b 12.5–19.2 [26] ±20% Triangular
Hospitalized pneumococcal bacteremia
Incidence (per 100,000)b 46.3 [25] ±50% Triangular
CFR (%)b 4.1–4.9 [26] ±20% Triangular
All‑cause pneumonia
GP consultation rate (per 100,000)c 4600–12,517 [25, 26] ±50% Triangular
Hospitalization rate (per 100,000)c 765.8 [25] ±20% Triangular
CFR (%)c 0.0–0.4 [26] ±20% Triangular
All‑cause AOM
GP consultation rate (per 100,000)d 11,745–16,412 [27] ±50% Triangular
from data from the Philippines [27] that were based on insurance data from Taiwan [26] and consultation with local ear, nose and throat experts. In the base case, all cases of AOM were assumed to result in a GP consulta-tion. Complications and long-term sequelae of AOM were very conservatively not taken into account, due to a lack of suitable data.
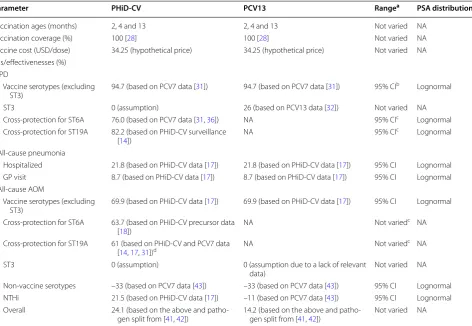
Vaccine effectiveness data (Table 2)
Vaccination was assumed to occur at ages 2, 4 and 13 months. In the base case, it was assumed that 100% of infants would be vaccinated, as WHO 2015 immuni-zation coverage estimates for Malaysia for other child-hood vaccines were close to 100% [28]. It was further assumed that all children would receive the defined num-ber of doses at the recommended times, hence the effect
of partial vaccination was not considered. Both vaccines were assumed to cost USD 34.25 per dose (hypothetical price). Due to a lack of local data, administration costs were not considered; and vaccine wastage was assumed to be 0%.
Vaccine effectiveness was assumed to have a ramp-up increase from age 2–13 months (50% after dose 1; 90% after dose 2), have full effectiveness from age 13 months to 3 years, and have waning effectiveness (exponential decline) to age 10 years [20].
Against IPD, PHiD-CV has been estimated to have vaccine efficacies (VEs) of 92% for the 2+1 schedule and 100% for the 3+1 schedule in the randomized, con-trolled Finnish Invasive Pneumococcal disease (FinIP) trial [29]. However, PCV13 has no published randomized controlled trial data against IPD. Therefore, vaccine
Table 2 Vaccine-specific model parameters
AOM acute otitis media, CI, confidence interval, GP general practitioner, IPD invasive pneumococcal disease, NA not applicable, NTHi non-typeable Haemophilus
influenzae, PCV7 7-valent pneumococcal conjugate vaccine, PCV13 13-valent pneumococcal conjugate vaccine, PHiD-CV pneumococcal polysaccharide and NTHi
protein D conjugate vaccine, ST serotype, USD United States dollars, VE vaccine efficacy, PSA probabilistic sensitivity analysis
a Ranges used in the one-way sensitivity analyses
b Lowest and highest vaccine-type 95% CIs from [31] used for all serotypes
c Not applicable for PCV13
d Estimated based on PHiD-CV VE against 19A IPD [14], PCV7 VE against vaccine serotype IPD [31], and PHiD-CV VE against vaccine serotype AOM [17]
Parameter PHiD-CV PCV13 Rangea PSA distribution
Vaccination ages (months) 2, 4 and 13 2, 4 and 13 Not varied NA
Vaccination coverage (%) 100 [28] 100 [28] Not varied NA
Vaccine cost (USD/dose) 34.25 (hypothetical price) 34.25 (hypothetical price) Not varied NA
VEs/effectivenesses (%) IPD
Vaccine serotypes (excluding
ST3) 94.7 (based on PCV7 data [31]) 94.7 (based on PCV7 data [31]) 95% CI
b Lognormal
ST3 0 (assumption) 26 (based on PCV13 data [32]) Not varied NA
Cross‑protection for ST6A 76.0 (based on PCV7 data [31, 36]) NA 95% CIc Lognormal
Cross‑protection for ST19A 82.2 (based on PHiD‑CV surveillance
[14]) NA 95% CI
c Lognormal
All‑cause pneumonia
Hospitalized 21.8 (based on PHiD‑CV data [17]) 21.8 (based on PHiD‑CV data [17]) 95% CI Lognormal
GP visit 8.7 (based on PHiD‑CV data [17]) 8.7 (based on PHiD‑CV data [17]) 95% CI Lognormal
All‑cause AOM
Vaccine serotypes (excluding
ST3) 69.9 (based on PHiD‑CV data [17]) 69.9 (based on PHiD‑CV data [17]) 95% CI Lognormal
Cross‑protection for ST6A 63.7 (based on PHiD‑CV precursor data
[18]) NA Not varied
c NA
Cross‑protection for ST19A 61 (based on PHiD‑CV and PCV7 data
[14, 17, 31])d NA Not varied
c NA
ST3 0 (assumption) 0 (assumption due to a lack of relevant
data) Not varied NA
Non‑vaccine serotypes –33 (based on PCV7 data [43]) –33 (based on PCV7 data [43]) 95% CI Lognormal
NTHi 21.5 (based on PHiD‑CV data [17]) –11 (based on PCV7 data [43]) 95% CI Lognormal
Overall 24.1 (based on the above and patho‑
effectiveness against IPD (pneumococcal meningitis and bacteremia) for both vaccines was estimated based on serotype distribution in Malaysia and serotype-specific efficacies. Serotype distribution was based on data from 217 invasive strains isolated in Malaysia in 2008–2009 [30] (Additional file 2: Figure S1). Based on the aver-age VE of PCV7 against its seven serotypes [31], a VE of 94.7% was used for the 10 serotypes included in both vaccines (1, 4, 5, 6B, 7F, 9 V, 14, 18C, 19F, 23F) and for 6A and 19A for PCV13. However, serotype 3 in PCV13 has generally been shown to be less effective [32–35], so a VE of 26% was assumed [32]. Post-marketing surveillance studies of PHiD-CV have demonstrated cross-protection of PHiD-CV against 19A IPD with vaccine effective-nesses of 62% (95% confidence interval [CI] 20–85%) in Finland [13], 71% (95% CI 24–89%) in Canada [12] and 82.2% (95% CI 10.7–96.4%) in Brazil [14]. Based on local expert opinion, 82.2% from Brazil [14] was used, due to the potential similarity of economic status, healthcare systems and seasonality. Cross-protection of PHiD-CV against serotype 6A was based on cross-protection of PCV7 against serotype 6A (76.0% [31]), as PHiD-CV has been demonstrated to be immunogenically non-inferior to PCV7 [36].
Vaccine effectiveness against all-cause pneumonia is lower than against IPD as it can be caused by a num-ber of pathogens. VE against all-cause pneumonia has been reported in various trials, with PCV7 (18% [95% CI 5–29%] [37]), PCV9 (20% [95% CI 2–35%] [38] and 35% [95% CI 26–43%] [39]), PHiD-CV (22% [95% CI 8–34%] [17]) and PCV11 (16% [95% CI –7 to 34%] [40]) (all intention-to-treat analyses), with no relationship between valency and VE. As there are no published ran-domized controlled studies for PCV13 against all-cause pneumonia, we used the value of 21.8% for consolidated pneumonia from COMPAS (PHiD-CV) [17] as the VE against pneumonia hospitalizations for both vaccines. VE against all-cause suspected pneumonia (8.7%) was taken from the same study [17] and was used for pneumonia associated with a GP visit.
Overall vaccine effectiveness against AOM was esti-mated based on causative pathogens (S. pneumoniae, H. influenzae or other) and VE against vaccine and non-vaccine S. pneumoniae serotypes and NTHi. Based on a review paper by Leibovitz et al. [41] of 17 AOM etiology studies across the world, we assumed that 35.9% of AOM cases were attributable to S. pneumoniae and 32.3% to NTHi. Data from a multinational AOM study were used for the percentages of AOM cases caused by each serotype [42]. VE against vaccine-type S. pneumoniae (excluding serotype 3) for both vaccines was taken to be 69.9% based on COMPAS [17]. For PHiD-CV, vaccine efficacies of 63.7% [18] and 61% [14, 17, 31] for serotypes 6A and 19A, respectively, were used. For both vaccines, a negative VE of −33% was used against other non-vaccine serotypes based on PCV7 data [43]. This study also gave a VE for PCV7 against H. influenzae AOM of
−11% [43], which was used for PCV13. Two studies have demonstrated efficacy of PHiD-CV [17] (or its 11-valent precursor [18]) against NTHi AOM. The lower value of 21.5% (95% CI−43.4 to 57.0%) from COMPAS [17] was used. Although the 95% CI spans zero, it should be noted that the COMPAS trial [17] was not powered to provide conclusive evidence of protection against NTHi AOM. However, the positive effect of PHiD-CV against NTHi AOM is consistent with the significant efficacy observed with the 11-valent predecessor protein D con-jugate formulation used in the POET study (35.3% [95% CI 1.8–57.4%]) [18]. The overall estimated vaccine effec-tivenesses against AOM were 24.1% for PHiD-CV and 14.2% for PCV-13.
No vaccine effectiveness for PHiD-CV against NTHi invasive disease or pneumonia was assumed due to a lack of evidence. Indirect effects (herd protection and sero-type replacement) were also not taken into account in the base case.
Health outcomes (Table 3)
Due to a lack of published pneumococcal disease-related disutility weights in Malaysia, short-term disutility data
Table 3 Short-term disutility weights of pneumococcal diseases
AOM acute otitis media, PSA probabilistic sensitivity analysis
a Ranges used in the one-way sensitivity analyses
Disutility weight Reference/assumptions Rangea% PSA distribution
Meningitis (inpatient) 0.023 [44] value for meningitis with recovery ±50 Beta (α = 7.70, β = 324.15)
Bacteremia (inpatient) 0.008 [44] value for hospitalization ±50 Beta (α = 6.46, β = 811.13)
Pneumonia (inpatient) 0.008 Assumed to be the same as for inpatient bacteremia ±50 Beta (α = 6.62, β = 821.25)
Pneumonia (outpatient) 0.006 [44] value for local infection ±50 Beta (α = 3.73, β = 618.18)
AOM (outpatient) 0.005 [45] ±50 Triangular
from the US [44] and Canada [45] were applied to age-specific healthy utilities [46].
Treatment costs (Table 4)
Only direct medical costs were included. Direct medical costs for acute episodes were based on local published data from 2010 [10]. Costs were inflated using the con-sumer price index for heath for Malaysia [47] to 2014 val-ues and then converted into USD [24].
Cost-effectiveness analysis
The model estimated cases, costs and QALYs specific to each health state over 10 years from birth for PHiD-CV 2+1, PCV13 2+1 or neither. Incremental cost-effective-ness ratios (ICERs) were computed for PHiD-CV 2+1 versus no vaccination and PHiD-CV 2+1 versus PCV13 2+1. Due to the lack of locally published threshold, the WHO threshold was used to categorize the cost-effec-tiveness results of this analysis [48]: a strategy was con-sidered either as dominant (lower cost and more QALYs), highly cost-effective (ICER less than the gross domestic product [GDP] per capita of Malaysia [10,333 USD in 2014 [24, 49]]), cost-effective (ICER < 3 × GDP per capita [30,999 USD]) or not cost-effective (ICER ≥ 3 × GDP per capita).
Sensitivity analyses
For comparisons of PHiD-CV 2+1 versus no vacci-nation or PCV13 2+1, extensive one-way sensitivity analyses were performed to evaluate the robustness of the results. These were mainly performed using values based on the upper and lower limits of 95% CIs for vac-cine effectiveness and ±20 or ±50% of base-case values for most other parameters (see Tables 1, 2, 3, 4 for fur-ther details).
Probabilistic sensitivity analyses (PSAs) were per-formed for PHiD-CV 2+1 versus no vaccination or PCV13 2+1, each using 1000 simulations.
Scenario analyses
A set of alternative scenario analyses on parameters of particular interest were performed for comparisons of PHiD-CV 2+1 versus no vaccination or PCV13 2+1:
(1) discount rates of 0 and 5, as per Malaysian guidelines [23]; (2) a lower proportion of AOM cases due to NTHi (20% rather than 32.3%); (3) a different adjustment factor for estimating total AOM cases (i.e. consulting plus non-consulting cases) (0.7 and 1.3 rather than 1.0); (4) a time horizon of 100 rather than 10 years; (5) inclusion of indi-rect effects (herd protection and serotype replacement) for all age groups and both vaccines (only applied to IPD [50]); it was assumed that this would reach a steady state of 30% (i.e. 30% reduction in disease incidence).
Results
Cost-effectiveness analysis PHiD‑CV 2+1 versus no vaccination
It was projected that vaccination with a PHiD-CV 2+1
program would prevent 1109 cases of IPD, 24,679 cases of all-cause pneumonia, 72,940 cases of AOM and 103 IPD/pneumonia deaths compared with no vaccination strategy for the birth cohort of 508,774 in Malaysia over 10 years (Table 5).
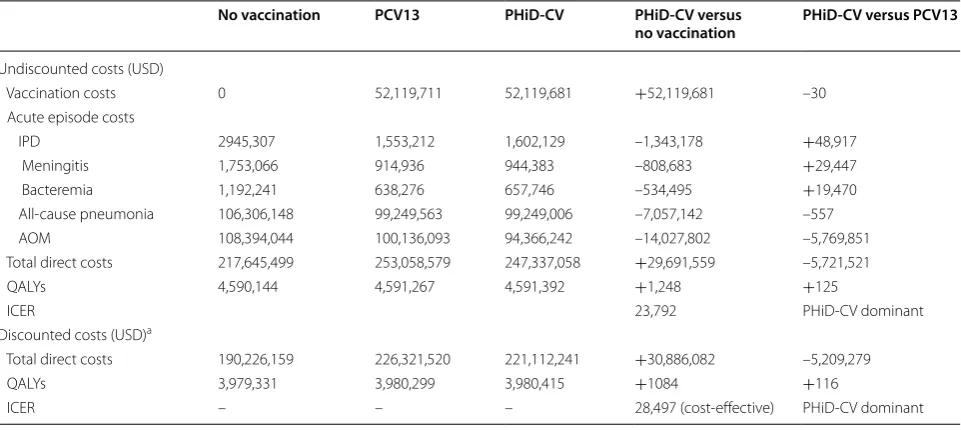
Undiscounted vaccination costs were estimated to be USD 52.1 million, but these would be partially offset by a reduction in direct medical costs of USD 22.4 million, for a total direct medical cost of USD 29.7 million (Table 6). Discounted total cost and QALY increases were predicted to be USD 30.9 million and 1084 QALYs, respectively, demonstrating a cost-effective ICER of USD 28,497/QALY.
PHiD‑CV 2+1 versus PCV13 2+1
It was projected that vaccination with a PHiD-CV 2+1
program would result in 40 more IPD cases than vaccina-tion with a PCV13 2+1 program, but 30,001 fewer cases
of AOM (Table 5). Similarly, undiscounted direct medical costs with PHiD-CV 2+1 were predicted to be somewhat
Table 4 Costs for acute episodes of pneumococcal diseases [10]
AOM acute otitis media, GP general practitioner, MYR Malaysian Ringgits, USD United States dollars, PSA probabilistic sensitivity analysis
a 2010 data in MYR from Aljunid et al. [10] (calculated as Cost all divided by Total cases per year) were inflated to 2014 values (consumer price index for heath for
Malaysia of 111.4 [47]) and then converted to USD (3.5 MYR = 1 USD [24])
b Ranges used in the one-way sensitivity analyses
Weighted average cost (USD 2014)a Rangeb % PSA distribution
Meningitis—hospitalized 1717 ±20 Triangular
Bacteremia—hospitalized 838 ±20 Triangular
Pneumonia—ospitalized 989 ±20 Triangular
Pneumonia—outpatient 164 ±20 Triangular
AOM—hospitalized (myringotomy) 583 ±20 Triangular
higher for IPD, but substantially lower for AOM, result-ing in an overall cost savresult-ing of USD 5.7 million (Table 6). Discounted total cost savings and QALYs gained were pre-dicted to be 5.2 million and 116, respectively, meaning that PHiD-CV 2+1 was predicted to be dominant over PCV13 2+1 (lower cost and more QALYs gained).
Sensitivity analyses
PHiD‑CV 2+1 versus no vaccination
According to one-way sensitivity analyses, the most influential factors on the cost-effectiveness of PHiD-CV 2+1 versus no vaccination were the efficacy of PHiD-CV
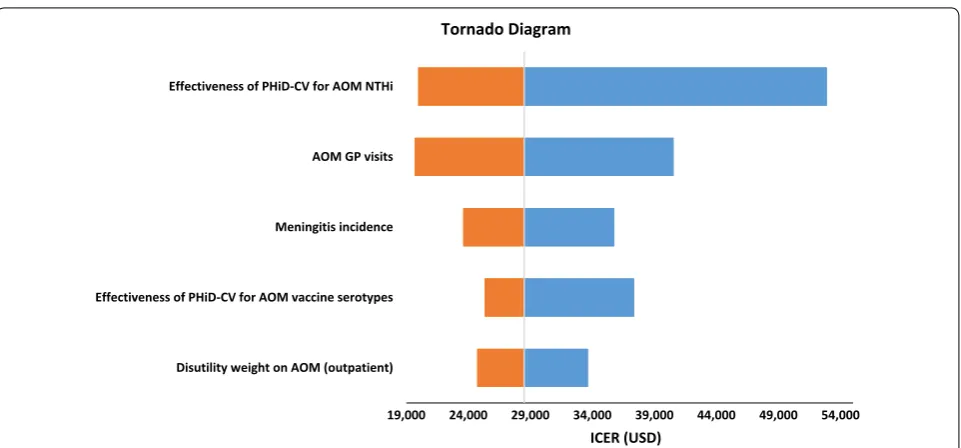
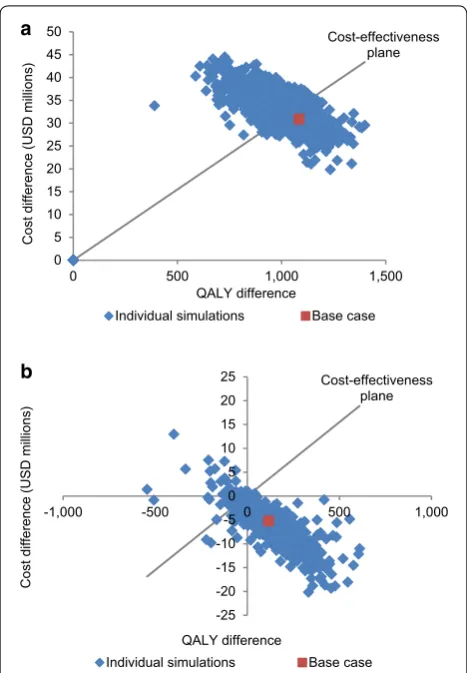
against NTHi AOM, the AOM GP consultation rate, and the incidence of hospitalized pneumococcal meningitis (Fig. 2; Additional file 2: Table S4). In the PSA, the proba-bility of PHiD-CV being cost-effective compared with no vaccination was 31.6% at the cost-effectiveness threshold for Malaysia (Fig. 3a).
PHiD‑CV 2+1 versus PCV13 2+1
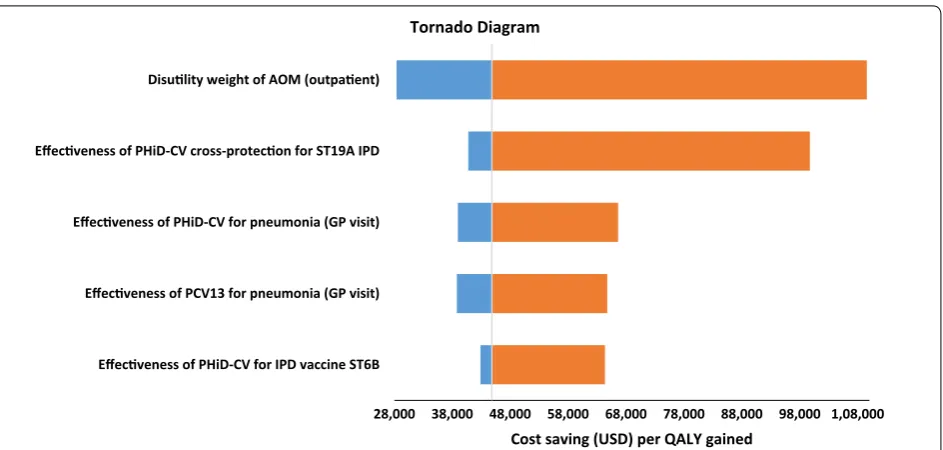
One-way sensitivity analyses showed that the most influ-ential factors were the disutility weight for AOM (out-patient) and PHiD-CV cross-protection for serotype 19A IPD (Fig. 4); but none of the varied model inputs Table 5 Estimated disease burden impacts of no vaccination, PCV13 2+1 and PHiD-CV 2+1 vaccination programs
AOM acute otitis media, IPD invasive pneumococcal disease, PCV13 13-valent pneumococcal conjugate vaccine, PHiD-CV pneumococcal polysaccharide and NTHi
protein D conjugate vaccine
In Malaysia over 10 years for a birth cohort of 508,774
No vaccination PCV13 PHiD-CV PHiD-CV versus
no vaccination PHiD-CV versus PCV13
IPD cases (acute episodes) 2444 1295 1335 –1109 +40
Meningitis 1021 533 550 –471 +17
Bacteremia 1423 762 785 –638 +23
All‑cause pneumonia cases (acute episodes) 534,819 510,143 510,140 –24,679 –3
AOM cases (acute episodes) 565,764 522,825 492,824 –72,940 –30,001
Pneumococcal deaths 239 132 136 –103 +4
IPD 209 107 111 –98 +4
Pneumonia 30 25 25 –5 0
Table 6 Estimated economic impacts of no vaccination, PCV13 2+1 and PHiD-CV 2+1 vaccination programs
Costs are in 2014 USD
AOM acute otitis media, ICER incremental cost-effectiveness ratio, IPD invasive pneumococcal disease, PCV13 13-valent pneumococcal conjugate vaccine, PHiD-CV
pneumococcal polysaccharide and NTHi protein D conjugate vaccine, QALY quality-adjusted life-year, USD United States dollars
In Malaysia over 10 years for a birth cohort of 508,774
a Discounted at 3% per annum [23]
No vaccination PCV13 PHiD-CV PHiD-CV versus
no vaccination PHiD-CV versus PCV13
Undiscounted costs (USD)
Vaccination costs 0 52,119,711 52,119,681 +52,119,681 –30
Acute episode costs
IPD 2945,307 1,553,212 1,602,129 –1,343,178 +48,917
Meningitis 1,753,066 914,936 944,383 –808,683 +29,447
Bacteremia 1,192,241 638,276 657,746 –534,495 +19,470
All‑cause pneumonia 106,306,148 99,249,563 99,249,006 –7,057,142 –557
AOM 108,394,044 100,136,093 94,366,242 –14,027,802 –5,769,851
Total direct costs 217,645,499 253,058,579 247,337,058 +29,691,559 –5,721,521
QALYs 4,590,144 4,591,267 4,591,392 +1,248 +125
ICER 23,792 PHiD‑CV dominant
Discounted costs (USD)a
Total direct costs 190,226,159 226,321,520 221,112,241 +30,886,082 –5,209,279
QALYs 3,979,331 3,980,299 3,980,415 +1084 +116
impacted on the dominant conclusion of PHiD-CV 2+1
over PCV13 2+1 (Additional file 2: Table S4). The PSA
showed PHiD-CV 2+1 to be dominant over PCV13 2+1
in 91.6% of the simulations (Fig. 3b).
Scenario analyses
Most of the scenario analyses predicted that PHiD-CV 2+1 would be cost-effective versus no vaccination;
run-ning the model over 100 years resulted in a predic-tion that PHiD-CV 2+1 would be highly cost-effective
(Table 7). Scenario analyses predicted PHiD-CV 2+1 to
be dominant over PCV13 2+1 for all scenarios tested.
Discussion
In this cost-effectiveness analysis, the adoption of pediat-ric mass vaccination with a PHiD-CV 2+1 program was
predicted to prevent 1109 cases of IPD, 24,679 cases of pneumonia, 72,940 cases of AOM, and 103 IPD/pneumo-nia-related deaths over 10 years compared with no vacci-nation program in Malaysia. PHiD-CV 2+1 was predicted
to result in 1084 QALYs gained at a cost of USD 30.9 mil-lion (discounted), resulting in a cost-effective ICER of USD 28,497/QALY. Our results are in line with various other health economic studies that have predicted that the intro-duction of routine infant vaccination with PHiD-CV would be cost-effective, including those in Georgia [51], Latin America [52–55] and Kenya [56].
Compared with a PCV13 2+1 program, a PHiD-CV
2+1 program was predicted to result in 40 more IPD
cases, but 30,001 fewer cases of AOM. This was expected to result in more QALYs gained at a lower overall cost, i.e. PHiD-CV 2+1 was predicted to be dominant over PCV13
2+1. This dominance is in line with various other
cost-effectiveness analyses, from Malaysia [10], Japan [57], the Philippines [27], Turkey [58], Europe [20, 59–61], Canada [20] and Peru [53]. However, some studies have pre-dicted the reverse: that PCV13 would be dominant over PHiD-CV (Malaysia and Hong Kong [11], Colombia [62], Europe [63] and Canada [64]) or more cost-effective than PHiD-CV (Peru [65]). These differences in predicted out-comes are largely due to the assumptions used. As noted in a recently published critical assessment of economic evaluations involving PHiD-CV and PCV13, “the pivotal assumptions and results of these analyses also depended on which manufacturer sponsored the study” [66].
We will focus our discussion on the key differences in assumptions of a prior Malaysian study by Wu et al. [11] (PCV13 dominance) compared with those used in the current study (PHiD-CV dominance): (1) inclusion of herd effects for PCV13 but not PHiD-CV; (2) no cross-protection for PHiD-CV against serotypes 6A and 19A; (3) higher effectiveness of PCV13 against all-cause pneu-monia; and 4) no impact of PHiD-CV on NTHi AOM. In addition, recent evidences has shown lower VE for PCV13 against serotype 3 IPD [32–35], which was not reflected in the previous study by Wu et al. [11].
In the current study, we conservatively chose not to include herd effect for PHiD-CV or PCV13 in the base 19,000 24,000 29,000 34,000 39,000 44,000 49,000 54,000
Disutility weight on AOM (outpatient) Effectiveness of PHiD-CV for AOM vaccine serotypes Meningitis incidence AOM GP visits Effectiveness of PHiD-CV for AOM NTHi
ICER (USD) Tornado Diagram
Fig. 2 Top five most influential factors identified in one‑way sensitivity analysis for the cost‑effectiveness of PHiD‑CV 2+1 versus no vaccination.
case, as this would be counteracted by serotype replace-ment, resulting in an inconclusive overall effect. In one of the scenario analyses, we included an overall ben-eficial indirect effect. The same net value was used for PHiD-CV and PCV13, as expert advice was that both herd effect and serotype replacement would likely be slightly higher for PCV13, giving a similar net effect. However, it should be noted that inclusion of indirect effects for PCV13, but not for PHiD-CV is considered as unrealistic, given that a population-based observa-tional study of PHiD-CV in Finland [13] reported a 48% (95% CI 18–69%) reduction in IPD among unvaccinated children aged 2–5 years. Additionally, surveillance data have demonstrated herd effects of PHiD-CV following the introduction of childhood vaccination programs in Finland [15] and New Zealand [16].
In the current study, cross-protection of PHiD-CV against non-vaccine serotypes 6A and 19A was accounted for, while no cross-protection was assumed for PHiD-CV against non-vaccine serotypes in the prior Malaysian study [11]. For serotype 19A, this was based on a number of robustly designed studies [12–14]. The available evidences have recently prompted the European Medicines Agency to include protection against 19A IPD in PHiD-CV’s label [67]. A similar label update was approved in Canada [68] and is underway in many coun-tries. Although the evidence for cross-protection against serotype 6A is less conclusive, the data generally indicate that cross-protection is likely [13, 14] and would be simi-lar to that seen with PCV7 [43, 69].
We assumed that PHiD-CV and PCV13 would have equal effectivenesses against all-cause pneumonia, based on a number of studies of different valent vaccines with overlapping 95% CIs [17, 37–40]. It is inappropriate to assume that vaccine effectiveness against all-cause pneu-monia would be related to the number of serotypes in the vaccine. This type of serotype-based approach has recently been criticized by Hausdorff et al. [70], because currently available pneumonia efficacy data provide no indication of a trend for greater protection with higher valence vaccines.
Lastly, cautions should be made when assuming that PHiD-CV had no effect against NTHi AOM, merely based on a few studies in which PHiD-CV was shown to have no effect on nasopharyngeal colonization [71–73] without looking into other available evidences. Several randomized controlled studies have reported a ben-eficial effect of PHiD-CV (or its 11-valent precursor) against NTHi AOM [17, 18]; and Prymula et al. [18] also reported a 41.4% (95% CI −4.9 to 67.3%) VE against nasopharyngeal carriage. Furthermore, Australian studies have reported less NTHi-infected middle-ear discharge among those with AOM with perforation or chronic sup-purative otitis media vaccinated with PHiD-CV versus PCV7 (35% vs.53% of ear discharge swabs; p = 0.03) [74] and with PHiD-CV versus PCV13 (36% vs 64% of swabs; p = 0.05) [75]. Also, a randomized controlled PCV7 trial [43] showed that the number of H. influenzae AOM cases was increased in the PCV7 group. In the absence of PCV13-specific data, we assumed that PCV13 would also increase NTHi AOM cases (vaccine efficacy −11%).
Guidelines from the International Society for Pharma-coeconomics and Outcomes Research recommend that all evidence—not selected sources—should be incorpo-rated into health economic studies [76]. By incorporating the wider body of evidence available around these criti-cal parameters and employing robust sensitivity analyses, we believe that we have addressed the associated uncer-tainties and attempted to present a more balanced result.
a
b
0 5 10 15 20 25 30 35 40 45 50
0 500 1,000 1,500
Cost
difference
(USD
millions)
QALY difference
Cost-effectiveness plane
Individual simulations Base case
-25 -20 -15 -10 -5 0 5 10 15 20 25
-1,000 -500 0 500 1,000
Cost difference
(USD millions
)
QALY difference
Cost-effectiveness plane
Individual simulations Base case
Fig. 3 PSA results for PHiD‑CV 2+1 versus a no vaccination and b
PCV13 2+1 vaccination programs. The “cost‑effective” threshold was taken to be 3 × GDP per capita. GDP gross domestic product, PCV13
As mentioned previously, outcomes of health economic studies of PHiD-CV and PCV13 can be biased, depend-ing on the sponsor [66]. Therefore, decision makers should be encouraged to rigorously evaluate the underly-ing assumptions in all cost-effectiveness analyses.
Strengths and limitations
As discussed above, the results of cost-effectiveness analyses very much depend on the input parameters used. In the absence of a head-to-head PHiD-CV ver-sus PCV13 trial, we based effectiveness estimates on
serotype distribution and data from various clinical trials. Additionally, there are also no randomized con-trolled PCV13 efficacy studies, hence we extrapolated effectiveness (based on serotype distribution and PCV7 vaccine serotype VE) or assumed values to be the same as for PHiD-CV. We note that VE data were taken from studies of 3+1 schedules, whereas the current model used a 2+1 schedule. This approach was based on the results of a PHiD-CV trial that reported similar vaccine effectivenesses of 100% (95% CI 83–100%) for a 3+1 schedule and 92% (95% CI 58–100%) for a 2+1 schedule 28,000 38,000 48,000 58,000 68,000 78,000 88,000 98,000 1,08,000 Effecveness of PHiD-CV for IPD vaccine ST6B
Effecveness of PCV13 for pneumonia (GP visit) Effecveness of PHiD-CV for pneumonia (GP visit) Effecveness of PHiD-CV cross-protecon for ST19A IPD Disulity weight of AOM (outpaent)
Cost saving (USD) per QALY gained
Tornado Diagram
Fig. 4 Top five most influential factors identified in one‑way sensitivity analysis for the cost‑effectiveness of PHiD‑CV 2+1 versus PCV13 2+1. AOM
acute otitis media, PHiD-CV pneumococcal polysaccharide and NTHi protein D conjugate vaccine, ST19A serotype 19A, IPD invasive pneumococcal disease, GP general practitioner, PCV13 13‑valent pneumococcal conjugate vaccine, ST6B serotype 6B, USD United States dollars
Table 7 Scenario analyses of PHiD-CV 2+1 versus no vaccination or PCV13 2+1 vaccination programs in Malaysia
AOM acute otitis media, ICER incremental cost-effectiveness ratio, NTHi non-typeable H. influenzae, PCV13 13-valent pneumococcal conjugate vaccine, PHiD-CV
pneumococcal polysaccharide and NTHi protein D conjugate vaccine, QALY quality-adjusted life-year, USD United States dollars
a Cost-effective (<USD 30,999)
b Highly cost-effective (<USD 10,333)
Parameter Base case Scenario
analysis PHiD-CV versus no vaccination (ICER) PHiD-CV versus PCV13 (cost saving [USD million]/QALYs gained)
Base case – – 28,497a 5.2/116
Discount rate 3% 0% 23,792a 5.7/125
Discount rate 3% 5% 31,793 4.9/110
AOM cases due to NTHi 32.3% 20.0% 30,843a 3.1/60
Adjustment factor for total AOM cases 1.0 0.7 31,371 5.2/75
Adjustment factor for total AOM cases 1.0 1.3 26,105a 5.2/157
Time horizon 10 years 100 years 10,317b 5.2/50
against vaccine-type IPD [29]. Therefore, it is likely that we slightly overestimated the effectiveness of a PHiD-CV 2+1 schedule. However, the same approach was taken for PCV13, so this would have had little effect on the between-vaccine comparison.
Although Malaysian data were used where possible, this was not always feasible, so some data from other countries (Asian when available) had to be used; but this was approved by local clinical experts. However, for some inputs, it was not possible to find any suitable sources, so administration costs, other vaccine program-related costs (e.g. capital costs, logistics costs) and vac-cine wastage were all assumed to be zero. Although this could overestimate the cost-effectiveness of PHiD-CV versus no vaccination, there would be no impact on the between-vaccine comparison. We also assumed that all children would receive the recommended number of doses, but in reality, it is likely that some children would not receive the full schedule. This would have resulted in a slightly lower efficacy but also slightly lower costs.
Lastly, the cost-effectiveness thresholds that we used were those recommended by the WHO at the time of the study [48]. These have recently been criticized [77], but in the absence of new recommendations, we have used the old thresholds.
Conclusions
In this cost-effectiveness analysis, a PHiD-CV 2+1 uni-versal vaccination program could potentially prevent a substantial number of cases of pneumococcal diseases compared with no vaccination, and was projected to be a cost-effective strategy in Malaysia. A PHiD-CV 2+1 vaccination program was also predicted to be dominant (more QALYs gained at a reduced overall cost) over a PCV13 2+1 strategy.
Abbreviations
AOM: acute otitis media; CFR: case fatality ratio; CI: confidence interval; COMPAS: Clinical Otitis Media and Pneumonia Study; FinIP: Finnish Invasive Pneumococcal disease; GDP: gross domestic product; GP: general practitioner; ICER: incremental cost‑effectiveness ratio; IPD: invasive pneumococcal disease; MYR: Malaysia Ringgits; NTHi: non‑typeable Haemophilus influenzae; PCV: pneumococcal conjugate vaccine; PCV13: 13‑valent pneumococcal conju‑ gate vaccine; PHiD‑CV: pneumococcal polysaccharide and NTHi protein D conjugate vaccine; POET: Pneumococcal Otitis Efficacy Trial; PSA: probabilistic sensitivity analysis; QALY: quality‑adjusted life‑year; USD: United States dollars; VE: vaccine efficacy; WHO: World Health Organization.
Additional files
Additional file 1. Focus on the Patient.
Additional file 2. Additional input data and one‑way sensitivity analysis results.
Authors’ contributions
All authors had full access to all of the data in the study and can take respon‑ sibility for the integrity of the data and the accuracy of the data analysis. All authors conceived and designed the study and were involved in the develop‑ ment of the model. The data were acquired and analyzed by all the authors. All authors participated in the development of this manuscript. All authors read and approved the final manuscript.
Author details
1 Department of Pharmacy, National University of Singapore, Block S4A, Level 3, 18 Science Drive 4, Singapore 117543, Singapore. 2 GSK, 150 Beach Road, #22‑00 Gateway West, Singapore 189720, Singapore. 3 GSK Pharmaceutical Sdn Bhd, Level 6, Quill 9, 112 Jalan Semangat, 46300 Petaling Jaya, Selangor, Malaysia.
Acknowledgements
The authors acknowledge David Bin‑Chia Wu (School of Pharmacy, Monash University, Malaysia) and Lijoy Varghese (GSK, Singapore) for study contribu‑ tion. They would also like to thank Business & Decision Life Sciences platform for editorial assistance and manuscript coordination, on behalf of GSK. Nathalie Arts coordinated manuscript development and editorial support. The authors also thank Jenny Lloyd (Compass Medical Communications Ltd., on behalf of GSK), who provided medical writing services.
Competing interests
AS and XHZ are employed by the GSK group of companies; and XHZ holds shares in this group of companies. XJW was an employee of the GSK group of companies at the time of the study.
Availability of data and materials
All data are either detailed in the methods or Additional file 2 or can be found in the referenced literature.
Consent for publication Not applicable.
Ethics approval and consent to participate Not applicable.
Funding
GlaxoSmithKline Biologicals S.A. funded this study/research and was involved in all stages of study conduct, including analysis of the data. GlaxoSmithKline Biologicals S.A. also took in charge all costs associated with the development and publication of this manuscript.
Trademark statement
Synflorix is a trademark owned by or licensed to the GSK group of companies. Prevenar 13 is a trademark of Wyeth LLC.
Publisher’s Note
Springer Nature remains neutral with regard to jurisdictional claims in pub‑ lished maps and institutional affiliations.
Received: 16 September 2016 Accepted: 12 August 2017
References
1. Lynch JP 3rd, Zhanel GG. Streptococcus pneumoniae: epidemiology, risk factors, and strategies for prevention. Semin Respir Crit Care Med. 2009;30:189–209.
3. World Health Organization (WHO). Immunization surveillance, assess‑ ment and monitoring. Vaccine‑preventable diseases. http://apps.who.int/ immunization_monitoring/diseases/en/. Accessed 12 Sep 2016. 4. Ministry of Health Malaysia. Health facts 2009. http://www.moh.gov.my/
images/gallery/stats/heal_fact/healthfact‑P_2009.pdf. Accessed 16 Jun 2016.
5. Klein JO. The burden of otitis media. Vaccine. 2000;19:S2–8.
6. Greenberg D, Bilenko N, Liss Z, Shagan T, Zamir O, Dagan R. The burden of acute otitis media on the patient and the family. Eur J Pediatr. 2003;162:576–81.
7. Murphy TF. Respiratory infections caused by non‑typeable Haemophilus influenzae. Curr Opin Infect Dis. 2003;16:129–34.
8. O’Neill JM, St Geme JW, Cutter D, Adderson EE, Anyanwu J, Jacobs RF, et al. Invasive disease due to nontypeable Haemophilus influenzae among children in Arkansas. J Clin Microbiol. 2003;41:3064–9.
9. World Health Organization (WHO). Organisation Mondiale de la Sante. Pneumococcal conjugate vaccine for childhood immunization—WHO position paper. Wkly Epidemiol Rec. 2007;82:93–104.
10. Aljunid S, Maimaiti M, Ahmed Z, Nur AM, Isa ZM, Azmi S, et al. Economic impact of pneumococcal protein‑D conjugate vaccine (PHiD‑CV) on the Malaysian National Immunization Programme. Value Health Reg Issues. 2014;3:146–55.
11. Wu DB, Roberts C, Lee VW, Hong LW, Tan KK, Mak V, et al. Cost‑effective‑ ness analysis of infant universal routine pneumococcal vaccination in Malaysia and Hong Kong. Hum Vaccin Immunother. 2016;12:403–16. 12. Deceuninck G, De Serres G, Boulianne N, Lefebvre B, De Wals P. Effective‑
ness of three pneumococcal conjugate vaccines to prevent invasive pneumococcal disease in Quebec, Canada. Vaccine. 2015;33:2684–9. 13. Jokinen J, Rinta‑Kokko H, Siira L, Palmu AA, Virtanen MJ, Nohynek H, et al.
Impact of ten‑valent pneumococcal conjugate vaccination on invasive pneumococcal disease in Finnish children—a population‑based study. PLoS ONE. 2015;10:e0120290.
14. Domingues CM, Verani JR, Montenegro Renoiner EI, de Cunto Brandile‑ one MC, Flannery B, de Oliveira LH, et al. Effectiveness of ten‑valent pneu‑ mococcal conjugate vaccine against invasive pneumococcal disease in Brazil: a matched case‑control study. Lancet Respir Med. 2014;2:464–71. 15. National Institute for Health and Welfare. Incidence of invasive pneu‑
mococcal disease in Finland. Updated 23 June 2016. https://www.thl.fi/ en/web/thlfi‑en/research‑and‑expertwork/projects‑and‑programmes/ monitoring‑the‑population‑effectiveness‑of‑pneumococcal‑conjugate‑ vaccination‑in‑the‑finnish‑national‑vaccination‑programme/incidence‑ of‑invasive‑pneumococcal‑disease‑in‑finland. Accessed 30 Jun 2016. 16. Institute of Environmental Science & Research. 2014 invasive pneu‑
mococcal disease reports. https://surv.esr.cri.nz/surveillance/IPD.php. Accessed 30 Jun 2016.
17. Tregnaghi MW, Saez‑Llorens X, Lopez P, Abate H, Smith E, Posleman A, et al. Efficacy of pneumococcal nontypable Haemophilus influenzae
protein D conjugate vaccine (PHiD‑CV) in young Latin American children: a double‑blind randomized controlled trial. PLoS Med. 2014;11:e1001657. 18. Prymula R, Peeters P, Chrobok V, Kriz P, Novakova E, Kaliskova E, et al.
Pneumococcal capsular polysaccharides conjugated to protein D for pre‑ vention of acute otitis media caused by both Streptococcus pneumoniae
and non‑typable Haemophilus influenzae: a randomised double‑blind efficacy study. Lancet. 2006;367:740–8.
19. Varghese L, Mungall B, Zhang XH, Hoet B, et al. Cost‑effectiveness analysis of infant pneumococcal vaccination in Malaysia and Hong Kong. Hum Vaccin Immunother. 2016. doi:10.1080/21645515.2016.1192738. 20. Knerer G, Ismaila A, Pearce D. Health and economic impact of PHiD‑
CV in Canada and the UK: a Markov modelling exercise. J Med Econ. 2012;15:61–76.
21. Feikin DR, Kagucia EW, Loo JD, Link‑Gelles R, Puhan MA, Cherian T, et al. Serotype‑specific changes in invasive pneumococcal disease after pneu‑ mococcal conjugate vaccine introduction: a pooled analysis of multiple surveillance sites. PLoS Med. 2013;10(9):e1001517.
22. Vital Statistics. Malaysia. http://www.statistics.gov.my/portal/index. php?option=com_content&view=article&id=1421&Itemid=169&lang
=en. Accessed Jul 2014.
23. Ministry of Health Malaysia (Pharmaceutical Services Division). Pharmaco‑ economic Guideline for Malaysia. http://www.pharmacy.gov.my/v2/sites/ default/files/document‑upload/pharmacoeconomic‑guideline‑malaysia. pdf. Accessed Jun 2014.
24. xe. Current and Historical Rate Tables. XE Currency Table: MYR—Malaysian Ringgit (2014‑12‑31). http://www.xe.com/currencytables/?from=MYR&d ate=2014‑12‑31. Accessed 27 Jun 2016.
25. Aljunid S, Abuduxike G, Ahmed Z, Sulong S, Nur AM, Goh A. Impact of rou‑ tine PCV7 (Prevenar) vaccination of infants on the clinical and economic burden of pneumococcal disease in Malaysia. BMC Infect Dis. 2011;11:248. 26. Chang CJ, Wang PC, Huang YC, Wu BS. Economic and clinical burden
of pneumococcal diseases and acute otitis media in Taiwan: a nation‑ wide population‑based database analysis (Abstract IN1). Value Health. 2010;13:A504.
27. Zhang XH, Nievera MC, Carlos J, Lucero M, Bibera G, Atienza MI, et al. Cost‑effectiveness analysis of pneumococcal vaccination with the pneumococcal polysaccharide NTHi protein D conjugate vaccine in the Philippines. Value Health Reg Issues. 2014;3:156–66.
28. World Health Organization (WHO), United Nations Children’s Fund (UNICEF). Malaysia: WHO and UNICEF estimates of immunization cover‑ age: 2014 revision. http://www.who.int/immunization/monitoring_sur‑ veillance/data/mys.pdf. Accessed Jun 2014.
29. Palmu AA, Jokinen J, Borys D, Nieminen H, Ruokokoski E, Siira L, et al. Effectiveness of the ten‑valent pneumococcal Haemophilus influenzae
protein D conjugate vaccine (PHiD‑CV10) against invasive pneumococcal disease: a cluster randomised trial. Lancet. 2013;381:214–22.
30. Rohani MY, Norni MZ, Azura H, Salbiah HN, Suhailah MH, Zubaidah AW, et al. Current trend of pneumococcal serotypes distribution and antibiotic susceptibility pattern in Malaysian hospitals. Vaccine. 2011;29:5688–93.
31. Whitney CG, Pilishvili T, Farley MM, Schaffner W, Craig AS, Lynfield R, et al. Effectiveness of seven‑valent pneumococcal conjugate vaccine against invasive pneumococcal disease: a matched case–control study. Lancet. 2006;368:1495–502.
32. Andrews NJ, Waight PA, Burbidge P, Pearce E, Roalfe L, Zancolli M, et al. Serotype‑specific effectiveness and correlates of protection for the 13‑valent pneumococcal conjugate vaccine: a postlicensure indirect cohort study. Lancet Infect Dis. 2014;14:839–46.
33. Moore MR, Link‑Gelles R, Schaffner W, Lynfield R, Lexau C, Bennett NM, et al. Effect of use of 13‑valent pneumococcal conjugate vaccine in children on invasive pneumococcal disease in children and adults in the USA: analysis of multisite, population‑based surveillance. Lancet Infect Dis. 2015;15:301–9.
34. Ben‑Shimol S, Greenberg D, Givon‑Lavi N, Schlesinger Y, Somekh E, Aviner S, et al. Early impact of sequential introduction of 7‑valent and 13‑valent pneumococcal conjugate vaccine on IPD in Israeli chil‑ dren < 5 years: an active prospective nationwide surveillance. Vaccine. 2014;32:3452–9.
35. Joint Committee on Vaccination and Immunisation Pneumococcal sub‑committee. Minute of meeting on Wednesday 30 May 2012, Skipton House, Department of Health, 80 London Road, London SE1 6LH. http:// media.dh.gov.uk/network/261/files/2012/07/JCVI‑minutes‑Pneumococ‑ cal‑sub‑committee‑meeting‑held‑on‑30‑May‑2012.pdf. Accessed 3 Nov 2015.
36. Vesikari T, Wysocki J, Chevallier B, Karvonen A, Czajka H, Arsene JP, et al. Immunogenicity of the 10‑valent pneumococcal non‑typeable Haemo-philus influenzae protein D conjugate vaccine (PHiD‑CV) compared to the licensed 7vCRM vaccine. Pediatr Infect Dis J. 2009;28:S66–76.
37. Hansen J, Black S, Shinefield H, Cherian T, Benson J, Fireman B, et al. Effec‑ tiveness of heptavalent pneumococcal conjugate vaccine in children younger than 5 years of age for prevention of pneumonia: updated analysis using World Health Organization standardized interpretation of chest radiographs. Pediatr Infect Dis J. 2006;25:779–81.
38. Klugman KP, Madhi SA, Huebner RE, Kohberger R, Mbelle N, Pierce N, et al. A trial of a 9‑valent pneumococcal conjugate vaccine in children with and those without HIV infection. N Engl J Med. 2003;349:1341–8. 39. Cutts FT, Zaman SM, Enwere G, Jaffar S, Levine OS, Okoko JB, et al. Efficacy
of nine‑valent pneumococcal conjugate vaccine against pneumonia and invasive pneumococcal disease in The Gambia: randomised, double‑ blind, placebo‑controlled trial. Lancet. 2005;365:1139–46.
41. Leibovitz E, Jacobs MR, Dagan R. Haemophilus influenzae: a significant pathogen in acute otitis media. Pediatr Infect Dis J. 2004;23:1142–52. 42. Hausdorff WP, Yothers G, Dagan R, Kilpi T, Pelton SI, Cohen R, et al. Multi‑
national study of pneumococcal serotypes causing acute otitis media in children. Pediatr Infect Dis J. 2002;21:1008–16.
43. Eskola J, Kilpi T, Palmu A, Jokinen J, Haapakoski J, Herva E, et al. Efficacy of a pneumococcal conjugate vaccine against acute otitis media. N Engl J Med. 2001;344:403–9.
44. Bennett JE, Sumner W 2nd, Downs SM, Jaffe DM. Parents’ utilities for out‑ comes of occult bacteremia. Arch Pediatr Adolesc Med. 2000;154:43–8. 45. Oh PI, Maerov P, Pritchard D, Knowles SR, Einarson TR, Shear NH. A cost‑ utility analysis of second‑line antibiotics in the treatment of acute otitis media in children. Clin Ther. 1996;18:160–82.
46. Health Survey for England. Chapter 5. Self‑reported health. http:// webarchive.nationalarchives.gov.uk/20140131031506. http://www. archive.official‑documents.co.uk/document/doh/survey96/tab5‑29.htm. Accessed 9 Nov 2015.
47. Department of Statistics Malaysia. Consumer Price Index Malaysia December 2014. https://www.statistics.gov.my/index.php?r=column/ cthemeByCat&cat=106&bul_id=ZUZyYU5GdlE5VlZWRlN0T2xUaTNjQT0 9&menu_id=bThzTHQxN1ZqMVF6a2I4RkZoNDFkQT09. Accessed 16 May 2016.
48. World Health Organization. Cost‑effectiveness thresholds. http://www. who.int/choice/costs/CER_thresholds/en/. Accessed 13 Oct 2015. 49. Department of Statistics Malaysia. GDP by State, 2010–2014. https://www.
statistics.gov.my/index.php?r=column/cthemeByCat&cat=102&bul_id=
OFN3NkVtT0xGWU1wQ1Y1YnRPNXRUQT09&menu_id=TE5CRUZCblh4Z TZMODZIbmk2aWRRQT09. Accessed 16 May 2016.
50. Nelson JC, Jackson M, Yu O, Whitney CG, Bounds L, Bittner R, et al. Impact of the introduction of pneumococcal conjugate vaccine on rates of community acquired pneumonia in children and adults. Vaccine. 2008;26:4947–54.
51. Komakhidze T, Hoestlandt C, Dolakidze T, Shakhnazarova M, Chlikadze R, Kopaleishvili N, et al. Cost‑effectiveness of pneumococcal conjugate vaccination in Georgia. Vaccine. 2015;33:A219–26.
52. Marti SG, Colantonio L, Bardach A, Galante J, Lopez A, Caporale J, et al. A cost‑effectiveness analysis of a 10‑valent pneumococcal conjugate vaccine in children in six Latin American countries. Cost Eff Resour Alloc. 2013;11:21.
53. Gomez JA, Tirado JC, Navarro Rojas AA, Castrejon Alba MM, Topachevskyi O. Cost‑effectiveness and cost utility analysis of three pneumococcal conjugate vaccines in children of Peru. BMC Public Health. 2013;13:1025. 54. Castaneda‑Orjuela C, Alvis‑Guzman N, Velandia‑Gonzalez M, De la Hoz‑
Restrepo F. Cost‑effectiveness of pneumococcal conjugate vaccines of 7, 10, and 13 valences in Colombian children. Vaccine. 2012;30:1936–43. 55. Sartori AM, de Soarez PC, Novaes HM. Cost‑effectiveness of introduc‑
ing the 10‑valent pneumococcal conjugate vaccine into the universal immunisation of infants in Brazil. J Epidemiol Community Health. 2012;66:210–7.
56. Ayieko P, Griffiths UK, Ndiritu M, Moisi J, Mugoya IK, Kamau T, et al. Assess‑ ment of health benefits and cost‑effectiveness of 10‑valent and 13‑valent pneumococcal conjugate vaccination in Kenyan children. PLoS ONE. 2013;8:e67324.
57. Shiragami M, Mizukami A, Leeuwenkamp O, Mrkvan T, Delgleize E, Kurono Y, et al. Cost‑effectiveness evaluation of the 10‑Valent pneumo‑ coccal non‑typeable Haemophilus influenzae protein D conjugate vaccine and 13‑valent pneumococcal vaccine in Japanese children. Infect Dis Ther. 2015;4:93–112.
58. Bakir M, Turel O, Topachevskyi O. Cost‑effectiveness of new pneumococ‑ cal conjugate vaccines in Turkey: a decision analytical model. BMC Health Serv Res. 2012;12:386.
59. By A, Sobocki P, Forsgren A, Silfverdal SA. Comparing health outcomes and costs of general vaccination with pneumococcal conjugate vaccines in Sweden: a Markov model. Clin Ther. 2012;34:177–89.
60. Morano R, Perez F, Brosa M. Perez Escolano I [Cost‑effectiveness analysis of pneumococcal vaccination in Spain]. Gac Sanit. 2011;25:267–73. 61. Robberstad B, Frostad CR, Akselsen PE, Kvaerner KJ, Berstad AK. Economic
evaluation of second generation pneumococcal conjugate vaccines in Norway. Vaccine. 2011;29:8564–74.
62. Ordonez JE, Orozco JJ. Cost‑effectiveness analysis of the available pneu‑ mococcal conjugated vaccines for children under five years in Colombia. Cost Eff Resour Alloc. 2015;13:6.
63. Klok RM, Lindkvist RM, Ekelund M, Farkouh RA, Strutton DR. Cost‑effec‑ tiveness of a 10‑ versus 13‑valent pneumococcal conjugate vaccine in Denmark and Sweden. Clin Ther. 2013;35:119–34.
64. Earnshaw SR, McDade CL, Zanotti G, Farkouh RA, Strutton D. Cost‑ effectiveness of 2+1 dosing of 13‑valent and 10‑valent pneumococcal conjugate vaccines in Canada. BMC Infect Dis. 2012;12:101.
65. Mezones‑Holguin E, Bolanos‑Diaz R, Fiestas V, Sanabria C, Gutierrez‑ Aguado A, Fiestas F, et al. Cost‑effectiveness analysis of pneumococcal conjugate vaccines in preventing pneumonia in Peruvian children. J Infect Dev Ctries. 2014;8:1552–62.
66. Wu DB, Chaiyakunapruk N, Chong HY, Beutels P. Choosing between 7‑, 10‑ and 13‑valent pneumococcal conjugate vaccines in childhood: a review of economic evaluations (2006‑2014). Vaccine. 2015;33:1633–58. 67. European Medicines Agency. Synflorix. Procedural steps taken and
scientific information after the authorisation. http://www.ema.europa. eu/docs/en_GB/document_library/EPAR_‑_Procedural_steps_taken_ and_scientific_information_after_authorisation/human/000973/ WC500054350.pdf. Accessed 28 Apr 2016.
68. GlaxoSmithKline Inc. PRODUCT MONOGRAPH SYNFLORIX®Pneumococcal conjugate vaccine (Non‑Typeable Haemophilus influenzae (NTHi) protein D, diphtheria or tetanus toxoid conjugates) adsorbed. http://ca.gsk.com/ media/591956/synflorix.pdf. Accessed 28 Apr 2016.
69. Whitney CG, Farley MM, Hadler J, Harrison LH, Bennett NM, Lynfield R, et al. Decline in invasive pneumococcal disease after the introduc‑ tion of protein‑polysaccharide conjugate vaccine. N Engl J Med. 2003;348:1737–46.
70. Hausdorff WP, Hoet B, Adegbola RA. Predicting the impact of new pneumococcal conjugate vaccines: serotype composition is not enough. Expert Rev Vaccines. 2015;14:413–28.
71. van den Bergh MR, Spijkerman J, Swinnen KM, Francois NA, Pascal TG, Borys D, et al. Effects of the 10‑valent pneumococcal nontypeable
Haemophilus influenzae protein D‑conjugate vaccine on nasopharyngeal bacterial colonization in young children: a randomized controlled trial. Clin Infect Dis. 2013;56:e30–9.
72. Prymula R, Hanovcova I, Splino M, Kriz P, Motlova J, Lebedova V, et al. Impact of the 10‑valent pneumococcal non‑typeable Haemophilus influ-enzae Protein D conjugate vaccine (PHiD‑CV) on bacterial nasopharyn‑ geal carriage. Vaccine. 2011;29:1959–67.
73. Prymula R, Habib A, Francois N, Borys D, Schuerman L. Immunological memory and nasopharyngeal carriage in 4‑year‑old children previ‑ ously primed and boosted with 10‑valent pneumococcal non‑typeable
Haemophilus influenzae protein D conjugate vaccine (PHiD‑CV) with or without concomitant prophylactic paracetamol. Vaccine. 2013;31:2080–8. 74. Leach AJ, Wigger C, Hare K, Hampton V, Beissbarth J, Andrews R, et al.
Reduced middle ear infection with non‑typeable Haemophilus influenzae, but not Streptococcus pneumoniae, after transition to 10‑valent pneu‑ mococcal non‑typeable H. influenzae protein D conjugate vaccine. BMC Pediatr. 2015;15:162.
75. Leach AJ, Wigger C, Beissbarth J, Woltring D, Andrews R, Chatfield MD, et al. General health, otitis media, nasopharyngeal carriage and middle ear microbiology in Northern Territory Aboriginal children vaccinated during consecutive periods of 10‑valent or 13‑valent pneumococcal conjugate vaccines. Int J Pediatr Otorhinolaryngol. 2016;86:224–32. 76. Briggs AH, Weinstein MC, Fenwick EA, Karnon J, Sculpher MJ, Paltiel AD,
et al. Model parameter estimation and uncertainty analysis: a report of the ISPOR‑SMDM Modeling Good Research Practices Task Force Working Group‑6. Med Decis Mak. 2012;32:722–32.

![Table 4 Costs for acute episodes of pneumococcal diseases [10]](https://thumb-us.123doks.com/thumbv2/123dok_us/586560.1554088/6.595.58.540.588.685/table-costs-for-acute-episodes-of-pneumococcal-diseases.webp)