R E S E A R C H A R T I C L E
Open Access
The serotonin transporter gene polymorphism
(5-HTTLPR) and irritable bowel syndrome: a
meta-analysis of 25 studies
Zhi-Feng Zhang
1, Zhi-Jun Duan
1*, Li-Xia Wang
1, Dong Yang
1, Gang Zhao
1and Lin Zhang
2Abstract
Background:The results of previous studies assessing the association between the 5-HTTLPR polymorphism of serotonin transporter gene and irritable bowel syndrome (IBS) are inconsistent. The aim of this study was to clarify the association between the 5-HTTLPR mutation and the presence of IBS and its subtypes with a meta-analysis of 25 studies.
Methods:A thorough search for case–control studies evaluating the association between the 5-HTTLPR polymorphism of serotonin transporter gene and the presence of IBS was carried out in four electronic databases. A meta-analysis was performed in accordance with the Cochrane Handbook for systemic reviews.
Results:A total of 25 articles with 3443 IBS cases and 3359 controls were included into our meta-analysis. No significant association was found between this polymorphism and IBS in all populations. Whereas the LL genotype was
demonstrated to be a risk factor for constipation predominant IBS (IBS-C) development in the overall population (LL vs SS: OR = 1.570, 95% CI = 1.147-2.148, P = 0.005, Bon = 0.030; LL vs LS: OR = 1.658, 95% CI = 1.180-2.331, P = 0.004, Bon = 0.024; LL vs LS/SS: OR = 1.545, 95% CI = 1.187-2.012, P = 0.001, Bon = 0.006). In the analysis of different ethnicities, L allele and LL genotype were significantly associated with increased IBS-C risk in the East Asian population (L vs S: OR = 1.487, 95% CI = 1.139-1.941, P = 0.003, Bon = 0.018; LL vs SS: OR = 2.575, 95% CI = 1.741-3.808, P = 0.000,
Bon = 0.000; LL vs LS: OR = 3.084, 95% CI = 2.017-4.715, P = 0.000, Bon = 0.000; LL vs LS/SS: OR = 2.759, 95% CI = 1.933-3.938, P = 0.000, Bon = 0.000), but not in the Caucasian population.
Conclusions:Different from the conclusions of the earlier meta-analyses, the 5-HTTLPR mutation affects IBS-C but not IBS-D and IBS-M development and this effect only exists in the East Asian population but not other populations.
Background
Irritable bowel syndrome (IBS) mainly affecting lower gastrointestinal (GI) tracts is a chronic functional GI dis-order with an obvious heterogeneity among affected pa-tients. The characteristic presentation of IBS is recurrent abdominal pain accompanied with altered bowel habits [1,2]. According to the Rome III criteria, IBS is categorized into diarrhea predominant IBS (IBS-D), constipation pre-dominant IBS (IBS-C), mixture of diarrhea and constipa-tion IBS (IBS-M) and un-subtyped IBS [3]. IBS is a common disorder encountered by gastroenterologists and its prevalence is approximately 10% [4]. IBS can impair the
quality of life and the work efficiency of affected patients. Due to the elusive etiology of IBS, there is still no curative therapy for this condition. Therapy for relieving symptoms is still the mainstay for IBS patients. Long term symptom-atic treatment results in an economic burden on not only patients and their families but also healthcare systems [5]. Despite lacking of the definite etiology, some advance-ments have been achieved in understanding the patho-physiology underlying IBS development in recent years. Gut motility dysfunction, visceral hypersensitivity and psy-chopathological factors have been implicated to play key roles in the development of IBS [1,3].
Serotonin is a neurotransmitter existing in both central nervous system (CNS) and GI tracts, and regulates GI tracts motility, visceral sensation and mucosal secretion through a paracrine signaling pathway [6]. Previous studies * Correspondence:[email protected]
1
Department of Gastroenterology, The First Affiliated Hospital of Dalian Medical University, 116000 Dalian, Liaoning province, China
Full list of author information is available at the end of the article
© 2014 Zhang et al.; licensee BioMed Central Ltd. This is an Open Access article distributed under the terms of the Creative Commons Attribution License (http://creativecommons.org/licenses/by/2.0), which permits unrestricted use, distribution, and reproduction in any medium, provided the original work is properly credited. The Creative Commons Public Domain Dedication waiver (http://creativecommons.org/publicdomain/zero/1.0/) applies to the data made available in this article, unless otherwise stated.
have shown that elevated plasma serotonin is associated with IBS-D and decreased plasma serotonin is associated with IBS-C [7]. Once serotonin is secreted from ente-rochromaffin (EC) cells, serotonin reuptake transporter (SERT) will be activated to reuptake serotonin back into EC cells and attenuate the effect of serotonin in GI tracts subsequently [8]. Balance between these two opposite pro-cesses determining the net tone of serotonin in GI tracts is critical to the maintenance of normal gut functions, espe-cially of GI tracts motility. Changes of the SERT activity would break this balance and could be involved in the de-velopment of IBS theoretically. A polymorphism of SERT gene (5-HTTLPR) with a short (S) variation of 14 repeats and a long (L) variation of 16 repeats has been proven to influence the activity of SERT [9-11]. So 5-HTTLPR is very likely to be associated with the development of IBS. Case– control studies about 5-HTTLPR were conducted to verify this hypothesis. Some studies demonstrated a positive as-sociation between this polymorphism and IBS [10,11], while another study failed to confirm this association [12]. A meta-analysis of 8 studies conducted in 2007 tried to reach a definite conclusion and showed a negative result [13]. However, the small sample size of this meta-analysis weakened its strength of evidence and this meta-analysis did not terminate the controversy about 5-HTTLPR in IBS development. Another meta-analysis published in a letter showed a positive association between this poly-morphism and IBS-C [14]. However, this meta-analysis did not include all the published articles and did not assess the association in different ethnic groups. The third one in-cluded most of the publish articles and conin-cluded that 5-HTTLPR was associated with IBS [15]. The third meta-analysis also had limitations and did not assess the associ-ation in different IBS subtypes. The associassoci-ation may be different in different IBS subtypes and different ethnic groups. Hence we performed this meta-analysis including all published studies accompanied with ethnic subgroup analyses and IBS subtype analyses to clarify whether 5-HTTLPR was associated with the development of IBS and its subtypes.
Methods
Searching strategies
Case–control studies evaluating the association between the 5-HTTLPR polymorphism and IBS were searched in PubMed, Embase and Web of Science with the combina-tions of the following searching terms: “irritable bowel syndrome”,“IBS”,“serotonin”,“5-Hydroxytryptamine”,“ 5-HT”, “polymorphism”, “polymorphisms”, “single nucleo-tide”, “allele” and “genotype”. We also searched China National Knowledge Infrastructure (CNKI) for additional relevant researches. Reference lists of each article, relevant meta-analyses and reviews were searched as well. The last searching date was July 12, 2013.
Study selection criteria
Studies included in this meta-analysis fulfilled the fol-lowing selection criteria: 1) Case–control studies with a healthy control arm. 2) Studies evaluating the associ-ation between the 5-HTTLPR polymorphism and IBS. 3) IBS diagnosis according to Rome I or II or III criteria. 4) Articles providing allele and genotype frequencies or odds ratios (OR) and 95% confidence intervals (95% CI). Exclusion criteria were as the follows: 1) Republication. 2) Family based studies. If the data of a study was pub-lished in different articles, the article with the largest sample size would be included in this meta-analysis. If the data of a study was published not only as an abstract but also as a full text article in different magazines, we selected the full text article to analyze in order to assess the quality of the research more comprehensively. Dur-ing study selection, two authors would read the highly relevant articles independently to determine eligible stud-ies. A third author would be consulted and the decision would be reached through discussions when a disagree-ment was encountered.
Data abstraction
A standard data extraction form was used to abstract data by two investigators. And the data extraction items included: first author, publication year, region where the study was conducted, ethnicity, case and control defin-ition, allele and genotype frequencies in each group and the method of polymorphism detection. When we en-countered an article neither in English nor in Chinese, would a professional translator be consulted to interpret the article.
Assessment of the risks of bias
Risks of bias were assessed with the following items: 1) Selection bias (cases and controls selections; selections based on disease subtypes), 2) Information bias (geno-typing quality control procedures, geno(geno-typing under blind conditions and phenotype misclassification rate), 3) Confounding factors (ethnic origin between cases and controls, age and gender distribution between cases and controls).
Quantitative data synthesis
Hardy-Weinberg equilibrium in the control group of each study was assessed using the chi-square test, while P< 0.05 was considered disequilibrium. Paired combinations of genotypes were used to determine the hereditary models: 1) an allelic analysis (L versus S); 2) a genotypic analysis (LL versus SS, LL versus LS, LS versus SS) and 3) another genotypic analysis evaluating dominant or reces-sive effects of allele L (LL versus LS/SS, LL/LS versus SS). OR and its 95% CI were calculated with the methods rec-ommended by the Cochrane Collaboration [14]. Statistical
Zhanget al. BMC Gastroenterology2014,14:23 Page 2 of 12
heterogeneity among studies was detected with the Q test, with a value ofP< 0.10 indicating heterogeneity existence. The I2statistics was also employed to assess the risks of heterogeneity: 0%-40% meant no risk of heterogeneity, 30%-60% meant a low risk of heterogeneity, 50%-90% meant substantial heterogeneity and 75%-100% meant considerable heterogeneity [16]. TheI2statistics less than 40% was used as the threshold to determine heterogeneity existence in this meta-analysis. If the Q test and the I2 statistics both indicated no existence of heterogeneity, a fixed model with the Mantel-Haenszel method would be employed to pool data. Otherwise, a random model with the DerSimonian-Laird method would be applied to synthesize data. Funnel plots and Egger’s test were used to examine publication bias [17,18]. The step down Bonferroni method was used for the multiple comparison adjust-ments [19]. Moreover, Student’s t test and box plots were used to determine allele L variations among different eth-nicities. Stata 11.0 software (StataCorp LP, College Station, Texas, USA) was used for meta-analysis, Hardy-Weinberg equilibrium (HWE) tests, Egger’s test, Student’s t test and box plots drawing. R 2.15.0 software (The R Foundation for Statistical Computing, http://cran.rstudio.com/) was used for step down Bonferroni adjustments (Bon). Values of P< 0.05 were considered statistically significant for meta-analyses, Bonferroni adjustments, Egger’s test and Student’s t test.
Results and discussion Results
Characteristics of selected studies
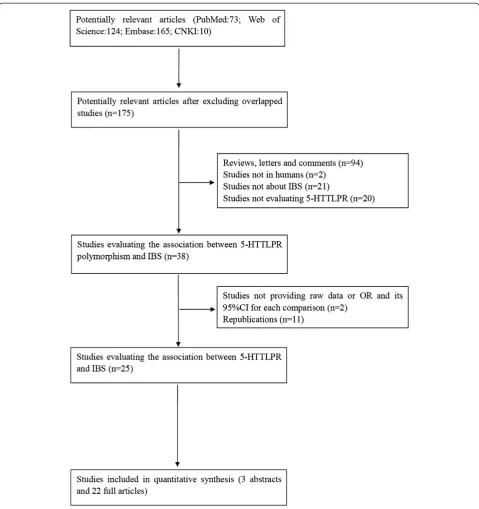
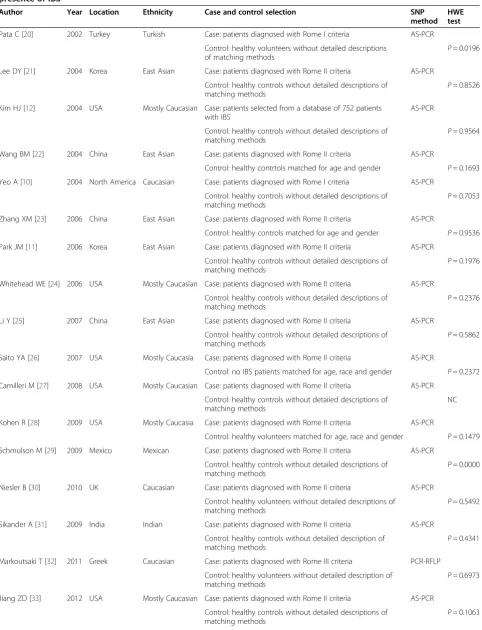
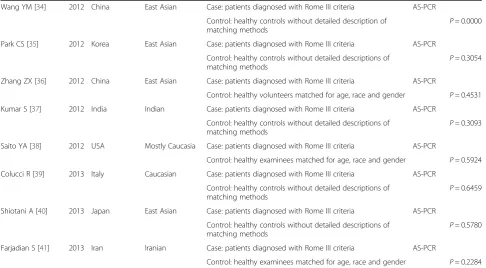
A total of 372 potentially relevant publications were identified from the four databases (PubMed: 73; Web of Science: 124; Embase: 165; CNKI: 10). After excluding studies not fulfilling our inclusion criteria including two abstracts not providing genotype frequencies, we in-cluded 25 articles (3 abstracts and 22 full text articles) with 3443 IBS cases and 3359 controls into our meta-analysis [10-12,20-41]. Among the selected studies, 11 studies were conducted in the Caucasian population, 9 studies were conducted in the East Asian population, two studies was conducted in the Indian population, one study was conducted in the Iranian population, one study was conducted in the Turkish population and one study was conducted in the Mexican population. In searching reference lists, relevant meta-analyses and re-views, no additional articles were identified. The flow chart of study selection is presented in Figure 1. And the characteristics of selected studies are illustrated in Table 1. The PRISMA Statement is illustrated in Additional file 1. The searching processes of Pubmed, Embase and Web of Science are illustrated in Additional file 2.
Assessment of the risks of bias
Selection bias IBS cases were diagnosed and selected in accordance with the Rome criteria. Because of the evolution of the Rome criteria, all of the three Rome criteria were used by studies included in our meta-analysis. Two studies used Rome I criteria to diagnose IBS [10,20], thirteen stud-ies used Rome II criteria to diagnose IBS [11,21-31,33], nine studies used Rome III criteria to diagnose IBS [32,34-41] and one study selected patients from an IBS database [14]. Only four studies provided detailed descriptions of match-ing methods [22,23,26,28]. Measures were used to exclude IBS in controls in only seven studies [12,22,26,27,31,35,38]. Most studies selected IBS patients based on IBS subtypes [10-12,20-31,34-41].
Information bias Twenty four studies used allele-specific polymerase chain reaction (AS-PCR) to determine geno-types [10-12,20-31,33-41]. One study used polymerase chain reaction-restriction fragment length polymorphism (PCR-RFLP) to detect genotypes [32]. Two researches were carried out under blind conditions [30,39]. Four studies used the DNA sequencing method to confirm genotypes [11,12,34,41]. All experiments were repeated to ensure consistency for quality control purposes in one study [25]. No phenotype misclassification was reported in the se-lected studies.
Confounding factors Age and gender distributions were comparable among arms in nine studies [11,22,23,26,28, 31,34,35,37], while the other studies did not describe the age and gender distributions among groups. All studies matched cases and controls ethnically.
Meta-analysis of the association between 5-HTTLPR polymorphism and IBS
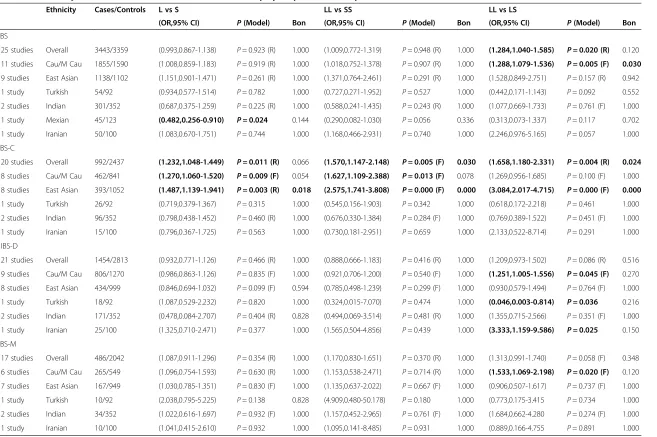
Detailed meta-analysis results, models used in each
comparison andPvalues for Bonferroni adjustment are
shown in Table 2 and Table 3. A wide variation of allele L frequency between the East Asian population and the Caucasian population was found. L allele frequency of the East Asian population controls (29.627%, 95% CI = 19.532%-39.721%) was significantly lower than that of the Caucasian population controls (52.182%, 95% CI = 45.166%-59.198%) (P= 0.0003). The box plots are illus-trated in Figure 2.
Meta-analysis about IBS
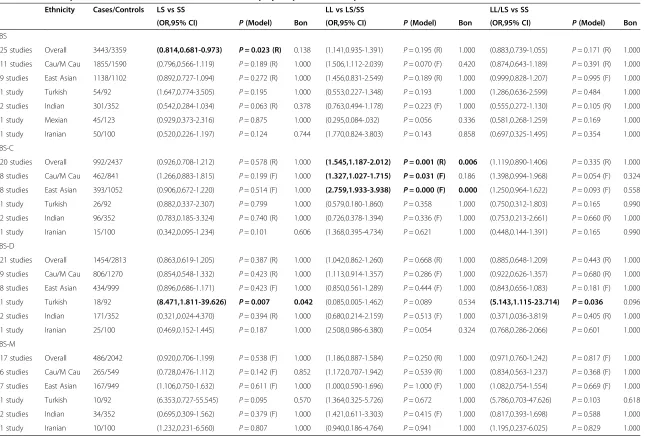
No significant association was found between this poly-morphism and IBS in the overall population. In the analysis of the Caucasian population, only the LL vs LS contrast showed a positive result (OR = 1.288, 95% CI = 1.079-1.536, P= 0.005, Bon = 0.030). There was no association between the 5-HTTLPR polymorphism and IBS in the East Asian, Iranian, Turkish, Indian and Mexican population.
Zhanget al. BMC Gastroenterology2014,14:23 Page 3 of 12
Meta-analysis about IBS-C
The LL genotype was a risk factor for IBS-C develop-ment in the overall population (LL vs SS: OR = 1.570,
95% CI = 1.147-2.148, P= 0.005, Bon = 0.030; LL vs LS:
OR = 1.658, 95% CI = 1.180-2.331,P= 0.004, Bon = 0.024; LL vs LS/SS: OR = 1.545, 95% CI = 1.187-2.012,P= 0.001, Bon = 0.006). In the subgroup analysis of the East Asian population, L allele and LL genotype were significantly associated with increased IBS-C risk in a recessive way
(L vs S: OR = 1.487, 95% CI = 1.139-1.941,P= 0.003, Bon =
0.018; LL vs SS: OR = 2.575, 95% CI = 1.741-3.808, P=
0.000, Bon = 0.000; LL vs LS: OR = 3.084, 95% CI = 2.017-4.715,P= 0.000, Bon = 0.000; LL vs LS/SS: OR = 2.759, 95% CI = 1.933-3.938,P= 0.000, Bon = 0.000). Forest plots with positive results of the East Asian population are shown in Figure 3. However, there was no significant association be-tween this polymorphism and IBS-C development in the Caucasian, Iranian, Turkish and Indian population. The Figure 1Flow diagram of the study selection process.
Zhanget al. BMC Gastroenterology2014,14:23 Page 4 of 12
Table 1 Characteristics of included studies evaluating the association between the 5-HTTLPR polymorphism and the presence of IBS
Author Year Location Ethnicity Case and control selection SNP method
HWE test
Pata C [20] 2002 Turkey Turkish Case: patients diagnosed with Rome I criteria AS-PCR
Control: healthy volunteers without detailed descriptions of matching methods
P= 0.0196
Lee DY [21] 2004 Korea East Asian Case: patients diagnosed with Rome II criteria AS-PCR
Control: healthy controls without detailed descriptions of matching methods
P= 0.8526
Kim HJ [12] 2004 USA Mostly Caucasian Case: patients selected from a database of 752 patients with IBS
AS-PCR
Control: healthy controls without detailed descriptions of matching methods
P= 0.9564
Wang BM [22] 2004 China East Asian Case: patients diagnosed with Rome II criteria AS-PCR
Control: healthy contrtols matched for age and gender P= 0.1693
Yeo A [10] 2004 North America Caucasian Case: patients diagnosed with Rome I criteria AS-PCR
Control: healthy controls without detailed descriptions of matching methods
P= 0.7053
Zhang XM [23] 2006 China East Asian Case: patients diagnosed with Rome II criteria AS-PCR
Control: healthy controls matched for age and gender P= 0.9536
Park JM [11] 2006 Korea East Asian Case: patients diagnosed with Rome II criteria AS-PCR
Control: healthy controls without detailed descriptions of matching methods
P= 0.1976
Whitehead WE [24] 2006 USA Mostly Caucasian Case: patients diagnosed with Rome II criteria AS-PCR
Control: healthy controls without detailed descriptions of matching methods
P =0.2376
Li Y [25] 2007 China East Asian Case: patients diagnosed with Rome II criteria AS-PCR
Control: healthy controls without detailed descriptions of matching methods
P= 0.5862
Saito YA [26] 2007 USA Mostly Caucasia Case: patients diagnosed with Rome II criteria AS-PCR
Control: no IBS patients matched for age, race and gender P= 0.2372
Camilleri M [27] 2008 USA Mostly Caucasian Case: patients diagnosed with Rome II criteria AS-PCR
Control: healthy controls without detailed descriptions of matching methods
NC
Kohen R [28] 2009 USA Mostly Caucasia Case: patients diagnosed with Rome II criteria AS-PCR
Control: healthy volunteers matched for age, race and gender P= 0.1479
Schmulson M [29] 2009 Mexico Mexican Case: patients diagnosed with Rome II criteria AS-PCR
Control: healthy controls without detailed descriptions of matching methods
P= 0.0000
Niesler B [30] 2010 UK Caucasian Case: patients diagnosed with Rome II criteria AS-PCR
Control: healthy volunteers without detailed descriptions of matching methods
P= 0.5492
Sikander A [31] 2009 India Indian Case: patients diagnosed with Rome II criteria AS-PCR
Control: healthy controls without detailed description of matching methods
P= 0.4341
Markoutsaki T [32] 2011 Greek Caucasian Case: patients diagnosed with Rome III criteria PCR-RFLP
Control: healthy volunteers without detailed description of matching methods
P= 0.6973
Jiang ZD [33] 2012 USA Mostly Caucasian Case: patients diagnosed with Rome II criteria AS-PCR
Control: healthy controls without detailed descriptions of matching methods
P= 0.1063
Zhanget al. BMC Gastroenterology2014,14:23 Page 5 of 12
study conducted in the Mexican population did not evalu-ate the effect of the 5-HTTLPR polymorphism on IBS-C subtype.
Meta-analysis about IBS-D and IBS-M
No significant association was found between this poly-morphism and IBS-D and IBS-M in the overall popu-lation. In subgroup analysis, there was no significant association between this polymorphism and IBS-C and IBS-M development in the Caucasian, East Asian, Indian and Iranian population. In the analysis between the 5-HTTLPR polymorphism and IBS-D in the Turkish popu-lation, only the LS vs SS contrast showed a positive result (OR = 8.471, 95% = 1.811-39.626, P= 0.007, Bon = 0.042). No association was found between this polymorphism and IBS-M development in the Turkish population. The study conducted in the Mexican population did not evaluate the effect of this polymorphism on IBS-D and IBS-M subtypes.
Sensitivity analysis
After excluding studies not fulfilling HWE or not pro-viding HWE data, the conclusions of our meta-analysis were not changed. The conclusions were not changed ei-ther when we used both a fixed and a random model to perform meta-analyses.
Evaluation of publication bias
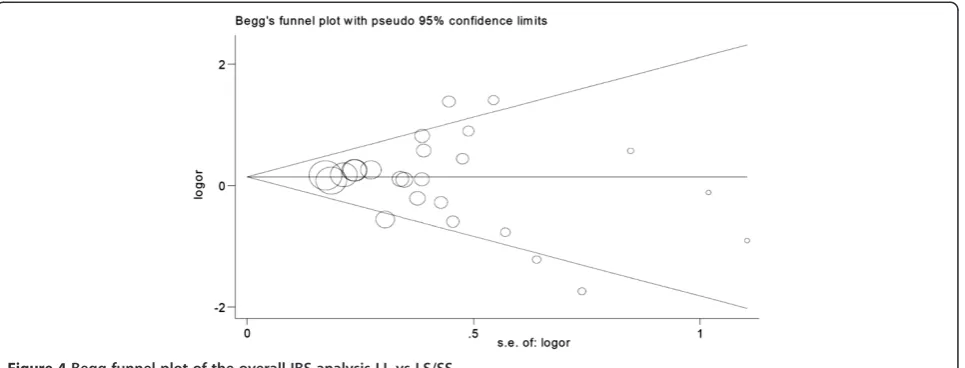
The Begg funnel plot was symmetry in the overall IBS analysis, as shown in Figure 4. Begger’s test showed no publication bias in the overall IBS analysis (P= 0.529).
Discussion
Gut motility dysfunction, visceral hypersensitivity and psy-chopathological factors have been implicated to play key roles in the development of IBS [1,3]. Recently, some scholars integrated the above factors and postulated a model called brain-gut axis (BGA), which is bi-directional and constitutes the enteric nervous system (ENS) and the gut wall, CNS and the hypothalamus-pituitary-adrenal (HPA) axis [42]. BGA dysfunction at each level is believed to be involved in the pathophysiology of IBS [43]. Psycho-pathological factors cause gut motility dysfunction, abnor-mal mucosa secretion and visceral hypersensitivity via BGA and vice versa. So BGA model may be the optimal model in understanding IBS pathophysiology and can ex-plain most of the presentations of IBS frequently accom-panied with psychological conditions.
Neural, endocrine and neuro-immune pathways are all involved in BGA. And neurotransmitters are involved in all the three pathways, so inappropriate neurotransmitter secretion could cause BGA dysfunction and plays a key role in IBS development. Serotonin existing in not only GI tracts but also CNS is one of these neurotransmitters.
Table 1 Characteristics of included studies evaluating the association between the 5-HTTLPR polymorphism and the presence of IBS(Continued)
Wang YM [34] 2012 China East Asian Case: patients diagnosed with Rome III criteria AS-PCR
Control: healthy controls without detailed description of matching methods
P= 0.0000
Park CS [35] 2012 Korea East Asian Case: patients diagnosed with Rome III criteria AS-PCR
Control: healthy controls without detailed descriptions of matching methods
P= 0.3054
Zhang ZX [36] 2012 China East Asian Case: patients diagnosed with Rome III criteria AS-PCR
Control: healthy volunteers matched for age, race and gender P= 0.4531
Kumar S [37] 2012 India Indian Case: patients diagnosed with Rome III criteria AS-PCR
Control: healthy controls without detailed descriptions of matching methods
P= 0.3093
Saito YA [38] 2012 USA Mostly Caucasia Case: patients diagnosed with Rome III criteria AS-PCR
Control: healthy examinees matched for age, race and gender P= 0.5924
Colucci R [39] 2013 Italy Caucasian Case: patients diagnosed with Rome III criteria AS-PCR
Control: healthy controls without detailed descriptions of matching methods
P= 0.6459
Shiotani A [40] 2013 Japan East Asian Case: patients diagnosed with Rome III criteria AS-PCR
Control: healthy controls without detailed descriptions of matching methods
P= 0.5780
Farjadian S [41] 2013 Iran Iranian Case: patients diagnosed with Rome III criteria AS-PCR
Control: healthy examinees matched for age, race and gender P= 0.2284
SNP: single nucleotide polymorphism; PCR-RFLP: polymerase chain reaction-restriction fragment length polymorphism; AS-PCR: allele-specific polymerase chain reaction; HWE test: Hardy-Weinberg equilibrium test; NC: not able to calculated from raw data.
Zhanget al. BMC Gastroenterology2014,14:23 Page 6 of 12
Table 2 Meta-analyses of the association between the 5-HTTLPR polymorphism and the presence of IBS
Ethnicity Cases/Controls L vs S LL vs SS LL vs LS
(OR,95% CI) P(Model) Bon (OR,95% CI) P(Model) Bon (OR,95% CI) P(Model) Bon
IBS
25 studies Overall 3443/3359 (0.993,0.867-1.138) P= 0.923 (R) 1.000 (1.009,0.772-1.319) P= 0.948 (R) 1.000 (1.284,1.040-1.585) P= 0.020 (R) 0.120 11 studies Cau/M Cau 1855/1590 (1.008,0.859-1.183) P= 0.919 (R) 1.000 (1.018,0.752-1.378) P= 0.907 (R) 1.000 (1.288,1.079-1.536) P= 0.005 (F) 0.030
9 studies East Asian 1138/1102 (1.151,0.901-1.471) P= 0.261 (R) 1.000 (1.371,0.764-2.461) P= 0.291 (R) 1.000 (1.528,0.849-2.751) P= 0.157 (R) 0.942
1 study Turkish 54/92 (0.934,0.577-1.514) P= 0.782 1.000 (0.727,0.271-1.952) P= 0.527 1.000 (0.442,0.171-1.143) P= 0.092 0.552
2 studies Indian 301/352 (0.687,0.375-1.259) P= 0.225 (R) 1.000 (0.588,0.241-1.435) P= 0.243 (R) 1.000 (1.077,0.669-1.733) P= 0.761 (F) 1.000
1 study Mexian 45/123 (0.482,0.256-0.910) P= 0.024 0.144 (0.290,0.082-1.030) P= 0.056 0.336 (0.313,0.073-1.337) P= 0.117 0.702 1 study Iranian 50/100 (1.083,0.670-1.751) P= 0.744 1.000 (1.168,0.466-2.931) P= 0.740 1.000 (2.246,0.976-5.165) P= 0.057 1.000
IBS-C
20 studies Overall 992/2437 (1.232,1.048-1.449) P= 0.011 (R) 0.066 (1.570,1.147-2.148) P= 0.005 (F) 0.030 (1.658,1.180-2.331) P= 0.004 (R) 0.024
8 studies Cau/M Cau 462/841 (1.270,1.060-1.520) P= 0.009 (F) 0.054 (1.627,1.109-2.388) P= 0.013 (F) 0.078 (1.269,0.956-1.685) P= 0.100 (F) 1.000 8 studies East Asian 393/1052 (1.487,1.139-1.941) P= 0.003 (R) 0.018 (2.575,1.741-3.808) P= 0.000 (F) 0.000 (3.084,2.017-4.715) P= 0.000 (F) 0.000
1 study Turkish 26/92 (0.719,0.379-1.367) P= 0.315 1.000 (0.545,0.156-1.903) P= 0.342 1.000 (0.618,0.172-2.218) P= 0.461 1.000
2 studies Indian 96/352 (0.798,0.438-1.452) P= 0.460 (R) 1.000 (0.676,0.330-1.384) P= 0.284 (F) 1.000 (0.769,0.389-1.522) P= 0.451 (F) 1.000
1 study Iranian 15/100 (0.796,0.367-1.725) P= 0.563 1.000 (0.730,0.181-2.951) P= 0.659 1.000 (2.133,0.522-8.714) P= 0.291 1.000
IBS-D
21 studies Overall 1454/2813 (0.932,0.771-1.126) P= 0.466 (R) 1.000 (0.888,0.666-1.183) P= 0.416 (R) 1.000 (1.209,0.973-1.502) P= 0.086 (R) 0.516
9 studies Cau/M Cau 806/1270 (0.986,0.863-1.126) P= 0.835 (F) 1.000 (0.921,0.706-1.200) P= 0.540 (F) 1.000 (1.251,1.005-1.556) P= 0.045 (F) 0.270 8 studies East Asian 434/999 (0.846,0.694-1.032) P= 0.099 (F) 0.594 (0.785,0.498-1.239) P= 0.299 (F) 1.000 (0.930,0.579-1.494) P= 0.764 (F) 1.000
1 study Turkish 18/92 (1.087,0.529-2.232) P= 0.820 1.000 (0.324,0.015-7.070) P= 0.474 1.000 (0.046,0.003-0.814) P= 0.036 0.216 2 studies Indian 171/352 (0.478,0.084-2.707) P= 0.404 (R) 0.828 (0.494,0.069-3.514) P= 0.481 (R) 1.000 (1.355,0.715-2.566) P= 0.351 (F) 1.000
1 study Iranian 25/100 (1.325,0.710-2.471) P= 0.377 1.000 (1.565,0.504-4.856) P= 0.439 1.000 (3.333,1.159-9.586) P= 0.025 0.150 IBS-M
17 studies Overall 486/2042 (1.087,0.911-1.296) P= 0.354 (R) 1.000 (1.170,0.830-1.651) P= 0.370 (R) 1.000 (1.313,0.991-1.740) P= 0.058 (F) 0.348
6 studies Cau/M Cau 265/549 (1.096,0.754-1.593) P= 0.630 (R) 1.000 (1.153,0.538-2.471) P= 0.714 (R) 1.000 (1.533,1.069-2.198) P= 0.020 (F) 0.120 7 studies East Asian 167/949 (1.030,0.785-1.351) P= 0.830 (F) 1.000 (1.135,0.637-2.022) P= 0.667 (F) 1.000 (0.906,0.507-1.617) P= 0.737 (F) 1.000
1 study Turkish 10/92 (2.038,0.795-5.225) P= 0.138 0.828 (4.909,0.480-50.178) P= 0.180 1.000 (0.773,0.175-3.415 P= 0.734 1.000
2 studies Indian 34/352 (1.022,0.616-1.697) P= 0.932 (F) 1.000 (1.157,0.452-2.965) P= 0.761 (F) 1.000 (1.684,0.662-4.280 P= 0.274 (F) 1.000
1 study Iranian 10/100 (1.041,0.415-2.610) P= 0.932 1.000 (1.095,0.141-8.485) P= 0.931 1.000 (0.889,0.166-4.755 P= 0.891 1.000
Cau/M Cau: Caucasian/Mostly Caucasian; F: fixed model; R: random model; Bon:Pfor Bonferroni adjustment. The significant contrasts were written in bold.
Zhang
et
al.
BMC
Gastroen
terology
2014,
14
:23
Page
7
o
f
1
2
http://ww
w.biomedce
ntral.com/1
471-230X/14
Table 3 Meta-analyses of the association between the 5-HTTLPR polymorphism and the presence of IBS
Ethnicity Cases/Controls LS vs SS LL vs LS/SS LL/LS vs SS
(OR,95% CI) P(Model) Bon (OR,95% CI) P(Model) Bon (OR,95% CI) P(Model) Bon
IBS
25 studies Overall 3443/3359 (0.814,0.681-0.973) P= 0.023 (R) 0.138 (1.141,0.935-1.391) P= 0.195 (R) 1.000 (0.883,0.739-1.055) P= 0.171 (R) 1.000 11 studies Cau/M Cau 1855/1590 (0.796,0.566-1.119) P= 0.189 (R) 1.000 (1.506,1.112-2.039) P= 0.070 (F) 0.420 (0.874,0.643-1.189) P= 0.391 (R) 1.000
9 studies East Asian 1138/1102 (0.892,0.727-1.094) P= 0.272 (R) 1.000 (1.456,0.831-2.549) P= 0.189 (R) 1.000 (0.999,0.828-1.207) P= 0.995 (F) 1.000
1 study Turkish 54/92 (1.647,0.774-3.505) P= 0.195 1.000 (0.553,0.227-1.348) P= 0.193 1.000 (1.286,0.636-2.599) P= 0.484 1.000
2 studies Indian 301/352 (0.542,0.284-1.034) P= 0.063 (R) 0.378 (0.763,0.494-1.178) P= 0.223 (F) 1.000 (0.555,0.272-1.130) P= 0.105 (R) 1.000
1 study Mexian 45/123 (0.929,0.373-2.316) P= 0.875 1.000 (0.295,0.084-.032) P= 0.056 0.336 (0.581,0.268-1.259) P= 0.169 1.000
1 study Iranian 50/100 (0.520,0.226-1.197) P= 0.124 0.744 (1.770,0.824-3.803) P= 0.143 0.858 (0.697,0.325-1.495) P= 0.354 1.000
IBS-C
20 studies Overall 992/2437 (0.926,0.708-1.212) P= 0.578 (R) 1.000 (1.545,1.187-2.012) P= 0.001 (R) 0.006 (1.119,0.890-1.406) P= 0.335 (R) 1.000 8 studies Cau/M Cau 462/841 (1.266,0.883-1.815) P= 0.199 (F) 1.000 (1.327,1.027-1.715) P= 0.031 (F) 0.186 (1.398,0.994-1.968) P= 0.054 (F) 0.324 8 studies East Asian 393/1052 (0.906,0.672-1.220) P= 0.514 (F) 1.000 (2.759,1.933-3.938) P= 0.000 (F) 0.000 (1.250,0.964-1.622) P= 0.093 (F) 0.558 1 study Turkish 26/92 (0.882,0.337-2.307) P= 0.799 1.000 (0.579,0.180-1.860) P= 0.358 1.000 (0.750,0.312-1.803) P= 0.165 0.990
2 studies Indian 96/352 (0.783,0.185-3.324) P= 0.740 (R) 1.000 (0.726,0.378-1.394) P= 0.336 (F) 1.000 (0.753,0.213-2.661) P= 0.660 (R) 1.000
1 study Iranian 15/100 (0.342,0.095-1.234) P= 0.101 0.606 (1.368,0.395-4.734) P= 0.621 1.000 (0.448,0.144-1.391) P= 0.165 0.990
IBS-D
21 studies Overall 1454/2813 (0.863,0.619-1.205) P= 0.387 (R) 1.000 (1.042,0.862-1.260) P= 0.668 (R) 1.000 (0.885,0.648-1.209) P= 0.443 (R) 1.000
9 studies Cau/M Cau 806/1270 (0.854,0.548-1.332) P= 0.423 (R) 1.000 (1.113,0.914-1.357) P= 0.286 (F) 1.000 (0.922,0.626-1.357) P= 0.680 (R) 1.000
8 studies East Asian 434/999 (0.896,0.686-1.171) P= 0.423 (F) 1.000 (0.850,0.561-1.289) P= 0.444 (F) 1.000 (0.843,0.656-1.083) P= 0.181 (F) 1.000
1 study Turkish 18/92 (8.471,1.811-39.626) P= 0.007 0.042 (0.085,0.005-1.462) P =0.089 0.534 (5.143,1.115-23.714) P= 0.036 0.096 2 studies Indian 171/352 (0.321,0.024-4.370) P= 0.394 (R) 1.000 (0.680,0.214-2.159) P =0.513 (F) 1.000 (0.371,0.036-3.819) P= 0.405 (R) 1.000
1 study Iranian 25/100 (0.469,0.152-1.445) P= 0.187 1.000 (2.508,0.986-6.380) P =0.054 0.324 (0.768,0.286-2.066) P= 0.601 1.000
IBS-M
17 studies Overall 486/2042 (0.920,0.706-1.199) P= 0.538 (F) 1.000 (1.186,0.887-1.584) P= 0.250 (R) 1.000 (0.971,0.760-1.242) P= 0.817 (F) 1.000
6 studies Cau/M Cau 265/549 (0.728,0.476-1.112) P= 0.142 (F) 0.852 (1.172,0.707-1.942) P= 0.539 (R) 1.000 (0.834,0.563-1.237) P= 0.368 (F) 1.000
7 studies East Asian 167/949 (1.106,0.750-1.632) P= 0.611 (F) 1.000 (1.000,0.590-1.696) P= 1.000 (F) 1.000 (1.082,0.754-1.554) P= 0.669 (F) 1.000
1 study Turkish 10/92 (6.353,0.727-55.545) P= 0.095 0.570 (1.364,0.325-5.726) P= 0.672 1.000 (5.786,0.703-47.626) P= 0.103 0.618
2 studies Indian 34/352 (0.695,0.309-1.562) P= 0.379 (F) 1.000 (1.421,0.611-3.303) P= 0.415 (F) 1.000 (0.817,0.393-1.698) P= 0.588 1.000
1 study Iranian 10/100 (1.232,0.231-6.560) P= 0.807 1.000 (0.940,0.186-4.764) P= 0.941 1.000 (1.195,0.237-6.025) P= 0.829 1.000
Cau/M Cau: Caucasian/Mostly Caucasian; F: fixed model; R: random model; Bon: P for Bonferroni adjustment. The significant contrasts were written in bold.
Zhang
et
al.
BMC
Gastroen
terology
2014,
14
:23
Page
8
o
f
1
2
http://ww
w.biomedce
ntral.com/1
471-230X/14
Changes of the serotonin levels in GI tracts can affect visceral sensitivity and gut motility [7,44]. Previous stud-ies have also showed that elevated plasma serotonin is associated with IBS-D and decreased plasma serotonin is associated with IBS-C [7]. Once serotonin is secreted from EC cells, SERT will be activated to reuptake tonin back into EC cells and attenuate the effect of sero-tonin in GI tracts subsequently [8]. The L variation of 5-HTTLPR is found to increase the expression of SERT gene and enhance SERT activity consequently [9-11,34]. The enhanced SERT activity would take up serotonin and weaken its effects in promoting gut secretion and motility. So compared with S allele and SS genotype car-riers, L allele and LL genotype carriers are likely to be more susceptible to IBS-C. The results of our meta-analysis support this hypothesis. However, the effect of 5-HTTLPR on IBS-C is population dependent and the positive association is only present in the East Asian population but not in the Caucasian population. We also found that L allele frequency of the East Asian popula-tion controls was significantly lower than that of the Figure 2Frequency of the L allele between the East Asian
population and the Caucasian population.
Figure 3Meta-analyses with positive results of the association between the 5-HTTLPR polymorphism and the presence of IBS-C in the East Asian population.
Zhanget al. BMC Gastroenterology2014,14:23 Page 9 of 12
Caucasian population controls. So the different allelic frequency between the two populations may account for this phenomenon. Furthermore, there is a higher preva-lence of psychological and psychiatric disorders among IBS patients [45]. The state of CNS can also affect the de-velopment of IBS. However, the effect of the 5-HTTLPR variant on CNS is different from that on GI tracts in IBS development. A meta-analysis demonstrated that the S variant was associated with heightened amygdala activa-tion which would predispose S carriers to stress-related psychiatric disorders [46]. Another meta-analysis also showed a positive association between the S allele and an increased risk of developing depression under stress [47]. The S allele may increase the risk of IBS-C development through the CNS pathway. So the opposite effect of 5-HTTLPR variant on GI tracts and CNS during IBS-C de-velopment may also account for some variations among studies assessing the association between the 5-HTTLPR variant and IBS-C. Future studies should exclude the psy-chological confounding factors or stratify analyses based on psychological conditions. IBS may be further catego-rized into subtypes based on psychological conditions be-sides of the Rome criteria. Additionally, an adenine to guanine polymorphism in the L allele has been recently identified and only the adenine L allele but not the guan-ine L allele is found to increase the activity of SERT [48]. This internal L allele polymorphism may attenuate the ef-fect of the L allele on IBS-C development. Only one small sample size study included in our meta-analysis evaluated the effect of internal L allele polymorphism on IBS devel-opment and showed a negative result. Future studies should further assess the effect of the 5-HTTLPR poly-morphism on IBS-C according to the internal L allele polymorphism. Moreover, a study indicates that the S al-lele is associated with higher pain sensory ratings during rectal distension studies in healthy controls and IBS
patients, and the increased sensation ratings in carriers of the S allele are not caused by lower rectal compliance [27]. Different genotype and allele may have different effects on gut motility and intestinal sensation respectively. This phenomenon also indicates the complexity of IBS and the necessity to classifying IBS based on pathophysiology.
Clarifying genotypes of the 5-HTTLPR polymorphism also has clinical implications. One study found that IBS-C patients with the LL genotype responded poorly to treat-ment with the 5-HT4 receptor agonist, tegaserod [25]. An-other study investigating rectal smooth muscle contractions found that IBS patients with the SS genotype showed more increase in phasic contractions compared with patients with the LL genotype after administration of the 5-HT4 re-ceptor agonist, mosapride [49]. Determining the genotype of the 5-HTTLPR polymorphism may be of value to the prognosis and the prediction of treatment response in a IBS-C patient.
The conclusions of this meta-analysis are a little dif-ferent from the previous meta-analyses. As we know, this meta-analysis is the latest one and has the largest sample size. So the result of our meta-analysis is more likely convincing. However, the conclusions of this meta-analysis should be interpreted cautiously due to some limitations. Firstly, selection bias could not be cluded as only seven studies employed measures to ex-clude IBS in the controls. Secondly, only four studies used the DNA sequencing method to confirm geno-types, and two studies used blindness measures. Infor-mation bias is inevitable. Thirdly, most of the included studies did not describe the age and gender distribution between cases and controls. Confounding factors could not be excluded. Moreover, heterogeneity existed in some contrasts which might also affect the validity of this meta-analysis. Although the Egger’s test showed no publication bias existing, the data of two abstracts were Figure 4Begg funnel plot of the overall IBS analysis LL vs LS/SS.
Zhanget al. BMC Gastroenterology2014,14:23 Page 10 of 12
not included in this meta-analysis for failing to provide genotype frequencies. Thus a reporting bias existed. Moreover, we employed the Bonferroni adjustments method to avoid false positive results, the risk of false negative results occurrence would be increased. So when interpreting the negative results of our meta-analysis, we should be cautious.
Conclusions
In summary, in despite of the above limitations, this meta-analysis shows a positive association between the L allele and LL genotype of 5-HTTLPR mutation and IBS-C in the East Asian population but not in the Caucasian popu-lation. These results offer some insights into gene func-tions affecting IBS susceptibility and some clues in IBS management, especially in the East Asian population.
Additional files
Additional file 1:The PRISMA Statement.
Additional file 2:The searching process of Pubmed, Embase and Web of Science.
Competing interests
The authors declare that they have no competing interests.
Authors’contributions
Conceived and designed the experiments: ZFZ and ZJD. Performed the experiments: ZFZ, LXW, DY, GZ, LZ. Searched, selected, analyzed the data: ZFZ, LXW, DY, GZ, LZ. Wrote the paper: ZFZ, LXW, DY. All authors read and approved the final manuscript.
Acknowledgment
We should acknowledge librarian Jiao He of the first affiliated hospital of Dalian Medical University for the retrieving of published articles.
Author details
1Department of Gastroenterology, The First Affiliated Hospital of Dalian Medical University, 116000 Dalian, Liaoning province, China.2Department of Respiratory Diseases, The First Affiliated Hospital of Dalian Medical University, 116000 Dalian, Liaoning province, China.
Received: 24 October 2013 Accepted: 30 January 2014 Published: 10 February 2014
References
1. Drossman DA, Camilleri M, Mayer EA,et al:AGA technical review on irritable bowel syndrome.Gastroenterology2002,123:2108–2131. 2. Guilera M, Balboa A, Mearin F:Bowel habit subtypes and temporal
patterns in irritable bowel syndrome: systematic review.
Am J Gastroenterol2005,100:1174–1184.
3. Longstreth GF, Thompson WG, Chey WD,et al:Functional bowel disorders.
Gastroenterology2006,130:1480–1491.
4. Wilson S, Roberts L, Roalfe A,et al:Prevalence of irritable bowel syndrome: a community survey.Br J Gen Pract2004,54:495–502. 5. Robin S:Clinical update: Irritable bowel syndrome.Lancet2007,369:1586–1588. 6. Kim DY, Camilleri M:Serotonin: a mediator of the brain-gut connection.
Am J Gastroenterol2000,95:2698–2709.
7. Atkinson W, Lockhart S, Whorwell PJ,et al:Altered 5-hydroxytryptamine signaling in patients with constipation- and diarrhea-predominant irritable bowel syndrome.Gastroenterology2006,130:34–43. 8. Bertrand PP, Bertrand RL:Serotonin release and uptake in the
gastrointestinal tract.Auton Neurosci2010,153:47–57.
9. Heils A, Teufel A, Petri S,et al:Allelic variation of human serotonin transporter gene expression.J Neurochem1996,66:2621–2624. 10. Yeo A, Boyd P, Lumsden S,et al:Association between a functional
polymorphism in the serotonin transporter gene and diarrhoea predominant irritable bowel syndrome in women.Gut2004,53:1452–1458. 11. Park JM, Choi MG, Park JA,et al:Serotonin transporter gene polymorphism
and irritable bowel syndrome.Neurogastroenterol Motil2006,18:995–1000. 12. Kim HJ, Camilleri M, Carlson PJ,et al:Association of distinct alpha(2)
adrenoceptor and serotonin transporter polymorphisms with constipation and somatic symptoms in functional gastrointestinal disorders.Gut2004,53:829–37.
13. Van Kerkhoven LA, Laheij RJ, Jansen JB:Meta-analysis: a functional polymorphism in the gene encoding for activity of the serotonin transporter protein is not associated with the irritable bowel syndrome.
Aliment Pharmacol Ther2007,26:979–986.
14. Dai C, Zheng CQ, Jiang M:Letter: serotonin transporter gene
polymorphisms and the irritable bowel syndrome.Aliment Pharmacol Ther 2013,37(6):657–658.
15. Areeshi MY, Haque S, Panda AK, Mandal RK:A serotonin transporter gene (SLC6A4) polymorphism is associated with reduced risk of irritable bowel syndrome in American and Asian population: a meta-analysis.
PLoS One2013,8(9):e75567.
16. Higgins JPT, Green S (Eds):Cochrane Handbook for Systematic Reviews of Interventions Version 5.1.0 [updated March 2011].The Cochrane Collaboration. Accessed 2011 June 30 http://www.cochrane.org/training/ cochrane-handbook.
17. Egger M, Smith GD, Schneider M,et al:Bias in meta-analysis detected by a simple, graphical test.Br Med J1997,315:629–634.
18. Sterne JA, Egger M:Funnel plots for detecting bias in meta-analysis: guidelines on choice of axis.J Clin Epidemiol2001,54:1046–1055. 19. Holm S:A simple sequentially rejective bonferroni test procedure.
Scand J Stat1979,6:65–70.
20. Pata C, Erdal ME, Derici E,et al:Serotonin transporter gene polymorphism in irritable bowel syndrome.Am J Gastroenterol2002,97(7):1780–1784. 21. Lee DY, Park H, Kim WH,et al:Serotonin transporter gene polymorphism
in healthy adults and patients with irritable bowel syndrome.
Korean J Gastroenterol2004,43(1):18–22.
22. Wang BM, Wang YM, Zhang WM,et al:Serotonin transporter gene polymorphism in irritable bowel syndrome.Zhonghua Nei Ke Za Zhi2004, 43(6):439–441.
23. Zhang XM, Lin ZH:Relationship between serotonin transporter gene polymorphism and irritable bowel syndrome.Shijie Huaren Xiaohua Zazhi 2006,14(18):1790–1794.
24. Whitehead WE, Palsson OS, Thiwan SI,et al:Short-allele serotonin transporter gene polymorphism is associated with elevated serotonin and is less common in IBS with constipation compared to healthy controls.Gastroenterology2006,130(4):A513.
25. Li Y, Nie Y, Xie J,et al:The association of serotonin transporter genetic polymorphisms and irritable bowel syndrome and its influence on tegaserod treatment in Chinese patients.Dig Dis Sci2007,52(11):2942–2949. 26. Saito YA, Locke GR 3rd, Zimmerman JM,et al:A genetic association study
of 5-HTT LPR and GNbeta3 C825T polymorphisms with irritable bowel syndrome.Neurogastroenterol Motil2007,19(6):465–470.
27. Camilleri M, Busciglio I, Carlson P,et al:Candidate genes and sensory functions in health and irritable bowel syndrome.Am J Physiol Gastrointest Liver Physiol2008,295(2):G219–225.
28. Kohen R, Jarrett ME, Cain KC,et al:The serotonin transporter polymorphism rs25531 is associated with irritable bowel syndrome.
Dig Dis Sci2009,54(12):2663–2770.
29. Schmulson M, Farfan-Labone B, Charua-Guindic L,et al:The presence of the short allele in the promoter region of the SERT-P is associated with IBS among females in a Latin population.Neurogastroenterol Motil2009,21:S90. 30. Niesler B, Kapeller J, Fell C,et al:5-HTTLPR and STin2 polymorphisms in
the serotonin transporter gene and irritable bowel syndrome: effect of bowel habit and sex.Eur J Gastroenterol Hepatol2010,22(7):856–861. 31. Sikander A, Rana SV, Sinha SK,et al:Serotonin transporter promoter
variant: Analysis in Indian IBS patients and control population.
J Clin Gastroenterol2009,43(10):957–961.
32. Markoutsaki T, Karantanos T, Gazouli M,et al:5-HT2A receptor gene polymorphisms and irritable bowel syndrome.J Clin Gastroenterol2011, 45(6):514–517.
Zhanget al. BMC Gastroenterology2014,14:23 Page 11 of 12
33. Jiang ZD, Dupont AW, DuPont HL,et al:Genetic polymorphisms in serotonin transporter and G-protein genes in patients with irritable bowel syndrome.Gastroenterology2012,142(5):S562.
34. Wang YM, Chang Y, Chang YY,et al:Serotonin transporter gene promoter region polymorphisms and serotonin transporter expression in the colonic mucosa of irritable bowel syndrome patients.Neurogastroenterol Motil2012,24(6):560–565.
35. Park CS, Uhm JH:Polymorphisms of the serotonin transporter gene and G-proteinβ3 subunit gene in korean children with irritable bowel syndrome and functional dyspepsia.Gut Liver2012,6(2):223–228. 36. Zhang ZX, Xie J, Huang CB,et al:Serotonin transporter polymorphism in
constipation predominant irritable bowel syndrome and its influence on clinical effect of tegaserod.Shandong Yiyao2012,52(25):16–18. 37. Kumar S, Ranjan P, Mittal B,et al:Serotonin transporter gene (SLC6A4)
polymorphism in patients with irritable bowel syndrome and healthy controls.J Gastrointestin Liver Dis2012,21(1):31–38.
38. Saito YA, Larson JJ, Atkinson EJ,et al:The role of 5-HTT LPR and GNβ3 825C > T polymorphisms and gene-environment interactions in irritable bowel syndrome (IBS).Dig Dis Sci2012,57(10):2650–2657.
39. Colucci R, Gambaccini D, Ghisu N,et al:Influence of the serotonin transporter 5HTTLPR polymorphism on symptom severity in irritable bowel syndrome.PLoS ONE2013,8(2):e54831.
40. Shiotani A, Kusunoki H, Kimura Y,et al:S100A Expression and interleukin-10 polymorphisms Are associated with ulcerative colitis and diarrhea predominant irritable bowel syndrome.Dig Dis Sci2013,18. doi:10.1007/s10620-013-2677-y. [Epub ahead of print]
41. Farjadian S, Fakhraei B, Moeini M,et al:Serotonin transporter gene polymorphisms in Southwestern Iranian patients with irritable bowel syndrome.Arab J Gastroenterol2013,14(2):59–62.
42. Collins SM, Bercik P:The relationship between intestinal microbiota and the central nervous system in normal gastrointestinal function and disease.Gastroenterology2009,136(6):2003–2014.
43. Clarke G, Quigley EM, Cryan JF,et al:Irritable bowel syndrome: towards biomarker identification.Trends Mol Med2009,15(10):478–489. 44. Zemlan FP, Murphy AZ, Behbehani MM:5-HT1A receptors mediate the
effect of the bulbospinal serotonin system on spinal dorsal horn nociceptive neurones.Pharmacology1994,48:1–10.
45. Arebi N, Gurmany S, Bullas D,et al:Review article: the
psychoneuroimmunology of irritable bowel syndrome-an exploration of interactions between psychological, neurological and immunological observations.Aliment Pharmacol Ther2008,28(7):830–840.
46. Munafò MR, Brown SM, Hariri AR:Serotonin transporter (5-HTTLPR) genotype and amygdala activation: a meta-analysis.Biol Psychiatry2008,63:852–857. 47. Karg K, Burmeister M, Shedden K,et al:The serotonin transporter promoter variant (5-HTTLPR), stress, and depression meta-analysis revisited: evidence of genetic moderation.Arch Gen Psychiatry2011,68:444–454.
48. Lipsky RH, Hu XZ, Goldman D:Additional functional variation at the SLC6 A4 gene.Am J Med Genet B Neuropsychiatr Genet2009,150:153. 49. Kanazawa M, Watanabe S, Tana C, Komuro H, Aoki M, Fukudo S:Effect of
5-HT4 receptor agonist mosapride citrate on rectosigmoid sensorimotor function in patients with irritable bowel syndrome.Neurogastroenterol Motil2011,23(8):754–e332.
doi:10.1186/1471-230X-14-23
Cite this article as:Zhanget al.:The serotonin transporter gene polymorphism (5-HTTLPR) and irritable bowel syndrome: a meta-analysis of 25 studies.BMC Gastroenterology201414:23.
Submit your next manuscript to BioMed Central and take full advantage of:
• Convenient online submission
• Thorough peer review
• No space constraints or color figure charges
• Immediate publication on acceptance
• Inclusion in PubMed, CAS, Scopus and Google Scholar
• Research which is freely available for redistribution
Submit your manuscript at www.biomedcentral.com/submit
Zhanget al. BMC Gastroenterology2014,14:23 Page 12 of 12