R E S E A R C H
Open Access
Short-term nutritional counseling reduces body
mass index, waist circumference, triceps skinfold
and triglycerides in women with metabolic
syndrome
Gustavo D Pimentel
1, Silvia T Arimura
2, Bruno M de Moura
2, Maria ER Silva
3, Maysa V de Sousa
3*Abstract
Background:It is recognized that the growing epidemic of metabolic syndrome is related to dietary and lifestyle changes.
Objective:The purpose of this study was to evaluate short-term application of nutritional counseling in women with metabolic syndrome.
Methods:This follow-up study was conducted from September to November 2008 with thirty three women≥35 years old screened clinically for nutritional counseling. Dietary intake was reported, and biochemical and body composition measures were taken at baseline and after three months of follow-up.
Results:Of the 33 women evaluated, 29 patients completed the study. The prevalence of type 2 diabetes mellitus, hypertension, dyslipidemia, and obesity was high at 38%, 72.4%, 55.2%, and 75.8%, respectively. At the end of three-months of follow-up, a significant decline in body mass index, waist circumference, triceps skinfold, and triglycerides was observed, as was an increase in calcium and vitamin D intake. The multiple regression analysis showed that changes in body mass index, triceps skinfold, waist circumference and triglyceride levels after nutritional intervention were positively associated with changes in anthropometric (loss of body weight) and biochemical (decrease of TG/HDL-c ratio) parameters. Moreover, waist circumference changes were negatively associated with changes in calcium and vitamin D intake.
Conclusion:Short-term nutritional counseling improved some factors of metabolic syndrome. Moreover, the increases in calcium and vitamin D consumption can be associated with the improvement in markers of metabolic syndrome.
Introduction
Metabolic syndrome was defined in 2001 by the National Cholesterol Education Program Adult Treat-ment Panel III (ATP III) as the presence of ≥3 of the following risk factors: abdominal obesity (high waist cir-cumference), hyperglycemia, hypertriacylglycerolemia, low HDL-c, and hypertension [1].
The high prevalence of metabolic syndrome in devel-oping countries have been demonstrated in countries such as: Morocco, Oman, Turkey, Iran with 33.5%,
16.3%, 33.4%, and 33.7%, respectively. In South America the prevalence is 31.2% in Venezuela and 25.4% in Brazil [2].
It is recognized that the growing epidemic of chronic diseases is related to dietary and lifestyle changes in the post-industrial era. Several studies have demonstrated the association between nutrition and obesity, coronary heart disease, diabetes, osteoporosis, and certain cancers (for review see WHO [3]). In this case, the prevention of metabolic syndrome represents an important oppor-tunity to ameliorate the health of these patients. Thus the Dietary Guidelines for Americans [4], the Brazilian Guidelines on Diagnosis and Treatment of Metabolic * Correspondence: maysavs@uol.com.br
3Laboratory of Medical Investigation (LIM 18), Endocrinology, School of
Medicine (USP), São Paulo/SP, Brazil
Syndrome [5], and long-term lifestyle intervention [6-8] and short-term [9] emphasizes low consumption of hypercaloric food, recommends increased amounts of whole grain, fruit and vegetables, and a limited intake of
transand saturated fatty acids.
The purpose of this study was to evaluate the effects of short-term application of nutritional counseling in Brazilian women with metabolic syndrome.
Methods
Subjects and Methods
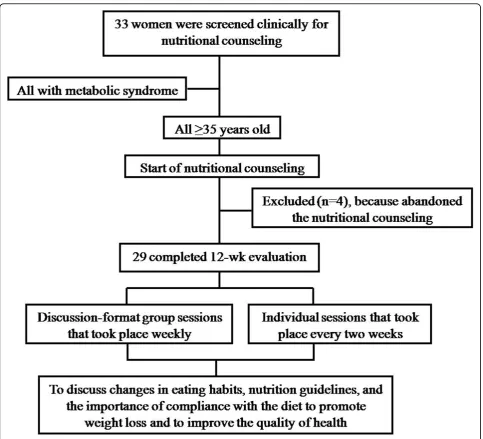
This follow-up study was conducted from September to November 2008 in patients screened clinically for nutri-tional counseling. The sample consisted of women attended by the Family Health Program of Mogi das Cruzes, located in the Metropolitan Area of São Paulo, Brazil. The only criterion for inclusion was women with metabolic syndrome (defined by the ATP III), but women with liver, kidney or heart diseases were excluded, as were women with chronic consumption of alcohol. As a whole, 33 women from 35 to 77 years old were evaluated (Figure 1). All the participants signed the prior informed consent designed according to the n° 196/96 on “Research involving human beings, from the Health Board of the Ministry of Health” approved by the Ethics Committee of Mogi das Cruzes University, under number 131/2008.
Anthropometry and body composition assessments Body weight was obtained to the nearest 0.01 kg with an electronic scale (Filizola®, São Paulo, SP, Brazil) and height was measured to the nearest 0.5 cm without shoes while standing on a level, hard surface using a calibrated stadiometer (Sanny®, Brazil) followed by body mass index (BMI) calculation [10] and according to the norms standard by Heyward & Stolarczyk [11].
The waist circumference was measured 2 cm over the umbilical scar [12] and arm circumference was mea-sured to evaluate the reduction of the muscle or fat mass from reduction of body weight. This was followed by evaluations of triceps and biceps skinfold thickness, measured at the midpoint of the upper arm and was expressed in mm by means of a Lange skinfold caliper in triplicate [13].
Nutritional counseling
Participants received individual and group counseling with a team of nutritionists. The dietary intervention consisted of discussion-format group sessions that took place weekly and individual sessions that took place every two weeks to discuss changes in eating habits, nutrition guidelines, and the importance of compliance with the diet to promote weight loss and to improve the quality of health (Figure 1). In other words, the topics
discussed were about the importance of healthy eating (increasing intake of fruits, vegetables, fish and water and reducing consumption of sugar, fat, sodium, and fried foods) to diminish the components of metabolic syndrome.
The intervention included written and oral instruc-tions in the form of lecture, with the aid of a sequence of posters. Patients were also encouraged to increase physical activity, mainly by walking, swimming or aero-bic ball games.
Dietary measurements
Initial and follow-up visits included anthropometrical data, biochemical parameters, as well as assessment of current diet.
The 24 h recall questionnaire was performed before and after nutritional counseling and was evaluated for the presence or absence of changes in eating habits. The food frequency questionnaire (FFQ) only was available at the baseline point. Nutritional analysis was carried out with the software NutWin® (Federal University of São Paulo, Brazil). Table of Food Composition-Brazil [14] and TACO version 2-Brazil [15] tables were used to determine the macro and micronutrients content of foods.
Sociodemographic characteristics
The women answered questionnaires (baseline moment) with regard to sociodemographic factors. Subjects also were asked about home conditions, basic sanitation, health-related habits (smoking status, alcohol intake, dieting in the past, and whether they are physically active or not). Type 2 diabetes mellitus, hypertension, dyslipidemia and obesity were defined by Brazilian Guidelines on Diagnosis and Treatment of Metabolic Syndrome [5].
Biochemical measurements
Blood samples were obtained after a 12-hour fast and analyzed in the Hospital Laboratory of the city of Mogi das Cruzes, São Paulo, Brazil. Labtest® kits were used to assess fasting blood glucose, total cholesterol, HDL-c and triglycerides. The samples were analyzed using an enzymatic method. LDL-c was calculated according to the Friedwald equation (LDL-c = total cholesterol-(HDL-c)-(TG/5) [16] and LDL-c subclass by the equa-tion (TG/HDL-c ratio) [17] which is a good predictive factor for oxidized-LDL-c.
Statistical analysis
was used to check for any possible differences between findings at the baseline and after nutritional counseling.
Linear relationships were estimated using Pearson cor-relation (crude model) to examine the associations between changes in variables, expressed as percentage of change ((endpoint - baseline value)/baseline value × 100). Moreover, a multiple regression analysis was per-formed to identify the contribution of changes in body composition, food intake and biochemical measurements to changes in metabolic parameters independent of other factors. Thus, three models of adjustment were performed, first adjusted by age (model 1), adjusted by BMI (model 2) and adjusted by total calories intake (model 3).
The level of statistical significance used was 5% in all tests. For all analyses we used software STATISTICA version 6.0.
Results
Of the 33 women evaluated, 29 patients completed the study. Four participants abandoned the nutritional coun-seling (Figure 1).
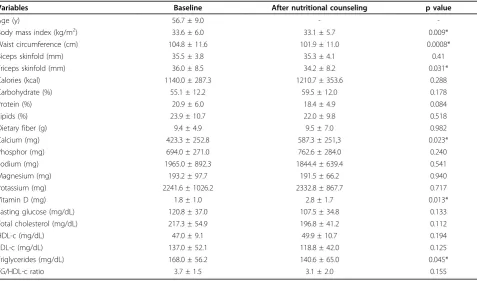
The dietetic, anthropometric, and biochemical charac-teristics at baseline and after three months of nutritional counseling are shown in Table 1. At the end of three months of follow-up, a significant decline in BMI, waist circumference, triceps skinfold, and triglycerides was observed, as well as an increase in calcium and vitamin
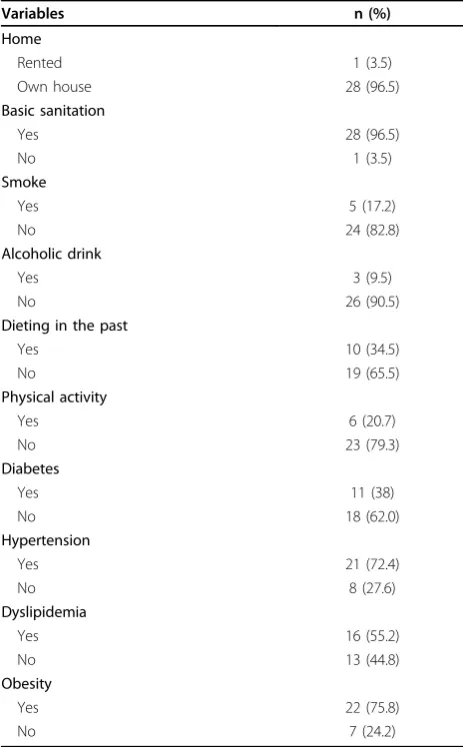
D intake. The total calorie and macronutrient intake didn’t alter after nutricional counseling (Table 1). Socio-demographic characteristics of the participants (Table 2) demonstrated that most were living in owned houses (96.5%), had basic sanitation (96.5%), didn’t smoke or drink alcohol (82.8% and 90.5%), didn’t try to lose weight by dieting in the past (65.5%), and were seden-tary (79.3%). The prevalence of type 2 diabetes mellitus, hypertension, dyslipidemia, and obesity was high, at 38%, 72.4%, 55.2%, and 75.8%, respectively.
At the baseline, FFQ showed that all (100%) subjects consumed rice, breads or roots daily, fruits (55% daily, 41.5% weekly, and 3.5% monthly) and vegetables (72.5% daily, 13.8% weekly, 3.5% monthly, and 10.2% never), meat and eggs (79.3% daily and 20.7% weekly), beans (93.0% daily and 7.0% weekly), oil and fats (62.0% daily, 24.0% weekly, 3.5% monthly, and 10.5% never) and sugar and sweets (48.2% daily, 24.0% weekly, 10.3% monthly, and 17.5% never). Furthermore, Pearson’s cor-relation demonstrated that biceps skinfold was asso-ciated positively with meat serving (r = 0.56), triceps skinfold with meat serving (r = 0.59) and vegetable oil serving (r = 0.53).
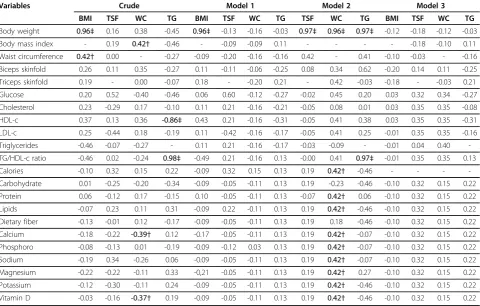
In the studied individuals, BMI, triceps skinfold, waist circumference and triglycerides changes were positively associated with body weight, BMI, waist circumference,
and TG/HDL-c ratio (all Pearson correlation coefficients >0.42; all p values≤0.05 or≤0.0001). Besides, waist cir-cumference were negatively associated with calcium (r = -0.37, p ≤0.05) and vitamin D (r = -0.39, p≤ 0.05) intake, suggesting that both increases were linked to the reduction of abdominal fat. The triglycerides changes was also inversely (r = -0.86, p≤0.0001) associated with changes in HDL-c concentrations (Table 3).
The multiple regression analysis adjusted by age (model 1) showed a positive correlation between BMI and body weight (r = 0.96, p ≤0.0001). When adjusted by BMI (model 2), we observed a positive correlation between triceps skinfold, waist circumference and trigly-cerides with body weight, TG/HDL-c ratio, total cal-ories, proteins, lipids, calcium, phosphorus, magnesium, potassium and vitamin D intake (all correlations r > 0.42, for all values of p≤0.05 or≤0.0001).
In order to verify whether the caloric intake may interfere with the changes to the anthropometric and triglycerides levels, a multiple regression analysis was performed adjusted by energy intake (model 3). It could be observed that the decrease in triglycerides and anthropometric indicators were influenced by the total caloric intake, because after adjustment by calorie intake (model 3) significant losses were observed in all correla-tion performed (Table 3).
Table 1 Anthropometric, dietetic, and biochemical variables at baseline and after nutritional counseling.
Variables Baseline After nutritional counseling p value
Age (y) 56.7 ± 9.0 -
-Body mass index (kg/m2) 33.6 ± 6.0 33.1 ± 5.7 0.009*
Waist circumference (cm) 104.8 ± 11.6 101.9 ± 11.0 0.0008*
Biceps skinfold (mm) 35.5 ± 3.8 35.3 ± 4.1 0.41
Triceps skinfold (mm) 36.0 ± 8.5 34.2 ± 8.2 0.031*
Calories (kcal) 1140.0 ± 287.3 1210.7 ± 353.6 0.288
Carbohydrate (%) 55.1 ± 12.2 59.5 ± 12.0 0.178
Protein (%) 20.9 ± 6.0 18.4 ± 4.9 0.084
Lipids (%) 23.9 ± 10.7 22.0 ± 9.8 0.518
Dietary fiber (g) 9.4 ± 4.9 9.5 ± 7.0 0.982
Calcium (mg) 423.3 ± 252.8 587.3 ± 251,3 0.023*
Phosphor (mg) 694.0 ± 271.0 762.6 ± 284.0 0.240
Sodium (mg) 1965.0 ± 892.3 1844.4 ± 639.4 0.541
Magnesium (mg) 193.2 ± 97.7 191.5 ± 66.2 0.940
Potassium (mg) 2241.6 ± 1026.2 2332.8 ± 867.7 0.717
Vitamin D (mg) 1.8 ± 1.0 2.8 ± 1.7 0.013*
Fasting glucose (mg/dL) 120.8 ± 37.0 107.5 ± 34.8 0.133
Total cholesterol (mg/dL) 217.3 ± 54.9 196.8 ± 41.2 0.112
HDL-c (mg/dL) 47.0 ± 9.1 49.9 ± 10.7 0.194
LDL-c (mg/dL) 137.0 ± 52.1 118.8 ± 42.0 0.125
Triglycerides (mg/dL) 168.0 ± 56.2 140.6 ± 65.0 0.045*
TG/HDL-c ratio 3.7 ± 1.5 3.1 ± 2.0 0.155
Discussion
In this study, we tested the hypothesis that a nutritional counseling approach aimed at reducing BMI, waist cir-cumference, triceps skinfold and triglycerides and increasing calcium and vitamin D intake is effective over a short-term (three months) at reducing markers of metabolic syndrome. Regarding the Pearson correlation and multiple regression, we showed that the reduction in BMI, waist circumference, triceps skinfold, and trigly-cerides can be associated with the decrease in body weight and TG/HDL-c ratio, as well as with the increases in calcium and vitamin D intake.
Several studies have revealed the importance of nutri-tional education aiming at preventing metabolic syn-drome [6,7,9]. The present study confirmed this by observing a significant decline in BMI, triceps skinfold and triglycerides and increases in calcium and vitamin D intake. This increase in calcium and vitamin D may have occurred by substitution of milk, cheese and butter
for low fat dairy products observed during nutritional counseling (data not published) which is rich in calcium and vitamin D.
Calcium is one major nutritional component in dairy products. Dietary calcium may lower the activity of renin-angiotensin system, improve sodium-potassium balance, and inhibit vascular smooth muscle cell con-striction [18]. Moreover, high calcium intake facilitates weight loss and enhances insulin sensitivity, which also contribute to blood pressure reduction [19].
Recently, numerous interventional and epidemiological [20-25] studies have shown that the calcium and vitamin D consumption are associated with and effectively reduce abdominal fat and metabolic syndrome risk.
Similar to previous studies [26-28] we found that abdominal fat is considered one of the strongest indica-tors of metabolic syndrome and is associated with TG/ HDL-c ratio.
In the present study, we evaluated the predictive fac-tor for oxidized-LDL-c by using the equation (TG/HDL-c ratio) [17], but didn’t observe a reduction after nutri-tional counseling. Obviously, the TG/HDL-c ratio was associated with triglycerides concentrations, suggesting that reductions in triglycerides also diminished TG/ HDL-c ratio. In this context, several studies have demonstrated that oxidized-LDL-c activates circulating monocytes, increasing their ability to infiltrate the vas-cular wall and this increased infiltration is a primary stage for atherogenesis [29,30] and worsening of meta-bolic syndrome. The oxidized-LDL-c increases triglycer-ides production by inducing the accumulation of fatty acids in adipocytes [31]. Moreover, hypertriglyceridemia is associated with higher levels of small dense LDL-c, which is particularly prone to oxidation and has been proven to be more atherogenic than larger LDL-c parti-cles [32,33]. Fortunately, in the present study we mana-ged to lower the triglyceride levels at the end of study.
As mentioned previously, the women in this study had little change in their BMI but showed a decrease in waist circumference. In fact, the nutritional counseling may have modest effects on decreasing BMI and more effect on abdominal fat loss. It has already been estab-lished that the waist circumference is positively asso-ciated with all the obesity-related abnormalities, such as hypertension, dyslipidemia, diabetes, metabolic syn-drome, cardiovascular diseases, stroke and myocardial infaction [34,35].
Waist circumference and skinfold measurements can be used to assess body composition and are cheaper than imaging technique such as dual-energy X-ray absorptiometry, air-displacement plethysmography or hydrostatic weighing that may provide a more accurate method for assessing body composition [36,37] and the metabolic syndrome risk.
Table 2 Sociodemographic characteristics of the participants.
Variables n (%)
Home
Rented 1 (3.5)
Own house 28 (96.5)
Basic sanitation
Yes 28 (96.5)
No 1 (3.5)
Smoke
Yes 5 (17.2)
No 24 (82.8)
Alcoholic drink
Yes 3 (9.5)
No 26 (90.5)
Dieting in the past
Yes 10 (34.5)
No 19 (65.5)
Physical activity
Yes 6 (20.7)
No 23 (79.3)
Diabetes
Yes 11 (38)
No 18 (62.0)
Hypertension
Yes 21 (72.4)
No 8 (27.6)
Dyslipidemia
Yes 16 (55.2)
No 13 (44.8)
Obesity
Yes 22 (75.8)
Our study has some limitations. First of all, the Brazi-lian population has a high degree of miscegenation that includes a mix of indigenous people, Afro- and Euro-Brazilians, and a widespread Latin ancestry. Thus, we do not know if this genetic and environmental diversity can modify the relationship between nutritional counseling and diminishing metabolic syndrome factors. Second, the low number of participants included in study. Third, the short-term of the nutritional counseling, lasting only three months. Fourth, the lack of a control group.
The lifestyle modifications that combine energy restriction and healthy eating (increased intake of fruits, vegetables, fish and water and reduced consumption of sugar, fat, sodium, and fried foods) would appear to be a preferred treatment strategy for metabolic syndrome. However, these results are limited to overweight and obese women with metabolic syndrome attended by the Family Health Program in a little city of the State of São Paulo, Brazil. Moreover, the subjects were verbally informed to do physical activity. However, it is not
known if everyone started physical activity and whether this could be influencing the results.
Therefore, further research is required to assess the benefits of nutritional counseling in both women and men with metabolic syndrome. Additional studies are also required to evaluate the individual effects of differ-ent nutridiffer-ents and their long-term effects.
In summary, this study shows that the reduction of metabolic syndrome factors can be effectively achieved by short-term nutritional counseling. The lifestyle inter-ventions proposed reduces BMI, waist circumference, triceps skinfold, and triglycerides concentrations. More-over the reduction in BMI, waist circumference, triceps skinfold and triglycerides was partially associated with the decrease in body weight and TG/HDL-c ratio, as well as with the increases in calcium and vitamin D intake, independent of age and body composition. How-ever, further studies are warranted to confirm the poten-tial benefit of nutritional counseling in mitigating metabolic syndrome.
Table 3 Partial correlation of changes (Δpercentage) in body mass index, triceps skinfold, waist circumference measurements and triglycerides concentrations after three months related to changes in metabolic parameters adjusted for age, body composition and calories intake.
Variables Crude Model 1 Model 2 Model 3
BMI TSF WC TG BMI TSF WC TG TSF WC TG BMI TSF WC TG
Body weight 0.96‡ 0.16 0.38 -0.45 0.96‡ -0.13 -0.16 -0.03 0.97‡ 0.96‡ 0.97‡ -0.12 -0.18 -0.12 -0.03 Body mass index - 0.19 0.42† -0.46 - -0.09 -0.09 0.11 - - - - -0.18 -0.10 0.11 Waist circumference 0.42† 0.00 - -0.27 -0.09 -0.20 -0.16 -0.16 0.42 - 0.41 -0.10 -0.03 - -0.16 Biceps skinfold 0.26 0.11 0.35 -0.27 0.11 -0.11 -0.06 -0.25 0.08 0.34 0.62 -0.20 0.14 0.11 -0.25
Triceps skinfold 0.19 - 0.00 -0.07 0.18 - -0.20 0.21 - 0.42 -0.03 -0.18 - -0.03 0.21
Glucose 0.20 0.52 -0.40 -0.46 0.06 0.60 -0.12 -0.27 -0.02 0.45 0.20 0.03 0.32 0.34 -0.27
Cholesterol 0.23 -0.29 0.17 -0.10 0.11 0.21 -0.16 -0.21 -0.05 0.08 0.01 0.03 0.35 0.35 -0.08
HDL-c 0.37 0.13 0.36 -0.86‡ 0.43 0.21 -0.16 -0.31 -0.05 0.41 0.38 0.03 0.35 0.35 -0.31 LDL-c 0.25 -0.44 0.18 -0.19 0.11 -0.42 -0.16 -0.17 -0.05 0.41 0.25 -0.01 0.35 0.35 -0.16
Triglycerides -0.46 -0.07 -0.27 - 0.11 0.21 -0.16 -0.17 -0.03 -0.09 - -0.01 0.04 0.40
-TG/HDL-c ratio -0.46 0.02 -0.24 0.98‡ -0.49 0.21 -0.16 0.13 -0.00 0.41 0.97‡ -0.01 0.35 0.35 0.13 Calories -0.10 0.32 0.15 0.22 -0.09 0.32 0.15 0.13 0.19 0.42† -0.46 - - - -Carbohydrate 0.01 -0.25 -0.20 -0.34 -0.09 -0.05 -0.11 0.13 0.19 -0.23 -0.46 -0.10 0.32 0.15 0.22
Protein 0.06 -0.12 0.17 -0.15 0.10 -0.05 -0.11 0.13 -0.07 0.42† 0.06 -0.10 0.32 0.15 0.22 Lipids -0.07 0.23 0.11 0.31 -0.09 0.22 -0.11 0.13 0.19 0.42† -0.46 -0.10 0.32 0.15 0.22 Dietary fiber -0.13 -0.01 0.12 -0.17 -0.09 -0.05 -0.11 0.13 0.19 0.18 -0.46 -0.10 0.32 0.15 0.22
Calcium -0.18 -0.22 -0.39† 0.12 -0.17 -0.05 -0.11 0.13 0.19 0.42† -0.07 -0.10 0.32 0.15 0.22 Phosphoro -0.08 -0.13 0.01 -0.19 -0.09 -0.12 0.03 0.13 0.19 0.42† -0.07 -0.10 0.32 0.15 0.22 Sodium -0.19 0.34 -0.26 0.06 -0.09 -0.05 -0.11 0.13 0.19 0.42† -0.07 -0.10 0.32 0.15 0.22 Magnesium -0.22 -0.22 -0.11 0.33 -0,21 -0.05 -0.11 0.13 0.19 0.42† 0.27 -0.10 0.32 0.15 0.22 Potassium -0.12 -0.30 -0.11 0.24 -0.09 -0.05 -0.11 0.13 0.19 0.42† -0.46 -0.10 0.32 0.15 0.22 Vitamin D -0.03 -0.16 -0.37† 0.19 -0.09 -0.05 -0.11 0.13 0.19 0.42† -0.46 -0.10 0.32 0.15 0.22
Multiple regression analysis was performed to identify the contribution of changes in body composition, food intake and biochemical measurements to changes in metabolic parameters independent of other factors. The value were expressed as percentage of change ((endpoint - baseline value)/baseline value × 100). Crude model: withouth adjustment, Model 1: adjusted by age, Model 2: adjusted by BMI and Model 3: adjusted by calories intake. BMI: body mass index, TSF: triceps skinfold, WC: waist circumference, TG: triglycerides.
Acknowledgements
Maysa VS thanks the School of Medicine Foundation, Sao Paulo University for their assistance provided. Pimentel GD thanks the National Council for Scientific and Technological (CNPq, Brazil) for the scholarship granted.
Author details
1Department of Physiology, Federal University of São Paulo (UNIFESP), São
Paulo/SP, Brazil.2Nutrition Course, Mogi das Cruzes University (UMC), Mogi das Cruzes/SP, Brazil.3Laboratory of Medical Investigation (LIM 18),
Endocrinology, School of Medicine (USP), São Paulo/SP, Brazil.
Authors’contributions
GDP performed the statistical analysis and written of article. STA and BMM has collected the data and carried out the nutritional counseling. MERS and MVS conceived of the study, participated in its design and coordination. All authors read and approved the final manuscript.
Competing interests
The authors declare that they have no competing interests.
Received: 18 November 2009
Accepted: 10 February 2010 Published: 10 February 2010
References
1. Executive Summary of the Third Report of the National Cholesterol Education Program (NCEP):Expert panel on detection, evaluation, and treatment of high blood cholesterol in adults (Adult Treatment Panel III).
JAMA2001,285(19):2486-2497.
2. Misra A, Khurana L:Obesity and the metabolic syndrome in developing countries.J Clin Endocrinol Metabol2008,93(11 Suppl 1):9-30. 3. World Health Organization (WHO):Diet, nutrition and the prevention of
chronic diseases.Expert Consultation on diet, nutrition and prevention of chronic diseasesGeneva: WHO/FAO 2003.
4. USDA:Dietary guidelines for Americans.Washington, DC: US Department of Agriculture and Department of Health and Human Services, 6 2005. 5. I Brazilian guidelines on diagnosis and treatment of metabolic
syndrome. Arq Bras Cardiol2005,84(Suppl 1):1-28.
6. Bruner B, Chad K, Chizen D:Effects of exercise and nutritional counseling in women with polycystic ovary syndrome.Appl Physiol Nutr Metab2006,
31(4):384-391.
7. Brown T, Avenell A, Edmunds LD, Moore H, Whittaker V, Avery L, Summerbell C:Systematic review of long-term lifestyle interventions to prevent weight gain and morbidity in adults.Obes Rev2009,10(6):627-638. 8. Fujii H, Haruyama Y, Muto T, Kobayashi E, Ishisaki K, Yamasaki A:High
attendance at a lifestyle intervention program is important to reduce risks related to metabolic syndrome in middle-aged Japanese.Tohoku J Exp Med2009,219(2):155-164.
9. Wu RR, Zhao JP, Jin H, Shao P, Fang MS, Guo XF, He YQ, Liu YJ, Chen JD, Li LH:Lifestyle intervention and metformin for treatment of antipsychotic-induced weight gain.JAMA2008,299(2):185-193. 10. World Health Organization (WHO):Obesity: preventing and managing the
global epidemic.Report of the WHO Consultation on ObesityGeneva: World Health Organization 1998.
11. Heyward VH, Storlarczyk LM:Avaliação da composição corporal aplicada.
São Paulo: Manole 2000.
12. Callaway CW, Chumlea WC, Bouchard C, Himes JH, Lohman TG, Martin AD, et al:Circunferences, Anthropometric standardizations reference manual Champaign. IL: Human KineticsLohman TG, Roche AF, Martorell R 1988. 13. Frisancho RA:Anthropometric standards for the assesment of growth
and nutritional status.Universith of Michigan Press 1990.
14. Philippi ST:Tabela de composição de alimentos: Suporte para decisão nutricional.Segunda Edição2002.
15. TACO:Tabela brasileira de composição de alimentos.UNICAMP, Núcleo de Estudos e Pesquisas em Alimentação. versão 2. Segunda Edição. São Paulo 2006.
16. Friedewald T, Levy RI, Frederickson DS:Estimation of the concentration of low-density lipoprotein cholesterol in plasma, without use of the preparative ultracentrifuge.Clin Chem1972,18(6):499-502.
17. Tsimihodimos V, Gazi I, Kostara C, Tselepis AD, Elisaf M:Plasma lipoproteins and triacylglycerol are predictors of small, dense LDL particles.Lipids 2007,42(5):403-409.
18. Resnick LM:The role of dietary calcium in hypertension: a hierarchical overview.Am J Hypertens1999,12(1 Pt 1):99-112.
19. Wang L, Manson JE, Buring JE, L I-M, Sesso HD:Dietary intake of dairy products, calcium, and vitamin D and the risk of hypertension in middle-aged and older women.Hypertension2008,51(4):1073-1079. 20. Zemel MB, Richards J, Milstead A, Campbell P:Effects of calcium and dairy
on body composition and weight loss in African-American adults.Obes Res2005,13(7):1218-1225.
21. Pereira MA, Jacobs DR Jr, Van Horn L, Slattery ML, Kartashov AI, Ludwig DS:
Dairy consumption, obesity, and the insulin resistance syndrome in Young adults: the CARDIA Study.JAMA2002,287(16):2081-2089. 22. Cheng S, Massaro JM, Fox CS, Larson MG, Keyes MJ, McCabe EL, Robins SJ,
O’Donnell CJ, Hoffmann U, Jacques PF, Booth SL, Vasan RS, Wolf M, Wang TJ:Adiposity, cardiometabolic risk, and vitamin D status: the Framingham Heart Study.Diabetes2010,59(1):242-248.
23. Foss YJ:Vitamin D deficiency is the cause of common obesity.Med Hypotheses2009,72(3):314-321.
24. Major GC, Alarie FP, Doré J, Tremblay A:Calcium plus vitamin D supplementation and fat mass loss in female very low-calcium consumers: potential link with a calcium-specific appetite control.Br J Nutr2009,101(5):659-663.
25. Zittermann A, Frisch S, Berthold HK, Götting C, Kuhn J, Kleesiek K, Stehle P, Koertke H, Koerfer R:Vitamin D supplementation enhances the beneficial effects of weight loss on cardiovascular disease risk markers.Am J Clin Nutr2009,89(5):1321-1327.
26. Esposito K, Pontillo A, Palo CD, Giugliano G, Masella M, Marfella R, Giugliano D:Effect of weight loss and lifestyle changes on vascular inflammatory markers in obese women.JAMA2003,289(14):1799-1804. 27. Lemos-Santos MGF, Valente JG, Gonçalves-Silva RMV, Sichieri R:Waist
circumference and waist-to-hip ratio as predictors of serum concentration of lipids in Brazilian men.Nutrition2004,20(10):857-862. 28. Ferreira MG, Valente JG, Gonçalves-Silva RMV, Sichieri :Acurácia da
circunferência da cintura e da relação cintura/quadril como preditores de dislipidemias em estudo transversal de doadores de sangue de Cuiabá, Mato Grosso, Brasil.Cad Saúde Públ2006,22(2):307-314. 29. Cipolletta C, Ryan KE, Hanna EV, Trimble ER:Activation of peripheral blood
CD14+ monocytes occurs in diabetes.Diabetes2005,54(9):2779-2786. 30. Stengel D, Antonucci M, Gaoua W, Dachet C, Lesnik P, Hourton D, Ninio E,
Chapman MJ, Griglio S:Inhibition of LPL expression in human monocyte-derived macrophages is dependent on LDL oxidation state: a key role for lysophosphatidylcholine.Arterioscler Thromb Vasc Biol1998,
18(7):1172-80.
31. Knopp RH, Paramsothy P:Oxidized LDL and abdominal obesity: a key to understanding the metabolic syndrome.Am J Clin Nutr2006,83(1):1-2. 32. Krauss RM, Burke DJ:Identification of multiple subclasses of plasma low
density lipoproteins in normal humans.J Lipid Res1982,23(1):97-104. 33. Ridker PM, Buring JE, Cook NR, Rifai N:C-reactive protein, the metabolic
syndrome, and risk of incident cardiovascular events: an 8-year follow-up of 14 719 initially healthy American women.Circulation2003,107(3):391-7. 34. Fezeu L, Balkau B, Sobngwi E, Kengne AP, Vol S, Ducimetiere P, Mbanya JC:
Waist circumference and obesity-related abnormalities in French and Cameroonian adults: the role of urbanization and ethnicity.In J Obes 2010.
35. Furukawa Y, Kokubo Y, Okamura T, Watanabe M, Higashiyama A, Ono Y, Kawanishi K, Okayama A, Date C:The relationship between waist circumference and the risk of stroke and myocardial infarction in a Japanese urban cohort. The Suita Study.Stroke.
36. Fuller NJ, Jebb SA, Laskey MA, Coward WA, Elia M:Four-component model for the assessment of body composition in humans: comparison with alternative methods, and evaluation of the density and hydration of fat-free mass.Clin Sci1992,82(6):687-693.
37. Biaggi RR, Vollman MW, Nies MA, Brener CE, Flakoll PJ, Levenhagen DK, Sun M, Karabulut Z, Chen KY:Comparison of air-displacement plethysmography with hydrostatic weighing and bioelectrical impedance analysis for the assessment of body composition in healthy adults.Am J Clin Nutr1999,69(5):898-903.
doi:10.1186/1758-5996-2-13
Cite this article as:Pimentelet al.:Short-term nutritional counseling reduces body mass index, waist circumference, triceps skinfold and triglycerides in women with metabolic syndrome.Diabetology &
![Bis[hydrotris(4 chloro 3,5 dimethylpyrazolyl)borato]nickel(II)](data:image/gif;base64,R0lGODlhAQABAIAAAP///wAAACH5BAEAAAAALAAAAAABAAEAAAICRAEAOw==)