R E S E A R C H A R T I C L E
Open Access
Automatic identification of variables in
epidemiological datasets using logic
regression
Matthias W. Lorenz
1*, Negin Ashtiani Abdi
2, Frank Scheckenbach
1, Anja Pflug
1, Alpaslan Bülbül
1,
Alberico L. Catapano
3,4, Stefan Agewall
5,6, Marat Ezhov
7, Michiel L. Bots
8,9, Stefan Kiechl
10, Andreas Orth
2on behalf of the PROG-IMT study group
Abstract
Background:
For an individual participant data (IPD) meta-analysis, multiple datasets must be transformed in a
consistent format, e.g. using uniform variable names. When large numbers of datasets have to be processed, this
can be a time-consuming and error-prone task. Automated or semi-automated identification of variables can help
to reduce the workload and improve the data quality. For semi-automation high sensitivity in the recognition of
matching variables is particularly important, because it allows creating software which for a target variable presents
a choice of source variables, from which a user can choose the matching one, with only low risk of having missed
a correct source variable.
Methods:
For each variable in a set of target variables, a number of simple rules were manually created. With logic
regression, an optimal Boolean combination of these rules was searched for every target variable, using a random
subset of a large database of epidemiological and clinical cohort data (construction subset). In a second subset of
this database (validation subset), this optimal combination rules were validated.
Results:
In the construction sample, 41 target variables were allocated on average with a positive predictive value
(PPV) of 34%, and a negative predictive value (NPV) of 95%. In the validation sample, PPV was 33%, whereas NPV
remained at 94%. In the construction sample, PPV was 50% or less in 63% of all variables, in the validation sample
in 71% of all variables.
Conclusions:
We demonstrated that the application of logic regression in a complex data management task in
large epidemiological IPD meta-analyses is feasible. However, the performance of the algorithm is poor, which may
require backup strategies.
Keywords:
Meta-analysis, Data management, Logic regression, Epidemiology
Background
Today, many scientific insights are gained with
meta-analyses, rather than with single studies or trials, which is
illustrated with raising numbers of publications based on
analyses. Individual participant data (IPD)
meta-analyses are far less frequent, but increasing steeply as
well. Depending on the scientific question, IPD
meta-analyses are superior to publication-based meta-meta-analyses
in many aspects, including the possibility to choose
uni-form statistical models with uniuni-form adjustment, and
—
if
the search is systematic
—
a better control of publication
bias [1]. Prospectively planned pooled analyses
—
however
optimal [1]
—
are still very rare, given the unproportional
higher organisational effort needed.
Of course, the conduct of an IPD meta-analysis is far
more laborious than a publication-based one. One large
part of the workload is the harmonization of the acquired
datasets. To facilitate the statistical analysis, all datasets
must be transformed in a consistent format, which
includes using uniform variable names and coding. In a
* Correspondence:[email protected]
1Department of Neurology, University Clinic Frankfurt, Schleusenweg 2-16,
D-60528 Frankfurt/Main, Germany
Full list of author information is available at the end of the article
© The Author(s). 2017Open AccessThis article is distributed under the terms of the Creative Commons Attribution 4.0
large number of cohorts, that were planned and designed
independently, the retrospective harmonization of the
resulting data can become an immensely complex task
[2, 3]. Furthermore, manual serial harmonization of many
datasets is dull work that is prone to errors that have the
po-tential to compromise the integrity of the meta-analysis [4].
Automated identification of variables might help to reduce
the load of monotonous work, and therefore capacitates the
data manager to put maximal focus on data quality [4].
The PROG-IMT project (Individual progression of
carotid intima media thickness as a surrogate for
vascu-lar risk) is a vascu-large IPD meta-analysis project, with the
aim to assess whether the annual change of intima
media thickness (IMT, a high-resolution ultrasound
measure within the carotid artery wall) is a surrogate for
clinical endpoints, like myocardial infarction, stroke, or
death. The project works in three stages, where a large
number of datasets have been acquired, and their
num-ber is steadily growing. Details of the project plan have
been published in a rationale paper [5]. The acquired
datasets stem from large epidemiological population
studies, from hospital cohorts and from randomized
clinical trials (RCTs), each comprising between 200 and
2000 variables and between 100 and 15,000 participants.
They have in common that the same set of variables is
used for statistical analysis, including demographic data,
vascular risk factors, and IMT. When the current project
was started, we expected to acquire up to 250 individual
participant datasets in heterogeneous format and coding.
In order to design a computer program that helps to
reduce the workload of dataset harmonization, the first
step is to find criteria to assign the correct source
vari-able to a specific target varivari-able in the created uniform
dataset (
‘
allocation
’
). This can be attempted with simple
rules, like <
‘
cholesterol
’
in
‘
variable name
’
indicates the
target variable
‘
total cholesterol
’
>; or < a median value
greater than 94 indicates the target variable
‘
systolic
blood pressure
’
>. To obtain reliable performance, several
of these rules have to be combined.
Logic regression is a relatively new statistical method
that enables to combine simple binary rules in complex
logic trees, and that provides methods to find optimal
Boolean combinations [6]. As yet, this method has mostly
been used in genetics [7
–
11] and oncology [12] to
optimize complex models for disease prediction; to the
best of our knowledge it hasn
’
t been applied to data
management problems. Aim of this study was to apply logic
regression techniques to the problem of assigning variables,
as explained above, and to validate the performance of this
approach, using data from the PROG-IMT project.
Methods
The PROG-IMT project is involved in using datasets
from population-based epidemiologic studies, from risk
populations and from RCTs. At the time these analyses
were started, 34 datasets were available that were already
manually
harmonized.
These
were
randomly
(1:1)
assigned to a construction subset, or a validation subset
(Table 1). All these datasets include many variables; some
of those correspond to predefined target variables, which
are needed for the statistical analysis of the main project.
This set of target variables is shown in Table 2. The overall
algorithm followed is shown graphically in Fig. 1.
In a first step, a set of simple rules was manually
created (four to 41) for every target variable, by an
epidemiologist experienced in the handling of data of
this type. These rules are described in Additional file 1:
Table S1. These rules included conditions on the
variable name, the variable label, variable type (number,
date or string), scale level (ratio, ordinal or nominal,
dichotomous nominal); in nominal or ordinal variables
the number of values and the proportion of the most
frequent value; and in ratio variables the median and the
interquartile range.
For rules that involved a cutoff value (eg. median
greater than 44), this cutoff was optimized with ROC
analysis, with the aim to maximize the expression
‘
sensi-tivity + specificity
’
. For every target variable, logic
regres-sion models were created by Boolean combination of the
specific rules, or a subset of these. To find an optimal
Boolean combination of rules (example in Fig. 1), we
applied the
‘
simulated annealing
’
algorithm [4].
Simulated annealing is a generic optimization procedure
commonly used to optimize non-convex optimization
problems. It presupposes that an application specific score
or evaluation or loss function has been defined which
assigns a penalty to each state of a system. Simulated
an-nealing then iteratively perturbs the system using
applica-tions specific basic operaapplica-tions, in this case tree pruning
manipulations as mentioned below, with the aim of
reducing the score value of the perturbed state. The
perturbations are chosen in a random way with state
tran-sition probabilities changing in the course of the iteration.
This lowering of transition probabilities is the analogue of
lowering of temperature in random motion in physical
science and is the basic mechanism in simulated annealing
to reduce the danger of missing the global optima, while
at the same time allowing for convergence of the iteration.
In the current work transition probabilities were
systemat-ically reduced from 0.1 to 0.0001. When using simulated
annealing for logic regression in the context of identifying
source variable names, the states of the system are logical
expressions, like for example (R
1v R
2)
R
3that assign a
true or false value to candidate variable name based on
the rules R
1, R
2, R
3. The evaluation function was a
weighted least squares function of the type
SWS
res=
Σ
w
i(y
i–
y
i,pred)
2, which in the case of classification, where
y
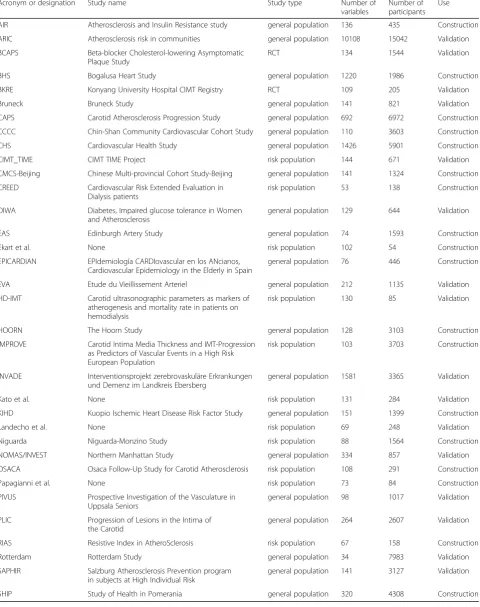
iTable 1
Datasets used for construction and validation
Acronym or designation Study name Study type Number of
variables
Number of participants
Use
AIR Atherosclerosis and Insulin Resistance study general population 136 435 Construction
ARIC Atherosclerosis risk in communities general population 10108 15042 Validation
BCAPS Beta-blocker Cholesterol-lowering Asymptomatic
Plaque Study
RCT 134 1544 Validation
BHS Bogalusa Heart Study general population 1220 1986 Construction
BKRE Konyang University Hospital CIMT Registry RCT 109 205 Validation
Bruneck Bruneck Study general population 141 821 Validation
CAPS Carotid Atherosclerosis Progression Study general population 692 6972 Construction
CCCC Chin-Shan Community Cardiovascular Cohort Study general population 110 3603 Construction
CHS Cardiovascular Health Study general population 1426 5901 Construction
CIMT_TIME CIMT TIME Project risk population 144 671 Validation
CMCS-Beijing Chinese Multi-provincial Cohort Study-Beijing general population 141 1324 Construction
CREED Cardiovascular Risk Extended Evaluation in
Dialysis patients
risk population 53 138 Construction
DIWA Diabetes, Impaired glucose tolerance in Women
and Atherosclerosis
general population 129 644 Validation
EAS Edinburgh Artery Study general population 74 1593 Construction
Ekart et al. None risk population 102 54 Construction
EPICARDIAN EPIdemiología CARDIovascular en los ANcianos,
Cardiovascular Epidemiology in the Elderly in Spain
general population 76 446 Construction
EVA Etude du Vieillissement Arteriel general population 212 1135 Validation
HD-IMT Carotid ultrasonographic parameters as markers of
atherogenesis and mortality rate in patients on hemodialysis
risk population 130 85 Validation
HOORN The Hoorn Study general population 128 3103 Construction
IMPROVE Carotid Intima Media Thickness and IMT-Progression
as Predictors of Vascular Events in a High Risk European Population
risk population 103 3703 Construction
INVADE Interventionsprojekt zerebrovaskuläre Erkrankungen
und Demenz im Landkreis Ebersberg
general population 1581 3365 Validation
Kato et al. None risk population 131 284 Validation
KIHD Kuopio Ischemic Heart Disease Risk Factor Study general population 151 1399 Construction
Landecho et al. None risk population 69 248 Validation
Niguarda Niguarda-Monzino Study risk population 88 1564 Construction
NOMAS/INVEST Northern Manhattan Study general population 334 857 Validation
OSACA Osaca Follow-Up Study for Carotid Atherosclerosis risk population 108 291 Construction
Papagianni et al. None risk population 73 84 Construction
PIVUS Prospective Investigation of the Vasculature in
Uppsala Seniors
general population 98 1017 Validation
PLIC Progression of Lesions in the Intima of
the Carotid
general population 264 2607 Validation
RIAS Resistive Index in AtheroSclerosis risk population 67 158 Construction
Rotterdam Rotterdam Study general population 34 7983 Validation
SAPHIR Salzburg Atherosclerosis Prevention program
in subjects at High Individual Risk
general population 141 3127 Validation
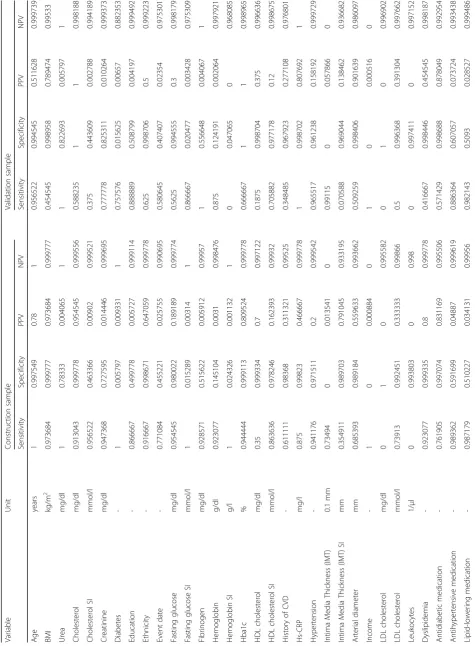
Table
2
Sensitivity,
specificity,
PPV
and
NPV
of
the
optimal
Boolean
combinations
in
the
construction
and
in
the
validation
sample
(Continued)
Nicotine
consum
ption
Pack
years
0.8
1
1
0.
99889
1
0.
71428
6
0.99
9482
0.83333
3
0.99896
4
Carot
id
plaque
-0.61363
6
0.99910
8
0.
87096
8
0.
99621
9
0.
95375
7
1
1
0.99784
3
Diastolic
blood
pre
ssure
mmHg
0.96511
6
0.98536
4
0
.56081
1
0
.99931
5
0
.76470
6
0.98
3255
0.37864
1
0.99681
7
Systoli
c
blood
pre
ssure
mmHg
0.67441
9
0.99977
5
0.
98305
1
0.
99373
3
0.
51063
8
0.99
6602
0.64864
9
0.99400
4
Socioe
conom
ic
status
-1
0.07651
4
0.
00430
4
1
0.
88888
9
0.07
2205
0.00222
7
0.99642
9
Sex
-0.875
0.99933
4
0.
875
0.
99933
4
0.
6875
0.99
8444
0.64705
9
0.99870
3
Smok
ing
statu
s
-0.97260
3
0.20229
0.
01959
2
0.
99778
5
0.
75
0.26
145
0.01363
2
0.98715
4
Trigl
ycerides
mg/dl
0.96969
7
0.13684
9
0
.00818
2
0
.99837
7
0
0.07
7201
0
1
Ultrasound
date
-0
0.99955
3
0
0.
98872
9
0
1
0.98889
7
1
Average
0.79958
4
0.70740
5
0.
34172
0.
94787
1
0.
61901
9
0.71
0383
0.32533
9
0.94199
count. In order to increase sensitivity without undue loss of
specificity, much higher weight was given to the positives
(0.9995, opposed to 0.0005 to the negatives), thus
compen-sating the much higher number of negatives, and the basic
operations are changes in the logical expression like
“
alter-nating leaves
”
,
“
alternating operators
”
,
“
growing a branch
”
,
“
pruning a branch
”
,
“
splitting a leaf
”
or
“
deleting a leaf
”
.
The names of these operations are better understood, when
visualizing a logical expression as a tree.
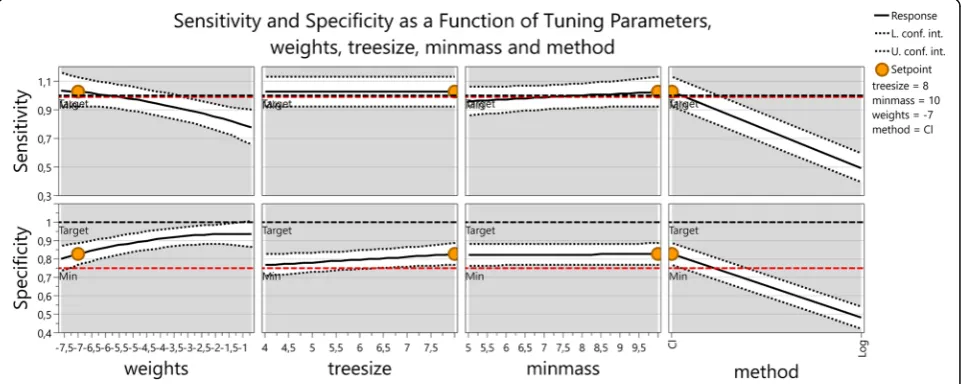
In order to understand the dependency of sensitivity
and specificity on the tuning parameters of the annealing
algorithm a factor analysis was performed. Two methods
were used, classification and logistic regression, four
different weights for the negatives, 5*10
-4, 5*10
-3, 5*10
-2,
and 5*10
-1, two tree sizes 5 and 10 and two values
namely 4 and 8 were used for the minimum number of
cases for which the tree needs to be 1. A 2
3x 4 hybrid
factorial design was performed. This yielded 32 runs for
sensitivity and specificity and allowed finding
interac-tions between the factors.
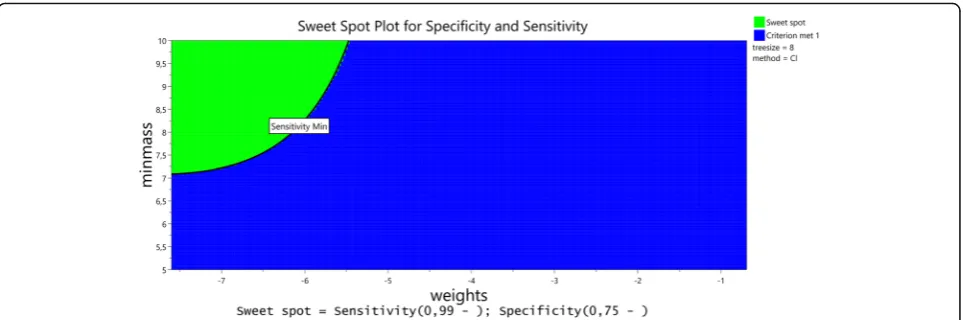
An optimization with the aim of maximizing sensitivity
(low limit 99%) and specificity (low limit 75%) followed by
dynamic profiling gave the result that direct
classifica-tion is better than logistic regression and that due to
the high interaction between the weights and the
classification method, low weights are important to
achieve high sensitivity. The loss in specificity that
results from lowering the weights is less important
than the gain in sensitivity (Figs. 2 and 3).
To find optimal combinations of rules for every target
variable we used the training subset of datasets. Logic
regression was applied in several models, where different
configuration parameters, such as the weight of cases
(matching
variables)
and
controls
(non-matching
variables), and the link function itself (classification or
logistic model), were varied.
After optimal configuration parameters were found,
the stability of the method was tested using
cross-validation: each 10% of the data were predicted from
models derived from the remaining 90% of data in turn.
As it is a typical characteristic of logic regression that
different source data result in qualitatively very different
logic trees, these models couldn
’
t be compared on the
procedural level. Therefore we compared the resulting
Fig. 1Fictitious example of a logic tree combining allocation rules
Fig. 2Sensitivity and specificity as a function of tuning parameters, weights, treesize, minmass and method. At the set point weights = exp(-7),
model quality in terms of sensitivity and specificity to
detect a specific target variable.
The best model was fixed, and used to predict the
correct assignment of variables in the validation sample.
The resulting precision in the validation data was
assessed using sensitivity, specificity, positive and
nega-tive predicnega-tive values. In the context of the present
study, sensitivity of a target variable is the portion of
matching source variables that are correctly identified.
Positive predictive value (PPV) is the portion of
identi-fied source variables for which the identification is
correct. Correspondingly, specificity is the portion of
non-matching source variables that are identified as such
and negative predictive value (NPV) is the portion of
negatively identified source variables for which this
iden-tification is correct.
The source data were prepared with SAS version 9.3
(The SAS Institute, Cary, USA) and stored into a.csv file
format. For the data handling and logic regression we
wrote programs within C#, using R and R.NET libraries,
including those from the R software package developed
by Ingo Ruczinski, Charles Kooperberg, and Michael
LeBlanc at the Fred Hutchinson Cancer Research Center
in Seattle (CRAN package version 3). The design for the
optimization of tuning parameters and the optimization
were done with MODDE Pro version 11 (mks Data
Analytic Solutions, Umea, Sweden).
Results
As expected from a classification algorithm using a tree
based method the logic trees themselves were quite
different among different cross validation runs and due
to the character of the simulated annealing algorithm
even for repeated runs with the same input data.
However the measured sensitivity and specificity of
different runs of the algorithm were quite stable and
allowed for reliable comparisons. The complete best
models for every target variable are shown in Additional
file 1: Table S1. Table 2 shows the performance
parame-ters of these best models. In columns 3
–
6, the results in
the construction sample are displayed. Sensitivity was on
average reasonable high (0.80), as was the specificity
(0.70). The PPV was overall poor (on average 0.34), NPV
was good (average 0.95). In columns 7
–
10 we showed
the results of independent validation (in the validation
sample). Here, sensitivity was considerable less (0.62),
but specificity was comparable (0.71), just as PPV (0.33)
and NPV (0.94).
Discussion
The performance was quite heterogeneous: in some
target variables, sensitivity, specificity, PPV and NPV
were very high (e.g. age, antidiabetic medication).
How-ever, many other variables showed PPV that was far too
low to be useful even in the construction sample. For
the intended use within a computer program to support
the data manager, the performance of the models
seemed reasonable at the first glance, in terms of
sensi-tivity. However, in order to determine the correct source
variable for a given target variable, the most important
quality indicator is PPV, which is the portion of
identi-fied source variables for which the identification is
correct. When the PPV is considered, the performance
of the algorithm was much worse. In fact, the majority
of variable had PPV values of 50% or less (63% in the
construction sample, 71% in the validation sample).
With failure rates as high as observed in the validation
sample, a fictitious computer program would have to
give a list of several candidate variables rather than a
single result, for each target variable. Furthermore, an
escape pathway would have to be implemented for the
case that the true target variable was not on the list
Fig. 3Sweetspot plot for sensitivity and specificity. The same information as in Fig. 2 as a two dimensional Contour Plot (Sweet Spot Plot) for
suggested by the program. However, even if the
algorithm can only give a
‘
first guess
’
which is correct in
50%, it may reduce the workload of the data manager by
nearly half.
Still, from a methodologic perspective, it is remarkable
that a tree based classification method based on a
ran-dom process such as the
‘
simulated annealing
’
behaves
in a reproducible fashion, on the result level, i.e.
regard-ing quality characteristics such as sensitivity and
specifi-city. The overall performance of the optimized logic
regression models in the validation sample, compared to
the construction sample, is quite similar to linear
regres-sion prediction models, for example. A finding that is
worth noticing is that our attempts to optimize for
sensitivity were counteracted by the models. For the
intended use, sensitivity is more important than
specifi-city, and PPV is more important than NPV, as a human
data manager has more difficulty reviewing many
variables than a short list of candidates, as long as he or
she can rely on the fact that the target variable is on this
short list. Therefore, we undertook efforts to optimize
the evaluation function of the algorithm for high
sensi-tivity and high PPV. In the construction sample this
worked nicely by weighting the positives by 0.9995
against 0.0005 for the negatives, i.e. a factor of 1999, for
the negatives. This improved sensitivity from 0.976
(0.995 against 0.005, i.e. 199) to 0.99948, while reducing
specificity from 0.87 to 0.78. Interestingly enough, as can
be verified in Table 2, the same models with the same
weighting turned out to be more specific than sensitive
in the validation sample.
As reflected by the increase of the number of
meta-analyses over time, many insights may be gained with
large collaborative projects collating data from many
participating cohorts in the future [13]. Although, from
the methodological point of view, the best form of
meta-analyses are most likely prospectively planned pooled
analyses [1, 13], such projects are still rare. This may be
due to the immense efforts and high volumes of funding
they require; furthermore such enterprises take many
years or even decades to complete. So in the near and
intermediate future, we will most likely increasingly face
the
‘
second best option
’
[1]: IPD meta-analyses that
require retrospective harmonization of data [14].. Whereas
some meta-analyses have developed impressively
profes-sional structures and algorithms [2
–
4] and the overall
quality of IPD meta-analyses has improved over the last
decade [15], there still remains scope for improving their
processes and statistical methods [14, 15].
To date, the aspects that are discussed in published
literature include mostly statistical modelling [15
–
19],
sometimes screening [15, 16], and rarely the process of
harmonization of data [2
–
4]. Fortier et al. [2] and
Doiron et al. [3] both describe detailed algorithms for
the harmonization of heterogeneous data including
manual allocation of target variables. Bosch-Capblanc
[4] suggested a computer program with a three-stage
al-gorithm to detect the matching source variable for each
given target variable. Compared to our algorithm, the
identification criteria are less refined, and it includes
al-ternative ways of allocating if the primary identification
criteria failed. To the best of our knowledge, no
publica-tion so far has refined the allocapublica-tions procedures to the
extent we have. As the Bosch-Capblanc algorithm [4]
focused more on the actual handling of the data, a
com-bination of his algorithm with our allocation procedure
may yield excellent results, which remains to be tested.
However, the process shown here needs relevant
manual preparations before an automated or
semi-automated process can start, e.g. the manual definition
of target-variable rules. This preparatory work is
de-pending on the number of target variables, whereas the
work saved by automating depends on the number of
datasets processed. These benchmark data have to be
weighted carefully to decide whether this approach is
economic. Most likely, it will be economic when many
datasets are processed, and few target variables are
needed. If the rule definitions might be automated, too,
this might facilitate the application considerably,
im-prove reproducibility and reduce investigator bias.
Conclusions
With the current work we demonstrated that it is in
principle possible to use logic regression models with the
automated
‘
simulated annealing
’
algorithm for the task of
allocating variables in large datasets to specific target
vari-ables. With the performance shown in the present example,
however, it would be necessary to introduce precautions in
the design of a computer program, to avoid missing the
true matching source variable. Such precautions may
in-clude the program suggesting a list of candidate variables
rather than a single matching variable, and the option of an
exit path with manual allocation. In any case, the
develop-ment effort for algorithm, optimal models and a computer
program is very high, and may only amortize if several
hundred datasets have to be handled.
Additional file
Additional file 1: Table S1.Rules for specific target variables and their
best Boolean combination.Table S2.Program parameters. List of Members of the PROG-IMT Study group. (DOC 744 kb)
Abbreviations
Acknowledgements
We thank Ingo Ruczinski, Charles Kooperberg, and Michael LeBlanc at the Fred Hutchinson Cancer Research Center in Seattle for providing the public license CRAN software package, and the related documentation.
This manuscript was prepared using a limited access dataset of the Atherosclerosis Risk In Communities (ARIC) study, obtained from the National Heart, Lung and Blood Institute (NHLBI). The ARIC study is conducted and supported by NHLBI in collaboration with the ARIC Study investigators. This manuscript does not necessarily reflect the opinions or views of the ARIC study or the NHLBI. The Bruneck study was supported by the Pustertaler Verein zur Praevention von Herz- und Hirngefaesserkrankungen,
Gesundheitsbezirk Bruneck, and the Assessorat fuer Gesundheit, Province of Bolzano, Italy. The Carotid Atherosclerosis Progression Study (CAPS) was supported by the Stiftung Deutsche Schlaganfall-Hilfe. The PLIC Study is sup-ported by a grant from SISA Sezione Regionale Lombarda. This manuscript was prepared using data from the Cardiovascular Health Study (CHS). The research reported in this article was supported by contracts N01-HC-85079 through N01-HC-85086, N01-HC-35129, N01 HC-15103, N01 HC-55222, and U01 HL080295 from the National Heart, Lung, and Blood Institute, with additional contribution from the National Institute of Neurological Disorders and Stroke. A full list of participating CHS investigators and institutions can be found at http:// www.chs-nhlbi.org. The EVA Study was organized under an agreement between INSERM and the Merck, Sharp, and Dohme-Chibret Company. The Edinburgh Artery Study (EAS) was funded by the British Heart Foundation. The IMPROVE study was supported by the European Commission (Contract number: QLG1- CT-2002- 00896), Ministero della Salute Ricerca Corrente, Italy, the Swedish Heart-Lung Foundation, the Swedish Research Council (projects 8691 and 0593), the Foundation for Strategic Research, the Stockholm County Council (project 562183), the Foundation for Strategic Research, the Academy of Finland (Grant #110413) and the British Heart Foundation (RG2008/014). The INVADE study was supported by the AOK Bayern. This manuscript was prepared using data from the Northern Manhattan Study (NOMAS) and the Oral Infections, Carotid Atheroscler-osis and Stroke (INVEST) study. The NOMAS is funded by the National Institute of Neurological Disorders and Stroke (NINDS) grant R37 NS 029993 and INVEST by the National Institute of Dental and Craniofacial Research (NIDCR) grant R01 DE 13094. The Rotterdam Study was supported by the Netherlands Foundation for Scientific Research (NWO), ZonMw, Vici 918-76-619. The Study of Health in Pomerania (SHIP; http://ship.community-medicine.de) is part of the Community Medicine Research net (CMR) of the University of Greifswald, Germany. Collaborators within the PROG-IMT study group:
Giuseppe D. Norata, PhD1,2, Jean Philippe Empana, MD, PhD3, Hung-Ju Lin, MD4, Stela McLachlan, PhD5, Lena Bokemark, MD, PhD6, Kimmo Ronkainen, MSc7, Mauro Amato, PhD8, Ulf Schminke, MD, Prof9, Sathanur R. Srinivasan, PhD, Prof.10, Lars Lind, MD, PhD, Prof11, Akihiko Kato, MD, Prof.12, Chrystosomos Dimitriadis, MD13, Tadeusz Przewlocki, MD, PhD, Prof.14, Shuhei Okazaki, MD15, CDA Stehouwer, MD, PhD, FESC16, Tatjana Lazarevic, MA17, Peter Willeit, PhD18,19, David N. Yanez, PhD, Assoc. Prof20, Helmuth Steinmetz, MD, Prof21, Dirk Sander, MD, Prof22, Holger Poppert, MD, PhD23, Moise Desvarieux, MD, PhD, Assoc. Prof.24, M. Arfan Ikram, MD, PhD, Assoc. Prof.25-27, Sebastjan Bevc, MD, PhD, Assist Prof28, Daniel Staub, MD, Prof.29, Cesare R. Sirtori, MD, PhD, Prof.30, Bernhard Iglseder, MD, Prof31,32, Gunnar Engström, MD, PhD, Prof.33, Giovanni Tripepi, MSc34, Oscar Beloqui, MD, PhD35, Moo-Sik Lee, MD., PhD., Prof.36,37, Alfonsa Friera, MD38, Wuxiang Xie, MD, PhD, Assist. Prof.39, Liliana Grigore, MD40, Matthieu Plichart, MD, PhD41, Ta-Chen Su, MD, PhD, Assoc. Prof.4, Christine Robertson, MBChB5, Caroline Schmidt, PhD, Assoc. Prof.42, Tomi-Pekka Tuomainen, MD, PhD, Prof7, Fabrizio Veglia, PhD8, Henry Völzke, MD, Prof43,44, Giel Nijpels, MD, PhD45,46, Aleksandar Jovanovic, MD, PhD, Prof47, Johann Willeit, MD, Prof.18, Ralph L. Sacco, MD, MS, Prof.48, Oscar H. Franco, MD, PhD, FESC, FFPH, Prof.49, Radovan Hojs, MD, PhD, Prof28,50, Heiko Uthoff, MD29, Bo Hedblad, MD, PhD, Prof33, Hyun Woong Park, M.D.36, Carmen Suarez, MD, PhD51, Dong Zhao, MD, PhD, Prof.39, Alberico Catapano, PhD, Prof.52,53, Pierre Ducimetiere, Prof.54, Kuo-Liong Chien, MD, Prof55, Jackie F. Price, MD5, Göran Bergström, MD, PhD, Prof56, Jussi Kauhanen, MD, Prof7, Elena Tremoli, PhD, Prof8,57, Marcus Dörr, MD, Prof.58, Gerald Berenson, MD, Prof.59, Aikaterini Papagianni, MD, Assoc. Prof.13, Anna Kablak-Ziembicka, MD, PhD, Prof.14, Kazuo Kitagawa, MD, PhD60, Jaqueline.M. Dekker, Prof61, Radojica Stolic, MD, PhD, Prof17, Stefan Kiechl, MD, Prof18, Joseph F. Polak, MD, MPH, Prof62, Matthias Sitzer, MD, Prof.63, Horst Bickel, PhD64, Tatjana Rundek, MD, PhD, Prof.48, Albert Hofman, MD, PhD, Prof.25, Robert Ekart, MD, PhD, Assist. Prof65, Beat Frauchiger, MD, Prof.66, Samuela Castelnuovo, PhD67, Maria Rosvall, MD, PhD, Assoc. Prof.68, Carmine Zoccali, MD, Prof.34, Manuel F Landecho, MD, PhD35, Jang-Ho Bae, MD.,PhD.,FACC.36,69, Rafael Gabriel, Prof., MD, Phd70, Jing Liu, MD, PhD, Prof.39, Damiano Baldassarre, PhD, Prof8, Maryam Kavousi, MD, PhD71.
Affiliations of collaborators:
1Dipartimento di Scienze Farmacologiche e Biomolecolari, Università degli Studi di Milano, Milan, Italy
2
SISA Center for the Study of Atherosclerosis, Bassini Hospital, Cinisello Balsamo, Italy
3Paris Cardiovascular Research Centre (PARCC), University Paris Descartes, Sorbonne Paris Cité, UMR-S970, Paris, France
4
Department of Internal Medicine, National Taiwan University Hospital, Taipei, Taiwan
5
Centre for Population Health Sciences,Usher Institute of Population Health Sciences and Informatics,University of Edinburgh, Edinburgh, UK
6Wallenberg Laboratory for Cardiovascular Research,Institution for Medicin, Department for Molecular and Clinical Medicine,Sahlgrenska Academy, Gothenburg University, Gothenburg, Sweden
7Institute of Public Health and Clinical Nutrition, University of Eastern Finland, Kuopio Campus, Kuopio, Finland
8Centro Cardiologico Monzino, IRCCS, Milan, Italy
9Department of Neurology, Greifswald University Clinic, Greifswald, Germany 10Center for Cardiovascular Health, Department of Epidemiology,
Biochemistry, Tulane University School of Public Health and Tropical Medicine, New Orleans, USA
11Department of Medicine, Uppsala University, Uppsala, Sweden
12Blood Purification Unit, Hamamatsu University Hospital, Hamamatsu, Japan 13University Department of Nephrology, Hippokration General Hospital, Thessaloniki, Greece
14
Department of Interventional Cardiology,Institute of Cardiology,Collegium Medicum Jagiellonian University, Krakow, Poland
15Department of Neurology, Osaka University Graduate School of Medicine, Osaka, Japan
16Department of Internal Medicine and Cardiovascular Research Institute Maastricht (CARIM), Maastricht University Medical Centre, Maastricht, the Netherlands
17
Faculty of Medicine, University of Kragujevac, Kragujevac, Serbia 18Department of Neurology, Medical University Innsbruck, Innsbruck, Austria 19Department of Public Health and Primary Care,School of Clinical Medicine,University of Cambridge, Cambridge, UK
20
Department of Biostatistics, University of Washington, Seattle, USA 21Department of Neurology, Goethe University, Frankfurt am Main, Germany 22Department of Neurology, Benedictus Hospital Tutzing & Feldafing, Feldafing, Germany
23
Department of Neurology, Technische Universität München, Munich, Germany 24Department of Epidemiology,Mailman School of Public Health,Columbia University, New York, USA
25Department of Epidemiology, Erasmus University Medical Center, Rotterdam, the Netherlands
26Department of Neurology, Erasmus University Medical Center, Rotterdam, the Netherlands
27Department of Radiology, Erasmus University Medical Center, Rotterdam, the Netherlands
28Department of Nephrology,Clinic for Internal Medicine,University Medical Centre Maribor, Maribor, Slovenia
29Department of Angiology, University Hospital Basel, Basel, Switzerland 30
Center of Dyslipidemias,Niguarda Ca’Granda Hospital, Milano, Italy 31Parcelsus Medical University, Salzburg, Austria
32Department of Geriatric Medicine, Gemeinnützige Salzburger Landeskliniken Betriebsgesellschaft GmbH Christian-Doppler-Klinik, Salzburg, Austria 33
Department of Clinical Sciences in Malmö, Lund University, Malmö, Sweden 34Clinical Epidemiology and Pathophysiology of Renal Diseases and Hypertension Unit, Institute of Physiology of the National Research Council (CNR), Reggio Calabria, Italy
35
Department of Internal Medicine, University Clinic of Navarra, Navarra, Spain 36College of Medicine, Konyang University Hospital, Daejeon, Korea 37
Department of Preventive Medicine, Konyang University, Daejeon, Korea 38Radiology Department,Hospital Universitario de la Princesa,Universidad Autónoma de Madrid, Madrid, Spain
39Department of Epidemiology,Beijing Institute of Heart, Lung and Blood Vessel Diseases,Beijing Anzhen Hospital, Capital Medical University, Beijing, China 40Centro Sisa per lo Studio della Aterosclerosi, Bassini Hospital, Cinisello Balsamo, Italy
42Walleng Laboratory for Cardiovascular Research, University of Gothenburg, Gothenburg, Sweden
43German Center for Cardiovascular Research (DZHK),partner site Greifswald, Greifswald, Germany
44Institute for Community Medicine, SHIP/Clinical-Epidemiological Research, Greifswald, Germany
45Department of General Practice,VU University Medical Center, Amsterdam, the Netherlands
46EMGO Institute for Health and Care Research, VU University Medical Center, Amsterdam, the Netherlands
47Faculty of Medicine, University of Prishtina, Prishtina\Kosovska Mitrovica, Serbia
48Department of Neurology,Miller School of Medicine,University of Miami, Miami, USA
49Department of Epidemiology, Erasmus MC, University Medical Center Rotterdam, Rotterdam, the Netherlands
50Faculty of Medicine, University of Maribor, Maribor, Slovenia 51Internal Medicine Department,Hospital Universitario de la Princesa,Universidad Autónoma de Madrid, Madrid, Spain 52
IRCSS Multimedica, Milan, Italy
53Department of Pharmacological and Biomolecular Sciences, University of Milan, Milan, Italy
54University Paris_Sud Xi, Kremlin-Bicêtre, Le Kremlin-Bicêtre, France 55
Institute of Epidemiology and Preventive Medicine,College of Public Health,National Taiwan University, Taipei, Taiwan
56Wallenberg Laboratory for Cardiovascular Research, Sahlgrenska Academy, Gothenburg University, Götheborg, Sweden
57
Dipartimento di Scienze Farmacologiche e Biomolecolari, Università di Milano, Milan, Italy
58Department B for Internal Medicine, University Medicine Greifswald, Greifswald, Germany
59
Department of Medicine, Pediatrics, Biochemistry, Epidemiology, Tulane University School of Medicine and School of Public Health and Tropical Medicine, New Orleans, USA
60Department of Neurology, Tokyo Women’s Medical University, Tokyo, Japan
61Department of Epidemiology and Biostatistics,University Medical Center, Amsterdam, the Netherlands
62Tufts University School of Medicine, Tufts Medical Center, Boston, USA 63
Department of Neuology, Klinikum Herford, Herford, Germany 64Department of Psychiatry and Psychotherapy, Technische Universität München, Munich, Germany
65Department of Dialysis,Clinic for Internal Medicine,University Medical Centre Maribor, Maribor, Slovenia
66Department of Internal Medicine,Division of Angiology,Kantonsspital Frauenfeld, Frauenfeld, Switzerland
67Centro Dislipidemie E. Grossi Paoletti,Ospedale Ca’Granda di Niguarda, Milan, Italy
68Department of Clinicla Sciences in Malmö, Lund University, Malmö, Sweden
69Heart Center, Konyang University Hospital, Daejeon, Korea 70
Instituto de Investigación Princesa IP,Hospital Universitario de la Princesa,Universidad Autónoma de Madrid, Madrid, Spain
71Department of Epidemiology and Biostatistics, Erasmus Medical Center, Rotterdam, the Netherlands
Funding
The PROG-IMT project was funded by the Deutsche Forschungsgemeinschaft (DFG Lo 1569/2-1 and DFG Lo 1569/2-3).
Availability of data and materials
The datasets supporting the conclusions of this article were not made publicly available due to legal restrictions arising from the data distribution policy of the PROG-IMT collaboration, and from bilateral agreements between the collaboration and data contributors.
Authors’contributions
MWL leads the PROG-IMT project, had the idea, formulated the hypothesis, supervised the analysis, analyzed and interpreted the data, and wrote the paper. NA wrote the computer program, did the analysis of the processed data, and participated in writing the paper. FS helped preparing the datasets,
formulated the single rules, and helper writing the paper. AP prepared the dataset for analysis and randomized them into construction and validations sample. In addition, she contributed ideas for the syntax of the rules and the design of a data management program discussed in this paper. She did the manual data management for some of the datasets used. AB did the manual data management for most datasets used, which was used as the gold standard of variable allocation. AC and SK delivered one of the datasets used. AC, SA, SK, MLB and ME contributed important intellectual content to the discussion of the paper. AO contributed to the design of the current study, supervised the programming, helped interpreting the results and contributed importantly to the discussion. All authors read and approved the final version of this manuscript.
Authors’information
MWL, FS, AP, AB, AC, SA, and ME are all members of the PROG-IMT study group, an international collaboration of scientists with various expertise in neurology, cardiology, pharmacology and other medical fields, and in cardiovascular epidemiology and statistical methodology. Aim of the Study Group is to contribute to a number of unresolved questions in the investigation of cardiovascular and cerebrovascular risk, within the framework of the PROG-IMT project. Details on the project have been published earlier [2] and can be reviewed on the project website www.prog-imt.org. NA and AO are members of the Faculty of Computer Science and Engineering at the Frankfurt University of Applied Sciences, and contributed their skills in program design, programming and statistics.
Competing interests
The authors declare that they have no competing interests
Consent for publication Not applicable.
Ethics approval and consent to participate
The present analysis has been performed in accordance with the Declaration of Helsinki. It is based on data of, and performed within the framework of the PROG-IMT project, which is an individual participant data meta-analysis on data from multiple clinical and epidemiological studies. All contributing studies collected informed consent of all participating individuals. The PROG-IMT project was approved by the Ethics committee of Medical Faculty of Frankfurt University under the reference number 304/13.
Publisher
’
s Note
Springer Nature remains neutral with regard to jurisdictional claims in published maps and institutional affiliations.
Author details
1Department of Neurology, University Clinic Frankfurt, Schleusenweg 2-16,
D-60528 Frankfurt/Main, Germany.2Faculty of Computer Science and
Engineering, Frankfurt University of Applied Sciences, Frankfurt/Main, Germany.3IRCSS Multimedica, Milan, Italy.4Department of Pharmacological
and Biomolecular Sciences, University of Milan, Milan, Italy.5Institute of
Clinical Sciences, University of Oslo, Oslo, Norway.6Department of
Cardiology, Oslo University Hospital Ullevål, Oslo, Norway.7Atherosclerosis Department, Cardiology Research Center, Moscow, Russia.8University
Medical Center Utrecht, Utrecht, The Netherlands.9Department of
Epidemiology and Biostatistics, Erasmus Medical Center, Rotterdam, The Netherlands.10Department of Neurology, Medical University Innsbruck, Innsbruck, Austria.
Received: 12 May 2016 Accepted: 23 March 2017
References
1. Blettner M, Sauerbrei W, Schlehofer B, Scheuchenpflug T, Friedenreich C. Traditional reviews, meta-analyses and pooled analyses in epidemiology. Int J Epidemiol. 1999;28:1–9.
2. Fortier I, Doiron D, Little J, Ferretti V, L’Heureux F, Stolk RP, Knoppers BM, Hudson TJ, Burton PR, International Harmonization Initiative. Is rigorous retrospective harmonization possible? Application of the DataSHaPER approach across 53 large studies. Int J Epidemiol. 2011;40:1314–28. 3. Doiron D, Burton P, Marcon Y, Gaye A, Wolffenbuttel BH, Perola M, Stolk RP,
Ferretti V, Fortier I. Data harmonization and federated analysis of population-based studies: the BioSHaRE project. Emerg Themes Epidemiol. 2013;10:12.
4. Bosch-Capblanch X. Harmonisation of variables names prior to conducting statistical analyses with multiple datasets: an automated approach. BMC Med Inform Decis Mak. 2011;11:33.
5. Lorenz MW, Bickel H, Bots ML, Breteler MMB, Catapano AL, Desvarieux M, Hedblad B, Iglseder B, Johnsen SH, Juraska M, Kiechl S, Mathiesen EB, Norata GD, Grigore L, Polak J, Poppert H, Rosvall M, Rundek T, Sacco RL, Sander D, Sitzer M, Steinmetz H, Stensland E, Willeit J, Witteman J, Yanez D, Thompson SG, The PROG-IMT Study Group. Individual progression of carotid intima media thickness as a surrogate for vascular risk (PROG-IMT)– rationale and design of a meta-analysis project. Am Heart J. 2010;159:730–6. 6. Ruczinski I, Kooperberg C, LeBlanc M. Logic regression. J Comput Graphical
Stat. 2003;12:475–511.
7. Kooperberg C, Ruczinski I. Identifying interacting SNPs using Monte Carlo logic regression. Genet Epidemiol. 2005;28:157–70.
8. Kooperberg C, Bis JC, Marciante KD, Heckbert SR, Lumley T, Psaty BM. Logic regression for analysis of the association between genetic variation in the renin-angiotensin system and myocardial infarction or stroke. Am J Epidemiol. 2007;165:334–43.
9. Dinu I, Mahasirimongkol S, Liu Q, Yanai H, Sharaf Eldin N, Kreiter E, Wu X, Jabbari S, Tokunaga K, Yasui Y. SNP-SNP interactions discovered by logic regression explain Crohn’s disease genetics. PLoS One. 2012;7:e43035. 10. Sarbakhsh P, Mehrabi Y, Daneshpour MS, Zayeri F, Zarkesh M. Logic
regression analysis of association of gene polymorphisms with low HDL: Tehran Lipid and Glucose Study. Gene. 2013;513:278–81.
11. Zhi S, Li Q, Yasui Y, Edge T, Topp E, Neumann NF. Assessing host-specificity of Escherichia coli using a supervised learning logic-regression-based analysis of single nucleotide polymorphisms in intergenic regions. Mol Phylogenet Evol. 2015;92:72–81.
12. Janes H, Pepe M, Kooperberg C, Newcomb P. Identifying target populations for screening or not screening using logic regression. Stat Med. 2005;24: 1321–38.
13. Riley RD, Sauerbrei W, Altman DG. Prognostic markers in cancer: the evolution of evidence from single studies to meta-analysis, and beyond. Br J Cancer. 2009;100:1219–29.
14. Stewart LA, Clarke M, Rovers M, Riley RD, Simmonds M, Stewart G, Tierney JF, PRISMA-IPD Development Group. Preferred reporting items for systematic review and meta-analyses of individual participant data: the PRISMA-IPD statement. JAMA. 2015;313:1657–65.
15. Simmonds M, Stewart G, Stewart L. A decade of individual participant data meta-analyses: A review of current practice. Contemp Clin Trials. 2015 Jun 17 [Epub ahead of print].
16. Boccia S, De Feo E, Gallì P, Gianfagna F, Amore R, Ricciardi G. A systematic review evaluating the methodological aspects of meta-analyses of genetic association studies in cancer research. Eur J Epidemiol. 2010;25:765–75. 17. Debray TP, Moons KG, Abo-Zaid GM, Koffijberg H, Riley RD. Individual
participant data meta-analysis for a binary outcome: one-stage or two-stage? PLoS One. 2013;8:e60650.
18. Thomas D, Radji S, Benedetti A. Systematic review of methods for individual patient data meta- analysis with binary outcomes. BMC Med Res Methodol. 2014;14:79.
19. Ahmed I, Debray TP, Moons KG, Riley RD. Developing and validating risk prediction models in an individual participant data meta-analysis. BMC Med Res Methodol. 2014;14:3.
• We accept pre-submission inquiries
• Our selector tool helps you to find the most relevant journal
• We provide round the clock customer support
• Convenient online submission
• Thorough peer review
• Inclusion in PubMed and all major indexing services
• Maximum visibility for your research
Submit your manuscript at www.biomedcentral.com/submit