ORIGINAL ARTICLE
Noboru Nakamura · Kazuhiko Fujita
Simulation method to generate the strength of glulam using correlated
random variables
Abstract Many reports have been published about design-ing the strength of glulam usdesign-ing simulation methods. In simulation methods, one of the most important problems is how to deal with correlations among strength factors, i.e., modulus of elasticity (MOE), modulus of rupture (MOR), tensile strength (σT), and compression strength (σC). For
example, in the case that the MOR criteria of glulam is σni/
fni+σbi/fbi≥1 (where σni and σbi are the axial stress and the
bending stress of the i-th lamina respectively, and fniand fbi
are the axial strength and the bending strength of the i-th lamina respectively), a correlation between fni and fbi exists.
How can we account for this correlation when calculating the strength of glulam, bearing in mind that it is very diffi -cult to measure the correlation coeffi cients among MOR, σT, and σC? We developed a method by which these
prob-lems could be solved, and, using random variables gener-ated by this method, the strengths of glulam were simulgener-ated. The simulated values were almost the same as the experi-mental values. The results indicated the usefulness of the method.
Key words Simulation method · Glulam strength · Correla-tion coeffi cients · Lamina strength
Introduction
Several simulation methods1–7
for designing the strength of glulam have been proposed. In the simulation method, an important problem is how to deal with correlations among strength factors such as modulus of elasticity (MOE), modulus of rupture (MOR), tensile strength (σT), and
com-N. Nakamura (*)
Institute of Wood Technology, Akita Prefectural University, Noshiro 016-0876, Japan
Tel. +81-185-52-6985; Fax +81-185-52-6976 e-mail: [email protected]
K. Fujita
Forestry Research Center, Hiroshima Prefectural Technology Research Institute, Hiroshima 728-0013, Japan
pression strength (σC), because some of them are involved
in the strength criteria of glulam. For instance, in the case of two factors, MOE and σT, the simulation method to
gen-erate them using correlated random variables was shown in Taylor and Bender,8 but no method has been put forward to incorporate additional factors. The reason might be that it is very diffi cult to measure the correlation coeffi cients among MOR, σT, and σC. Even if the matched specimen
method is used, we cannot measure the strength factors of the exact same specimens.
Therefore, we developed a method by which the correla-tion coeffi cients among the strength factors could be calcu-lated. Using this method, the strengths of glulam were simulated. To validate the method, experiments were carried out to determine MOE, MOR, σT, and σC of glulam; the
results are given in this report.
Materials and methods
Specimens and experiments for laminae
MOE, MOR, σT, and σC were measured for Sugi (Japanese
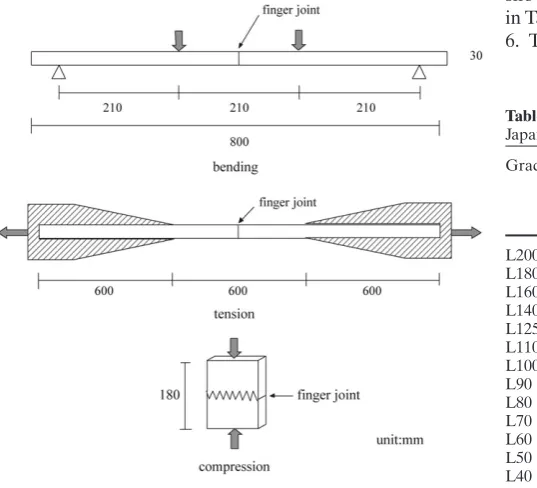
cedar) and Douglas-fi r laminae. Before tension and com-pression testing, MOE values were measured by bending tests, as shown in Fig. 1. When σT and σC were measured,
Young’s modulus in tension (ET) and compression (EC)
were also measured. EC and ET were measured by
displace-ment transducers fi xed on four sides of the specimens. The grades of Sugi laminae were L30–L90 and those of Douglas fi r laminae were L90–L160. The grades for laminae were determined according to the minimum MOE measured using a continuous MOE measuring machine. Compatibility conditions for each lamina grade in the Japanese Agricul-tural Standard (JAS) for glulam are shown in Table 1. In this table, 5% values are calculated under the assumption that the strength is normally distributed.
The experimental setup is shown in Fig. 1. The width and thickness of laminae were 105 mm and 30 mm, respectively, and each lamina had a single fi nger joint. MOE values of each specimen for tensile and compression strengths were Received: May 24, 2010 / Accepted: September 29, 2010 / Published online: March 17, 2011
Fig. 1. Setups for various experiments on lamina
Table 1. Compatibility conditions for modulus of elasticity (MOE) in Japanese Agricultural Standard
Grade Minimum MOE (kN/mm2)
Bending strength (N/mm2)
Tensile strength (N/mm2)
Mean 5% value Mean 5% value
L200 20.0 81.0 61.0 48.0 36.0
L180 18.0 72.0 54.0 42.5 32.0
L160 16.0 63.0 47.5 37.5 28.0
L140 14.0 54.0 40.5 32.0 24.0
L125 12.5 48.5 36.5 28.5 21.5
L110 11.0 45.0 34.0 26.5 20.0
L100 10.0 42.0 31.5 24.5 18.5
L90 9.0 39.0 29.5 23.5 17.5
L80 8.0 36.0 27.0 21.5 16.0
L70 7.0 33.0 25.0 20.0 15.0
L60 6.0 30.0 22.5 18.0 13.5
L50 5.0 27.0 20.5 16.5 12.0
L40 4.0 24.0 18.0 14.5 10.5
L30 3.0 21.0 16.0 12.5 9.5
Table 2. Strength properties of laminae
Species Strength factor MOE
(kN/mm2)
MOR
(N/mm2) σ(N/mmT 2) σ(N/mmC 2)
Douglas fi r No. of specimens 420 150 145 125
Mean 13.68 58.61 40.35 47.90
Coeffi cient of variation 0.17 0.21 0.21 0.13
Probability distribution function 3P-Weibull Normal Normal Log-normal
Sugi No. of specimens 498 170 158 170
Mean 5.49 34.57 23.76 31.73
Coeffi cient of variation 0.34 0.25 0.28 0.17
Probability distribution function Normal Log-normal Log-normal Log-normal
MOR, modulus of rupture; σT, tensile strength; σC, compression strength; 3P, three-parameter measured before strength testing and the grade was decided.
The number of specimens for each grade was about 30.
Correlation coeffi cients between strength factors of laminae
Each lamina broke at the fi nger joint. The results of the strength experiments are summarized in Table 2; in this table, the best-fi t probability distributions are also shown. Kolmogorov-Smirnov examination was used to fi t the strength data to the probability distribution.
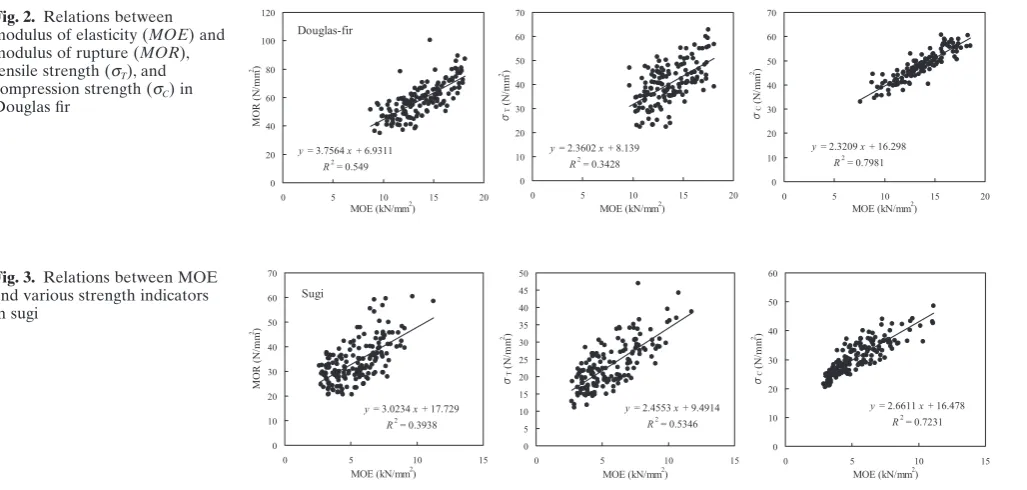
The relations between MOE and strengths in Douglas fi r and Sugi are shown in Figs. 2 and 3, respectively. Using these regression analyses, correlation coeffi cients between MOE and the strengths were calculated. The results are shown in Tables 3 and 4.
Calculation of correlation coeffi cients among strength factors other than those measured by experiment
In Tables 3 and 4, correlation coeffi cients could not be mea-sured rigorously, even though matched specimens were
used. Therefore, we calculated the values by the following method. First, a combination of uniform random variables from 0 to 1 with no correlation was generated by the Mer-senne twister method.9
The number of generated random variables for each strength factor was 1000. Next, these variables were transformed into a combination of standard normal variables with no correlation. Third, they were trans-formed into a combination of standard normal variables with correlation. Fourth, they were further transformed into non-normal variables with correlation by Rosenblatt trans-formation. Using this method, correlation coeffi cients among the strength factors such as MOR, σT, and σC were
calculated. The results are shown in Tables 5 and 6. We can see that the values measured by experiments are almost same as those generated by this method.
Validation of the method
Fig. 2. Relations between modulus of elasticity (MOE) and modulus of rupture (MOR), tensile strength (σT), and compression strength (σC) in Douglas fi r
Fig. 3. Relations between MOE and various strength indicators in sugi
Table 3. Calculatedcorrelation coeffi cients for Douglas-fi r laminae
MOE MOR ET σT EC σC
MOE 1 0.741 0.881 0.585 0.810 0.893
MOR 1 ? ? ? ?
ET 1 0.503 ? ?
σT 1 ? ?
EC Sym. 1 0.745
σC 1
ET, Young’s modulus in tension; EC, Young’s modulus in compression; ?, unknown
Table 4. Calculated correlation coeffi cients for sugi laminae
MOE MOR ET σT EC σC
MOE 1 0.628 0.977 0.731 0.943 0.850
MOR 1 ? ? ? ?
ET 1 0.718 ? ?
σT 1 ? ?
EC Sym. 1 0.805
σC 1
Table 5. Correlation coeffi cients for Douglas-fi r laminae by the pro-posed method
MOE MOR ET σT EC σC
MOE 1 0.749 0.882 0.583 0.809 0.892
MOR 1 0.669 0.464 0.600 0.674
ET 1 0.508 0.731 0.797
σT 1 0.459 0.517
EC Sym. 1 0.736
σC 1
Table 6. Correlation coeffi cients for sugi laminae by the proposed method
MOE MOR ET σT EC σC
MOE 1 0.638 0.979 0.754 0.951 0.855
MOR 1 0.619 0.476 0.596 0.525
ET 1 0.732 0.929 0.838
σT 1 0.718 0.652
EC Sym. 1 0.810
σC 1
Table 7. Correlation coeffi cients for Douglas-fi r laminae using corre-lated random variables
MOE MOR ET σT EC σC
MOE 1 0.744 0.878 0.566 0.807 0.880
MOR 1 0.673 0.434 0.617 0.662
ET 1 0.488 0.714 0.786
σT 1 0.454 0.502
EC Sym. 1 0.742
σC 1
Table 8. Correlation coeffi cients for sugi laminae using correlated random variables
MOE MOR ET σT EC σC
MOE 1 0.647 0.976 0.760 0.946 0.853
MOR 1 0.638 0.480 0.605 0.524
ET 1 0.742 0.932 0.829
σT 1 0.735 0.661
EC Sym. 1 0.805
proposed here. In this method, all correlation coeffi cients were transformed according to the best-fi t probability distributions.10
Simulation of glulam strengths using correlated random variables
Using random variables generated by the above-mentioned method, glulam strengths were generated and compared to those of experiments.
Specimens and experiments of glulam
Glulam specimens are shown in Fig. 4, in which the combi-nations of laminae are also shown. Bending, tensile, and compression strengths were measured in about six speci-mens for each experiment. Bending experiments were con-ducted according to JAS, but compression experiments were conducted according to Testing and Evaluation Method for Full-size Structural Timber Strength,11
as shown in Fig. 5. In contrast, tension experiments were not con-ducted to the specifi ed standard, because the length of specimens was not as long as shown in Fig. 5.
Results and discussion
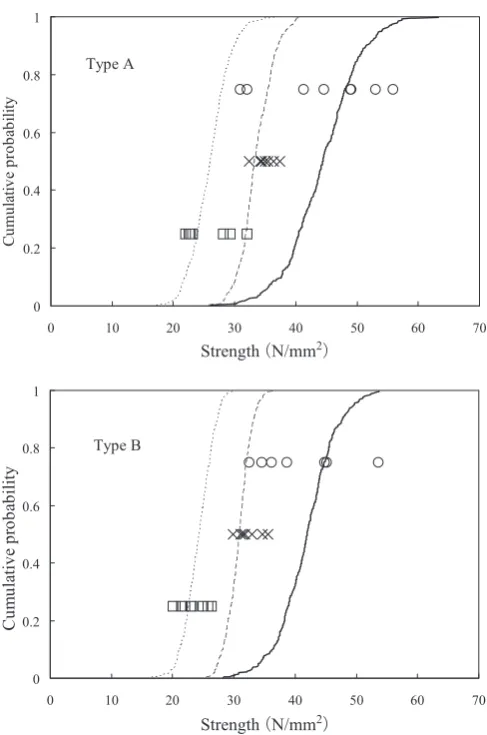
An example of the relationships between strength and cumulative probability for type A and B are shown in Fig. 6, and also type C and D in Fig. 7. Results of experiments are also shown. Each glulam specimen broke at the fi nger joint and the results for other glulam grades were similar. The simulation method is that described above. Five hundred virtual glulam specimens were generated. The fracture cri-teria for bending and axial strength are σni/fni+ σbi/fbi≥ 1 and
Type A Type B Type C Type D
L125 L140 L160 L160 L60-L90 L125 L70 L140 L30-L50 L60-L90 L50 L70 L60-L90 L30-L50 L70 L50 L125 L30-L50 L160 L50 Lamina grade L30-L50 Lamina grade L50 0 5 L 0
5 L -0 3 L
0 7 L 0
9 L -0 6 L
0 4 1 L 5
2 1 L
0 6 1 L 0
4 1 L
Lamina grade Lamina grade
Fig. 4. Specimens for glulam experiments. The width of all glulam specimens was 105 mm. The thickness of type A and C specimens was 150 mm and the thickness of type B and D specimens was 300 mm.
Shaded laminae, Douglas-fi r; white laminae, sugi Fig. 5. Setups for the glulam experiments
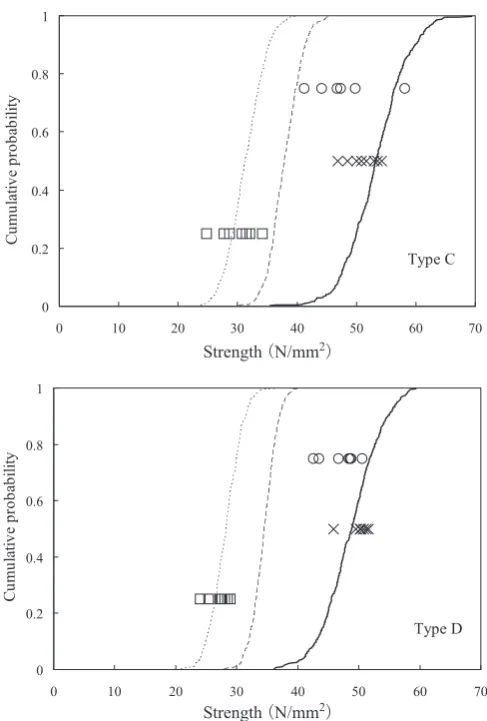
Fig. 7. Results of simulation and experiments (type C and D specimens)
σni/fni≥1, respectively. Here, σni and σbi are the axial stress
and the bending stress ofthe i-th lamina, respectively, and
fni and fbi are the axial strength and the bending strength of
the i-th lamina, respectively. Note that the cumulative prob-ability of the experiments is plotted for convenience, but is not particularly meaningful. It can be seen that the experi-mental measurements are roughly in the same range as the
simulation, except for compression strengths of type C and D specimens. The reason that the simulated values are smaller than the experimental values for compression strength is not clear, but the fracture criteria for compres-sion strength might not be appropriate.
Conclusions
A simulation method for generating the strength of glulam using correlated random variables is described here; the correlated random variables are MOE, MOR, σT, and σC,
among others. Experiments to validate the method were conducted. By comparing the simulation and experiment results, this method was shown to be useful for generating the strength of glulam.
References
1. Foschi RO, Barrett D (1980) Glued-laminated beam strength: a model. J Struct Div 106:1735–1754
2. Ehlbeck J, Colling F, Gorlacher R (1985) Infl uence of fi nger jointed lamellae on the bending strength beams – development of a com-puter model. Holz Roh-Werkst 43:333–337
3. Hernandez R, Bender DA, Richburg BA, Kline KS (1992) Proba-bilistic modeling of glued-laminated timber beams. Wood Sci Fiber 24:294–306
4. Tomoyuki H (1990) Probabilistic model for bending strength of 5-ply glulam (in Japanese). J Soc Mater Sci 39:1197–1202
5. Yoshihiko H, Yukio Y, Shigehiko S (1994) Modeling for the strength of glulam beams and for their probabilistic distribution (in Japa-nese). Mokuzai Gakkaishi 40:1172–1179
6. Hirozo M, Naoyuki I, Yoshinori I, Noboru S (1997) Analytical model for the design of performance in glulam beams of Japanese cedar I (in Japanese). Mokuzai Gakkaishi 42:122–129
7. Kohei K (1997) Predicting of maximum bending moment of glulam beam composed of arbitrary laminae and verifi cation by experi-mental results (in Japanese). Mokuzai Gakkaishi 43:934–939 8. Taylor SE, Bender DA (1991) Stochastic model for localized tensile
strength and modulus of elasticity in lumber. Wood Fiber Sci 23:501–519
9. Matsumoto M, Nishimura T (1998) Mersenne twister: a 623-dimensionally equidistributed uniform pseudorandom number generator. ACM Trans Model Comput Simul 8:3–30
10. Der Kiureghian A, Liu P-L (1986) Structural reliability under incomplete probability information. J Eng Mech 112:85–104 11. Architectural Institute of Japan (2003) Recommendation for limit