O R I G I N A L A R T I C L E
Open Access
Spatial clustering and risk factors of infant
mortality: district-level assessment of
high-focus states in India
Ashish Kumar Gupta
1*, Laishram Ladusingh
2and Kakoli Borkotoky
1* Correspondence: ashishatbhu@gmail.com
1International Institute for
Population Sciences (IIPS), Mumbai, India
Full list of author information is available at the end of the article
Abstract
The study analyzes the spatial clustering and risk factors of infant mortality across high-focus states of India, using the Annual Health Survey (2010–2011), Census of India (2011), and District Level Household and Facility Survey-3 (2007–2008). Research has found substantial spatial autocorrelation across the districts and identified the “hot spots”characterized by higher infant mortality rate (IMR) in the districts of the central region (Uttar Pradesh and Madhya Pradesh) of India. This study has considered several theoretical perspectives and implements a series of spatial regression models that allows accounting for household amenities and mother/child and health facility variables to determine the key risk factors of infant mortality. Our empirical analysis underscores the importance of the infrastructure of the health facility in improving the infant mortality scenario of the districts. The regression results show that the districts with a higher proportion of 24-h functioning primary healthcare centers have overall less infant mortality. In addition, the absence of drinking water from a treated source, unavailability of toilet facilities, and higher proportion of people in the bottom wealth quintile in the household were adversely associated with the IMR. In conclusion, reduction of infant mortality would be possible only if area-specific measures would be adopted on those clusters of districts where infant mortality is high irrespective of the state they belong to.
Background
Infant and child survival depend on a host of socioeconomic, environmental, and con-textual factors. Determining the contribution of each of these factors provides useful feedback to the programs related to maternal and child health. The distribution of in-fant and child mortality and their determinants vary across genders, socioeconomic groups, and geographical regions. Mapping of the variation in infant mortality can help in improving programs in terms of the allocation of limited resources to those regions with high unmet needs of healthcare. It is also widely accepted that infant mortality is an indicator of both economic and social wellbeing and represents multiple social de-terminants of health (Rodwin and Neuberg, 2005).
Although infant mortality is declining worldwide, the pace of decline has been rather slow in India. A further concern is that it is uneven across regions and socioeconomic groups. Reduction in infant mortality is the major focus of India’s maternal and child
health programs from their inception (James 2014). However, given the current rate of decline and assuming a linear trend, India’s infant mortality rate (IMR) would be about 42 in 2015. At this pace, the MDG 4 target of 28 would only be achieved in 2023–2024 (Reddy 2012). The unsatisfactory pace of decline of infant mortality is largely attributed to regional inequality in the improvement of IMRs. There is a cluster of states, namely Uttar Pradesh, Uttarakhand, Bihar, Jharkhand, Chhattisgarh, Odisha, Madhya Pra-desh, Rajasthan, and Assam that has higher infant mortality than India’s national average. More significantly, these states have 48.5 % of India’s population and thus shape national targets related to infant and child mortality.
According to SRS (Registrar General of India 2014), the four states of Madhya Pradesh (MP), Assam (AS), Uttar Pradesh (UP), and Odisha (OD) have IMRs above 50, the highest in the country. However, state-level infant mortality has masked the intra-district clustering of infant mortality. An empirical examination of intra-district-level infant mortality revealed that the numbers of districts having IMR above their respective state averages are 28 out of 45 in MP, 9 out of 23 in Assam, 34 out of 70 in UP, and 12 out of 30 in Odisha (RGI 2012).
The slow decline of infant mortality has been the concern of policy makers and re-searchers equally. The National Rural Health Mission (NRHM) by the Government of India in 2005 is regarded as the flagship public health program for improving infant and child health. Although significant progress has been achieved in this direction, the improvement is not uniform across regions/sub-groups of population in the high-focus states (Hussain 2011; Programme evaluation organization 2011). The high-focus states were designated as such by the Indian government because of their persistently high IMRs. In the context of intra-district variation in infant mortality, the main questions that emerge are as follows: Where are the “hot spots” of infant mortality in the high-focus states? Whether maternal- and child-level factors at the aggregated level are enough to explain regional disparity in IMR? Would district-level contextual factors be more appropriate for programmatic intervention? Could emphasis on health infrastruc-ture in primary healthcare centers further improve infant survival? The objective of this paper is to address some of these questions by investigating the determinants of IMR in the high-focus states of India.
Earlier studies using geo-spatial analysis (Singh et al. 2011) found evidence of the im-portance of spatial risk factors in explaining differential IMRs in the region. Adjusting for biophysical and geographical factors, Kumar et al. (2012) showed the importance of health program initiatives in curtailing under-five mortality in the high-focus states. These analyses suggest that there is a strong geographic clustering in IMR and that a substantial portion of this patterning remains even after controlling for socioeconomic and demographic variables.
The present study contributes to the debate about intra-district differentials and risk factors of IMR by reintroducing geography in a number of ways. Firstly, the study used detailed information about the household amenities, sociogeographic, demographic, healthcare utilization, and health facility variables at the district level as risk factors of IMR using geo-spatial methods for the high-focus states. Secondly, health facility variables are included in the analysis to show the spatial association between the availability of health infrastructure and IMR in the high-focus states. Finally, the identification of risk factors which accounts for the unevenness in the pace of decline in IMR would provide feedback for the betterment of backward and underdeveloped high-focus states of India.
Our attempt is consistent with recent studies that focused on exploring macro-level determinants of child health (Gouda et al. 2015; Goli and Jaleel 2014; Bhattacharya and Cornilius 2011). We have tried to show that there is a high degree of spatial clustering in IMR. Detailed data were used to demonstrate that the geographical clustering per-sists even after controlling for all the known household, maternal- and child-level, healthcare, and health facility variables. Later, a series of spatial maps are developed to investigate whether the clustering of IMR in a given area is related to conditions in the neighboring areas. These maps show that being adjacent to areas with high IMR ap-pears to be an important predictor of high mortality in that area. IMRs can increase (or decrease) in a given area because of conditions in that area or because the area is adja-cent to another in which mortality is increasing (or decreasing) through a combination of both the factors.
Data and methods
Data
Data for analysis was drawn from 284 districts of the high-focus states. These states are Uttar Pradesh, Bihar, Rajasthan, Madhya Pradesh, Odisha, Jharkhand, Chhattisgarh, Uttarakhand, and Assam. The district-level data for all nine states were obtained from
the Annual Health Survey (2010–2011), Census (2011), and District level household
and facility survey (DLHS-3; 2007–2008).
conducted in India and has been specially designed to generate estimates of IMR, neo-natal and postneo-natal mortality rates, and U5MR at the district level. The sample size re-quirement is calculated for estimation of IMR within 1 % relative standard error (RSE). The district-level estimate of IMR from AHS is statistically robust as it is based on a very large sample size as shown in the Appendix.
The present study used the district-level estimates on IMR provided by the AHS
conducted during 2010–2011 in the nine high-focus states as outcome variables.1
Further, household economic condition and maternal and child healthcare variables given in the AHS were used as predictors of infant mortality. Census 2011 covered 640 districts including 7935 towns and 640,867 villages. District-level information on household amenities such as availability of drinking water from a treated source, percentage literate and working females in the households, and percentage of urban households with drainage and sanitation facilities in the high-focus states was modeled with IMR.
Besides, information related to health facilities has been extracted from the facility
survey of DLHS-3 (2007–2008). DLHS is the only source of information on health
facilities along with maternal and child health indicators at the district level.
Description of the variables
The unit of analysis is the districts. The outcome variable is the IMRs for selected dis-tricts. The choice of explanatory variables is guided by existing literature and an analyt-ical framework proposed by Mosley and Chen (1984) to study the determinants of child survival in developing countries. The variables have been classified into the fol-lowing categories: mother and child variables, those capturing household amenities, and indicators of utilization of healthcare services and health facilities (Table 1). Uni-variate, biUni-variate, and multivariate exploratory spatial data analyses (ESDA) such as Moran’s I, univariate and bivariate local indicator of spatial correlation (LISA), and spatial regressions were used to assess the spatial clustering and risk factors of IMR in the high-focus states.
Access to toilet facilities, drinking water from a treated source, and availability of electricity were used as the proxy indicators of household amenities to examine their relationship with infant mortality. Variables such as birth interval, low birth weight, in-cidence of acute respiratory infection (ARI), and diarrhea are included in the analysis to control for the maternal/child confounders. In order to capture the effect of health-care utilization on infant survival, variables such as mothers who received three or more ante natal care (ANC), percentage of women who had a safe delivery, and those who received postnatal care are included. In most of the literature available in the pub-lic domain, the component of health facility has not been investigated while analyzing the risk factors for IMR. In this study, health facility variables such as 24-h fully func-tioning primary health centers (PHCs), distance to the district hospital, population cov-ered by a PHC, and 24-h operation theater (OT) have also been incorporated.
Methods
Computation of spatial autocorrelation index
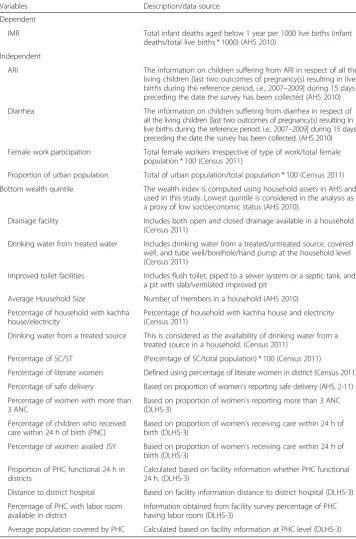
The computation of spatial autocorrelation requires construction of a matrix known as spatial weight matrix (W) to quantify the spatial proximity between each possible pair of observational units. The matrix can be constructed in different ways depending on the definition of the neighbor employed. The simplest way is to construct a binary Table 1Exposure variables used in spatial modeling the infant mortality in nine high-focus states in India, AHS (2010–2011) and DLHS-3 (2007–2008)
Variables Description/data source
Dependent
IMR Total infant deaths aged below 1 year per 1000 live births (infant deaths/total live births * 1000) (AHS 2010)
Independent
ARI The information on children suffering from ARI in respect of all the living children [last two outcomes of pregnancy(s) resulting in live births during the reference period, i.e., 2007–2009] during 15 days preceding the date the survey has been collected (AHS 2010) Diarrhea The information on children suffering from diarrhea in respect of
all the living children [last two outcomes of pregnancy(s) resulting in live births during the reference period, i.e., 2007–2009] during 15 days preceding the date the survey has been collected. (AHS 2010) Female work participation Total female workers irrespective of type of work/total female
population * 100 (Census 2011)
Proportion of urban population Total of urban population/total population * 100 (Census 2011) Bottom wealth quintile The wealth index is computed using household assets in AHS and
used in this study. Lowest quintile is considered in the analysis as a proxy of low socioeconomic status (AHS 2010).
Drainage facility Includes both open and closed drainage available in a household (Census 2011)
Drinking water from treated water Includes drinking water from a treated/untreated source, covered well, and tube well/borehole/hand pump at the household level (Census 2011)
Improved toilet facilities Includes flush toilet, piped to a sewer system or a septic tank, and a pit with slab/ventilated improved pit
Average Household Size Number of members in a household (AHS 2010) Percentage of household with kachha
house/electricity
Percentage of household with kachha house and electricity (Census 2011)
Drinking water from a treated source This is considered as the availability of drinking water from a treated source in a household. (Census 2011)
Percentage of SC/ST (Percentage of SC/total population) * 100 (Census 2011)
Percentage of literate women Defined using percentage of literate women in district (Census 2011) Percentage of safe delivery Based on proportion of women’s reporting safe delivery (AHS, 2-11) Percentage of women with more than
3 ANC
Based on proportion of women’s reporting more than 3 ANC (DLHS-3)
Percentage of children who received care within 24 h of birth (PNC)
Based on proportion of women’s receiving care within 24 h of birth (DLHS-3)
Percentage of women availed JSY Based on proportion of women’s receiving care within 24 h of birth (DLHS-3)
Proportion of PHC functional 24 h in districts
Calculated based on facility information whether PHC functional 24 h. (DLHS-3)
Distance to district hospital Based on facility information distance to district hospital (DLHS-3) Percentage of PHC with labor room
available in district
Information obtained from facility survey percentage of PHC having labor room (DLHS-3)
connectivity matrix. An element wij of a binary connectivity matrixW equals unity if districtjadjoins districti and equals zero in all the other cases. To observe the spatial clustering of infant mortality across districts, Moran’s I Index is computed to measure the extent of the autocorrelation among the neighborhood sections of society. Spatial analysis software, GeoDa 1.6.0, is used to compute Moran’s I statistic and to generate respective cluster maps (Anselin et al. 2006). The index used to observe spatial autocor-relation at the local level is Anselin’s LISA, which can be seen as the local equivalent of Moran’s I. For each location, LISA values allow for the computation of its similarity with its neighbors and also test its significance.
Five scenarios may emerge:
Locations with high values, with similar neighbors (high-high). Such locations are also known as“hot spots.”
Location with low values, with similar neighbors (low-low). These are also known as“cold spots.”
Locations with high values, but with low-value neighbors (high-low). These locations are referred to as potential“spatial outliers.”
Locations with low values, but with high-value neighbors (low-high). These are referred to as potential“spatial outliers.”
Locations with no significant local autocorrelation.
Bivariate LISA: spatial pattern in association between IMR and selected predictors
The purpose of bivariate LISA is to analyze the association of certain characteristics of districts with their IMR level. In this section, an attempt has been made to explore the association between IMR levels of the area with those of the average neighboring value of another variable. For this purpose, the percentage of women who received more than three ANC and had a safe delivery, percentage of households in the bottom wealth quintile, and percentage of women who availed of Janani Suraksha Yojana (JSY) fa-cilities are considered for the study of bivariate association.
Spatial risk factors of IMR
After confirming the presence of spatial autocorrelation in IMR across the high-focus districts, it is possible that such correlation in dependent variables may lead to cor-relation among the error terms rendering the ordinary least square (OLS) estimator inappropriate owing to violation of its underlying assumptions. Spatial regression technique is used to examine determinants of infant mortality.
Spatial regression
The“spatial effect”can be modeled in the following two ways:
Spatial lag model If the dependent variable,Y, is correlated with the weighted average of its value in its neighborhood and other locations, this relationship can be expressed as
Y ¼ρWYþβXþε
correct for heteroscedasticity (Anselin et al. 2006). The OLS would, therefore, provide biased and inconsistent estimates of the model parameters due to simultaneity bias.
Spatial error model If the spatial dependence enters the model through the error term,ε, we can have the spatial error model represented as
Y ¼βXþε
ε ¼λWþμ
Here, λ is the spatial autoregressive parameter and the error μ is the iid. Thus,
this is a special case of regression with a non-spherical error term and in which OLS, although unbiased, is inefficient. Therefore, here, the spatial regression takes
into account proximity among geographical units through the weight matrix W. Both
spatial error and spatial lag models are estimated by maximizing the corresponding likeli-hood functions discussed further by Anselin et al. (2006).
Descriptive findings and model result
The units of analysis are the districts. The results are entirely based on the aggregated district-level data. To display the spatial clustering of infant mortality, a series of maps were generated. Figure 1a is a quintile and Moran’s I plot of IMR across 284 high-focused districts of India for the year 2010–2011. The red color in the quintile map indicates high IMR, and subsequently, the light shades display low levels of IMRs. Moran’s I scatter plot of infant mortality shows the levels between each section and the average level of infant mortality of the contiguous section of the index sections. The quintile map demonstrates that areas in red are contiguous to each other, which suggests the clustering of a high level of infant mortality. It can also be seen that areas characterized by low IMR have a neighborhood with low IMR.
Thus, the four quadrants of the Moran scatter plot depict the section with high IMR (high-high) in a manner similar to the section characterized by low IMR sur-rounded by the section having low IMR (low-low) and the spatial outlier sections
as low-high and high-low. Overall, Global Moran’s spatial autocorrelation is 0.447
(p< 0.01, 999 permutations) implying moderate correlation but significant positive association with the levels of IMR in the high-focus districts. Therefore, there is a need to analyze spatial clustering at the local level to identify the areas with sig-nificant clustering of the values.
LISA maps for IMR of high-focus districts
Bivariate LISA statistic for IMR and selected predictors
The bivariate LISA map provides visual support for the view that spatially dependent socioeconomic factors played a key a role in the spatial clustering of infant mortality (Fig. 2a–c). The result indicated 3 districts of Orissa and 18 districts from Madhya Pra-desh were identified as hot spots where lack of utilization of ANC resulted in high IMR. The study identified 11 districts of Madhya Pradesh and 1 district of Rajasthan, where low percentage of safe delivery is associated with high infant death. Similarly, clustering was observed for two districts of Odisha and four districts each from Uttar Pradesh and Madhya Pradesh, where low utilization of JSY is associated with high in-fant mortality. Bivariate LISA also identified three districts in Rajasthan, four districts in Madhya Pradesh, and six districts in Uttar Pradesh as hot spots where higher per-centages of households in the bottom wealth quintile resulted in high IMR. (Figure not presented for wealth quintile).
Spatial regressions and diagnostics
After confirming that there is significant autocorrelation in IMR across the 284 districts of high-focus states, the dependence structure in response to the variable indicates the possibility of unbiased coefficients of IMR according to the different risk factors. Hence, the spatial effect has been modeled in two ways as discussed earlier by estimat-ing spatial lag as well as error model (Tables 2 and 3). The first panel shows the OLS estimates, and the second and third panels show estimates obtained using spatial error model and spatial lag model, respectively. We estimated five different models for each
Table 2Result of OLS model and spatial error model assessing determinants of IMR, High Focus States, 2010–2011
OLS Error
Characteristics HH Mother + child Healthcare Health facility All HH Mother + child Healthcare Health facility All
% urban household −0.033 −0.024 −0.076 −0.041
% household in lowest quintile 0.354*** 0.348*** 0.338*** 0.361***
Treated water −0.194** −0.286*** −0.236*** −0.300***
Average household size 4.286*** 2.496 5.382*** 2.964*
% household living in kachha house −0.049 0.004 −0.070 −0.035
Access to improved toilet facilities −0.001 −0.168*** 0.048 −0.172**
% household with access to electricity 0.023 0.004 0.025 0.006
% household with no drainage facility 0.067* 0.041 0.035 0.042
% of SC 0.582*** 0.359*** 0.524*** 0.376***
% of ST −0.011 −0.028 0.023 −0.002
% women with literacy −0.384*** −0.238* −0.265*** −0.177
% working women −0.005 0.039 0.033 0.070
% children with 3 years’birth interval −0.182* −0.032 −0.194* −0.004
% children with low birth weight 0.122 0.084 0.135* 0.081
% children suffered from diarrhea 0.146*** 0.006 0.089* 0.005
% children who had ARI 0.318*** 0.234* 0.247** 0.194**
% children breastfed within 1 h −0.079 −0.045 −0.082* −0.045
% safe delivery −0.275*** −0.211*** −0.196*** −0.173**
% women with 3+ ANC −0.107** −0.055 −0.152*** −0.080
% children who received care within 24 h of birth −0.372*** −0.444*** −0.357*** −0.407***
(2016) 72:2
Page
10
of
Table 2Result of OLS model and spatial error model assessing determinants of IMR, High Focus States, 2010–2011(Continued)
JSY 0.264*** 0.115*** 0.176*** 0.083**
24 h PHC −0.054 −0.007 −0.075* −0.003
Distance to DH −0.092 0.003 0.000 −0.003
Labor room available −0.059* −0.048* −0.012 −0.038
Pop PHC 0.000* 0.000* 0.039 0.000**
***p<0.01, **p<0.05, *p<0.10
(2016) 72:2
Page
11
of
of the spatial regression: model 1 has household characteristics and amenities, model 2 considered mother and child variables, model 3 has healthcare variables, model 4 has health facility variables in the analysis, and the last model incorporated all the variables. Considering significant autocorrelation in IMR, it can be inferred that the residuals of the OLS model are positively spatially correlated. Moreover, the study applied a diag-nostic test for spatial error and lag models, for example, Lagrange’s multiplier (LM) test for both the models. The study found that test statistics is significant. Coefficients of the terms capturing spatial effects, viz, λ in spatial error model and ρ in spatial lag model, are statistically significant. The positive value of λ and ρ indicates substantial spatial dependence in IMR across the neighboring districts (Table 4). It is also observed that the OLS model overestimates the coefficients; hence, the spatial error and lag models will be better for capturing the spatial effect in the model. Model 1 (household amenities), for both spatial error and lag models, indicates that the risk of infant death is lower for the districts with higher urban household (higher levels of urbanization), which is consistent with the findings of the earlier studies (Saikia et al. 2013) discussing urban-rural mortality divide. Similarly, we have found that districts with the higher Table 3Result of Spatial Lag model assessing determinants of IMR, High Focus States, 2010–2011
Lag
Characteristics HH Mother + child Healthcare Health facility All
% urban household −0.069 −0.051
% household in lowest quintile 0.337*** 0.346***
Treated water −0.180** −0.283***
Average household size 4.114*** 2.555
% household living in kachha house −0.054 −0.002
Access to improved toilets facility 0.019 −0.180**
% household with access to electricity 0.027 0.017
% household with no drainage facility 0.069 0.041
% of SC 0.580*** 0.366***
% of ST 0.002 −0.019
% women with effective literacy −0.371*** −0.250**
% working women −0.024 0.024
% children with 3 years’birth interval 0.196** −0.009
% children with low birth weight 0.145* 0.098
% children suffered from diarrhea 0.139*** 0.007
% children who had ARI 0.268*** 0.201**
% children breastfed within 1 h −0.054 −0.023
% safe delivery 0.128 −0.207***
% women with 3+ ANC −0.115 −0.053
% children who received care within 24 h of birth
0.300*** 0.431***
JSY −0.061 0.097**
24 h functioning of PHC −0.088* −0.066
Distance to DH 0.000* 0.001
Labor room available −0.048 −0.041*
Population covered by PHC 0.044* 0.000
proportion of households in the bottom wealth quintile were characterized by high IMR for both spatial regression models. Our analysis indicated that the district with a higher proportion of kachha houses and unavailability of toilet facilities has a higher IMR level, while the availability of treated water in the household was found to be negatively associated with the IMR. The subsequent model (model 2) integrated women-and child-level variables such as percentages of literate women-and working women, percentage of children with 3 years’birth interval, percentages of children with low birth weight, and per-centage of children with ARI/diarrhea. The result suggests that female literacy have signifi-cant and negative association with IMR in both spatial models. It is also found that districts with a higher percentage of children suffered from diarrhea and those with a percentage of children breastfed within 1 h of birth have lower IMR. In model 3, the finding from both models indicated that the district with a higher proportion of literate women, percentage of women with 3+ ANC, and percentage of women who had safe delivery was negatively asso-ciated with IMR. In model 4, the IMR was modeled with health infrastructure variables. The result shows that variables such as the 24-h functioning of PHC and the availability of a labor room in the PHC in districts are also associated with the infant mortality to a certain extent. Model 5 included all the predictor variables, and the result shows that the associ-ation between maternal educassoci-ation, average household size, and IMR is significant. They have negative effect on infant mortality. Overall, we found that other household-level factors such as drinking water from treated source, access to toilet facility, electricity, proportion of SC/ST; maternal characteristics such as women with 3+ ANC and women who had safe de-livery; and child-level characteristics such as percentage of children affected from diarrhea and percentage of children breastfed within the first hour of birth have statistically signifi-cant relationship with IMR. The results based on the facility model show that variables such as the 24-h functioning PHC and the availability of a labor room in the PHC in districts are associated with the infant mortality for both the spatial models.
Discussions
Despite the progress towards improving the pace of decline in infant mortality in these nine high-focus states during last four decades, India is sure to fall short of the child mortality-related Millennium Development Goal (Reddy 2012). Most of the research has highlighted the importance of maternal-, child-, and community-level variables as the factors that contribute to the slow decline of infant mortality. However, there are no studies that have used a comprehensive set of models based on potential household amenities, mother and child variables, and healthcare and health facility factors using exploratory spatial data analysis. This omission is related to the paucity of district-level Table 4Spatial dependence and diagnostic analysis
Diagnostics test OLS model Spatial error model Spatial lag model
AdjustedR-squared 0.428
Lagrange multiplier (lag) 10.071 Lagrange multiplier (error) 6.484
Λ 0.201
ρ 0.074
AIC 2194.711 2186.224 2186.521
information on socioeconomic and mortality indicators as well as the complexity in-volved in the spatial analysis. Spatial analyses are important for policy intervention at the district level as it explains intra-district variation more appropriately than by indi-vidual-, maternal-, or household-level factors. This paper assesses the significance of spatial clusters and risk factors in explaining the regional variation in IMR. However, there has been few attempts to analyze the association between spatial factors and child health indicators emphasizing change in contextual factors such as environmental co-variates (Kumar et al. 2012) or spatial correlates (Singh et al. 2011). The novelty of the attempt is to render reasonable explanations of spatial clustering and risk factors of IMR by joining health and location data in the nine high-focus states.
The observed spatial pattern leads to computation of the strength of spatial cluster-ing of infant mortality across the high-focus states of India. The significant positive Moran’s I spatial correlation index of infant mortality suggests that similar traits (high/low mortality zone) are concentrated at some specific areal pockets not uni-form over the whole high-focus states. The local indicator of spatial association (LISA) statistic identifies the district from the central and eastern regions (Orissa, Madhya Pradesh, Rajasthan, Bihar, and Uttar Pradesh) as the hot spot (having high in-fant death surrounded by high-value neighbors) and few districts of Jharkhand and Uttarakhand as the cold spot (low-low clustering). The bivariate LISA suggests that there are certain sections (districts) in the central and eastern regions of India that in-dicate the association of the selected predictor and IMR.
The analysis pointed out that the OLS model overestimated the coefficients of the
model with lower R-square values. Hence, the spatial error and lag models were used
According to the Wilkinson income hypothesis (Wilkinson 1997), income inequality has deterrent effect on health outcome and it has been overlooked in analyzing regional vari-ation in IMR in India. Wealth quintiles constructed on the basis of assets owned by house-holds are a close approximation to income (Filmer and Pritchett 1999; Vyas and Kumaranayake 2006). Analyzing the effect of the proportion of households in the bottom wealth quintile on district IMR allows testing of Wilkinson’s hypothesis. The finding that the higher the proportion of households in the bottom wealth quintile the higher is the IMR is a confirmation of this hypothesis and agrees with that of similar results (Shi 1999; Wilkinson 1992, 1999; Filmer and Pritchett 1999). The findings from spatial regression also confirm the positive association between percent of the household in the bottom wealth quintile and IMR. Intervention to increase access to livelihood can pave the way for redu-cing income inequality and reduce IMR. Factors related to pre- and postnatal care, e.g., ANC, safe delivery, PNC, and variables related to personal illness control such as recent episodes of ARI and diarrhea among children have statistically significant association with infant mortality, which is in concordance with other studies in India (Gokhale et al. 2002; Gouda et al. 2015). Interestingly, analysis reveals that labor force participation, birth weight, and birth interval were not associated with IMR in the spatial lag as well as error models.
This analysis further brings out that regional inequality of infant death within India is a major area of concern. The central region comprising Madhya Pradesh and Uttar Pra-desh is the poorest in terms of infant deaths. One of the vital contributions of this study to existing literature is that the analysis has considered the health infrastructure variable as a crucial determinant of IMR. This study concluded that the increase in the population burden on PHCs has reduced the chances of survival; likewise, infrastruc-ture in terms of manpower and newborn-care facility were significantly associated with survival of the infant. The results highlight that the well-functioning of PHCs especially the emergency obstetric care (labor room availability) matters in reducing infant deaths, particularly in the high-focus states.
Conclusions
goals in India would be a realistic target, when concerted interventions are made to minimize barriers at the district level particularly in these nine high-focus states.
Endnotes 1
http://www.censusindia.gov.in/vital_statistics/AHSBulletins/AHS_Factsheets_2011_ 12.html.
Appendix
Competing interests
The authors declare that they have no competing interests.
Authors’contributions
AKG and LL contributed in conceptualizing the study. AKG and KB were responsible for the statistical analysis. All authors contributed to the interpretation of the data, and critically revised all versions of the manuscript and approved the final version.
Author details 1
International Institute for Population Sciences (IIPS), Mumbai, India.2Department of Mathematical Demography and Statistics, International Institute for Population Sciences (IIPS), Mumbai, India.
Received: 22 June 2015 Accepted: 8 March 2016
References
Adlakha, A. (1973). Fertility and infant mortality—an analysis of Turkish data.Demography India, 2(1), 56–76. Anselin, L., Syabri, I., & Kho, Y. (2006). GeoDa: an introduction to spatial data analysis.Geographical Analysis, 38(1), 5–22. Balk, D., Pullum, T., Storeygard, A., Greenwell, F., & Neuwman, M. (2004). A spatial analysis of child mortality in West
Africa.Population, Space and Place, 10(3), 175–216.
Bhattacharya, P. C., & Cornilius, C. (2011). Inequalities in child mortality in India.Asian Population Studies, 7(3), 243–261. Cai, L., & Chongsuvivatwong, V. (2006). Rural-urban differentials of premature mortality burden in south-west China.
International Journal for Equity in Health, 5, 13–21.
Cleland, J., Bicego, J., & Fegan, G. (1992). Socioeconomic inequalities in childhood mortality: the 1970s to the 1980s. Health Transition Review, 2(1), 1–18.
Curtis, S. L., Diamond I., & McDonald J.W. (1993). Birth Interval and Family Effects on Post Neonatal Mortality in Brazil. Demography, 30(1), 33–43. doi:10.2307/20611861.
Cutis, S., & Rees, I. J. (1998). Is there a place for geography in the analysis of health inequality?Sociology of Health and Illness, 20(5), 645–672.
Dasgupta, M. (1990). Death clustering, mother’s education and the determinants of child mortality in Rural Punjab, India.Population Studies, 44(3), 489–505.
Diez, R. A. V. (2001). Investigating neighborhood and area effect on health.American Journal of Public Health, 91(11), 1783–1789.
Dyson, T. (1977). Levels, trends and differentials of child mortality- A survey.World Health Statistics Report. 30(4), 25–48. Filmer, D., & Pritchett, L. (1999). The impact of public spending on health: does money matter?Social Science &
Medicine, 19(11), 1309–1323.
Table 5Sample size of annual health survey by states
State Districts Sample units
T R U
Assam 23 1784 1412 372
Bihar 37 2356 1981 375
Jharkhand 18 2109 1514 595
Madhya Pradesh 45 2557 1660 897
Chhattisgarh 16 1255 926 329
Orissa 30 2364 1798 566
Rajasthan 32 1841 1294 547
Uttar Pradesh 70 3927 2782 1145
Uttarakhand 13 2059 1474 585
Gokhale, M. K., Rao, S. S., & Garole, V. R. (2002). Infant mortality in India: use of maternal and child health services in relation to literacy status.Journal of Health, Population and Nutrition, 20(2), 138–147.
Goli, S., & Jaleel, A. C. (2014). What is the cause of the decline in maternal mortality in India? Evidence from time series and cross-sectional analyses.Journal of Biosocial Science, 46(3), 351–365.
Gouda, J., Gupta, A. K., & Yadav, A. K. (2015). Association of child health and household amenities in high focus states in India: a district-level analysis.BMJ open, 5, e007589. doi.org/10.1136/bmjopen-2015-007589.
Gubhaju, B. B. (1985). Effects of birth order and maternal age on infant and child mortality in rural Nepal.Biology and Society, 2(1), 15–22.
Hobcraft, J. N., Mcdonald, J. W., & Rutstein, S. O. (1984). Socio-economic factors in infant and child mortality: a cross-national comparison.Population Studies, 38(2), 193–223.
Hussain, Z. (2011). Health of the national rural health mission.Economic & Political Weekly, 46(4), 53–60.
James, K. S. (2014). Recent shifts in infant mortality in India: an exploration.Economic and Political Weekly, 49(3), 14–17. Kravdal, O. (2004). Child mortality in India: the community-level effect of education.Population Studies, 58(2), 177–192. Kumar, C., Singh, P. K., & Rai, R. K. (2012). Under-five mortality in high focus states in India: a district level geospatial
analysis.PLoS ONE, 7(5), e37515. http://doi.org/10.1371/journal.pone.0037515.
Ladusingh, L., & Singh, C. H. (2006). Place, community education, gender and child mortality in northeast India. Population, Space and Place, 12(1), 65–76.
Levine, R. A., & Rowe, M. L. (2009). Maternal literacy and child health in less-developed countries: evidence, processes, and limitations.Journal of Developmental and Behavioral Pediatrics, 30(4), 340–349.
Mosley, W. H., & Chen, L. C. (1984). An analytical framework for the study of child survival in developing countries. Population and Development Review, 10, 25–45.
Pradha, J., & Arokiasamy, P. (2006). High infant and child mortality rates in Orissa: an assessment of major reasons. Population, Space and Place, 12(3), 187–200.
Programme Evaluation Organization. (2011). Evaluation study of National Rural Health Mission in 7 states planning commission. Government of India.
Reddy, H., Pradhan M.R., Ghosh, R., et al. (2012). India’s progress towards the Millennium Development Goals 4 and 5 on infant and maternal mortality, WHO South East Asia J Public Health, 1, 279–89.
Registrar General of India (2012). Annual Health Survey 2010-2011, Ministry of Home Affairs, Government of India, New Delhi. http://www.censusindia.gov.in/Common/AHSurvey.html Accessed 2 January 2015.
Registrar General of India and Census commissioner Census of India. (2011).Provisional population totals series 2011. New Delhi: Ministry of Home Affairs, Government of India.
Registrar General of India. (2014). SRS bulletin. Sample Registration System. September, 49(1).
Reichman, N. E., & Pagnini D. L., (1997). Maternal age and birth outcomes: data from New Jersey.Family Planning Perspectives, 29(6), 268–272 & 295.
Rodrigues, M., Bonfim, C., Gomes, I., Gurgel, D., & Medeiros, Z. (2013). Using spatial analysis to identify areas vulnerable to infant mortality.Revista Panamericana de Salud Pública, 34(1), 36–40.
Rodwin, V. G., & Neuberg, L. G. (2005). Infant mortality and income in 4 world cities: New York, London, Paris, and Tokyo.American Journal of Public Health, 95(1), 86–90.
Saikia, N., Singh, A., Jasilionis, D., & Ram, F. (2013). Explaining the rural-urban gap in infant mortality in India. Demographic Research, 29, 473–506.
Sastry, N. (1997). Family-level clustering of childhood mortality risk in Northeast Brazil.Population Studies, 51(3), 245–261. Shi, L., Starfield, B., Kennedy, B., Kawachi, I. (1999). Income inequality, primary care and health indicators.The Journal of
Family Practice. 48(4), 275–284.
Singh, A., Pathak, P. K., Chauhan, R. K., & Pan, W. (2011). Infant and child mortality in India in the last two decades: a geospatial analysis.PLoS ONE, 6(11), e26856. http://doi.org/10.1371/journal.pone.0026856.
Singh, P.K., Kumar, C., Rai, R.K., Singh, L. (2013). Factors associated with maternal healthcare services utilization in nine high focus states in India: a multilevel analysis based on 14,385 communities in 292 districts.Plos One. http://doi.org/10.1093/heapol/czt039.
Stockel, J & Chaudhury, K.M. (1972). Neonatal and post neonatal mortality in rural areas of Bangladesh.Population Studies, 26, 113–120.
Syamala, T. S. (2004). Relationship between socio demographic factors and child survival: evidences from Goa, India. Journal of Human Ecology, 16, 141–145.
Taylor, L. (1975). Poverty, wealth and health or getting the dosage right.British Medical Journal, 4, 207–211. Vyas, S., & Kumaranayake, L. (2006). Constructing socio-economic status indices how to use principal component
analysis.Health Policy and Planning, 21, 459–468.
Wilkinson, R. G. (1992). Income distribution and life expectancy.British Medical Journal, 304(18), 165–168.