Mix Design and Properties of Recycled Aggregate Concretes:
Applicability of Eurocode 2
George Wardeh*, Elhem Ghorbel, and Hector Gomart
(Received May 23, 2014, Accepted July 24, 2014, Published online August 26, 2014)
Abstract: This work is devoted to the study of fresh and hardened properties of concrete containing recycled gravel. Four formulations were studied, the concrete of reference and three concretes containing recycled gravel with 30, 65 and 100 % replacement ratios. All materials were formulated on the basis of S4 class of flowability and a target C35 class of compressive strength according to the standard EN 206-1. The paper first presents the mix design method which was based on the optimization of cementitious paste and granular skeleton, then discusses experimental results. The results show that the elastic modulus and the tensile strength decrease while the peak strain in compression increases. Correlation with the water porosity is also established. The validity of analytical expressions proposed by Eurocode 2 is also discussed. The obtained results, together with results from the literature, show that these relationships do not predict adequately the mechanical properties as well as the stress–strain curve of tested materials. New expressions were established to predict the elastic modulus and the peak strain from the compressive strength of natural concrete. It was found that the proposed relationshipE–fcis applicable for any type of concrete while the effect of
substitution has to be introduced into the stress–strain (ec1–fc) relationship for recycled aggregate concrete. For the full stress–strain
curve, the model of Carreira and Chu seems more adequate.
Keywords:recycled aggregate concrete, mix design method, mechanical properties, Eurocode 2.
1. Introduction
Aggregates consumption does not cease to grow in France. According to the UNPG (French national union of aggregates producers) and the UNICEM (French national union of indus-tries of careers and building materials) aggregate production is estimated at 431 million tons in 2008, of which 79 % is used in civil engineering field and 21 % for building industry. In addi-tion, 5 % of this amount is produced by recycling demolition wastes. Although this percentage remains low, recycling helps to limit the environmental impact by limiting the exploitation of natural resources. These socio-economic issues are the driving forces promoting the recycled aggregates in concrete.
The valorization of recycled aggregates in concrete is not recent and many studies have shown that material made with recycled aggregates may have mechanical properties similar to those of a conventional concrete mixed with natural aggregates (Etxeberria et al.2007; Evangelista and de Brito2007; Li2008; McNeil and Kang 2013). However, recycled aggregates are characterized by a high water absorption capacity related to the presence of old mortar attached to the surface of aggregates which hinders their wide use (Gomez-Soberon2002; de Juan
and Gutirrez2009). The water absorption capacity affects both fresh and hardened states properties. At fresh state, the mix design of concrete with recycled aggregates requires an addi-tional quantity of water to obtain a similar workability as a concrete formulated with natural aggregates (Hansen and Bo-egh 1986). Such a modification may obviously affect the mechanical characteristics of recycled aggregates concrete. Several studies have investigated the microstructure of recycled aggregates concrete and showed that the porosity is modified and increases with the replacement ratio (Gomez-Soberon 2002). It is also acknowledged that the high porosity of recycled concrete leads a reduction of the mechanical strengths (Gomez-Soberon2002; Kou et al.2011). Furthermore, several studies have shown however that mechanical properties of concrete made with recycled aggregates depend on other parameters such as the quality of concrete from which recycled aggregates are obtained (Xiao et al.2005; Casuccio et al.2008) as well as the replacement ratio (Bele´n et al.2011).
The main goal of this work is to determine the properties of recycled aggregate concretes (RAC) at fresh and hardened states depending on replacement ratio. A concrete made with natural aggregate (NAC), designed for control operations, and three RAC with a S4 class of workability and com-pressive strength levels near to 35 MPa were formulated and tested. The present study also examines the applicability of relationships of Eurocode 2 (EC2) to concretes made from recycled aggregates. These relationships estimate the mod-ulus of elasticity, the peak strain and stress–strain relation-ship from the simple knowledge of the compressive strength.
University of Cergy-Pontoise, Neuville-sur-Oise 95031, France.
*Corresponding Author; E-mail: george.wardeh@u-cergy.fr CopyrightÓThe Author(s) 2014. This article is published with open access at Springerlink.com
International Journal of Concrete Structures and Materials Vol.9, No.1, pp.1–20, March 2015
2. Materials
2.1 CementCEM I CALCIA 52.5 N CE CP2 NF cement in confor-mity with the standard EN 197-2 was used in all concrete mixes. The chemical and mineralogical compositions cal-culated by the method of Bogue are presented in Table1. The density of this cement is 3.11, its Blaine surface is 395 (m2/kg) and its compressive strength after 2 days is 31.7 (MPa).
2.2 Aggregates
The fine aggregates are 0/4 mm silico-calcareos rolled sand. For all mix designs, two size fractions of coarse natural crushed silico-calcareos aggregates were used. The particles size of the first fraction, called G1, is comprised between 5
and 10 mm while it is comprised between 10 and 20 mm for the second type G2. Recycled aggregates were delivered in
big bags from a retreatment platform of demolition materi-als. They were sieved in the laboratory into three fractions GR1 (4/10 mm), GR2 (10/20 mm) and sand (0/5 mm). In
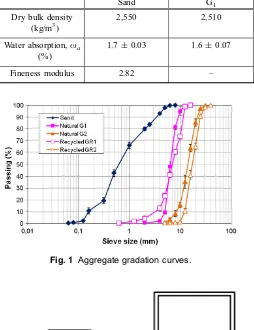
this study only the coarse recycled aggregates were used. They were dried in an oven at 110±5°C and then stocked in closed containers until the moment of concrete manu-facture. The main properties of the natural and recycled aggregates are presented in Table2 and the grading curves are plotted in Fig.1. It is seen that the size grading of the coarse natural and recycled gravel was similar with a larger amount of small particles for GR1.
Water absorption has been characterized first, according to the standard NF EN 1097-6 at the atmospheric pressure. Dried aggregates were immersed in water during 24 h then dried again in an oven at a temperature of 110±5°C. It can be noticed in Table2 that recycled aggregates have a sig-nificant higher water absorption capacity and a lower density than natural ones. In spite of the high water absorption capacity of the used RCA, it remains within the range rec-ommended by the design standards (McNeil and Kang2013; Kang et al.2014).
The kinetic of water absorption of recycled aggregates GR1and GR2was also followed and the water uptake was
measured by hydrostatic weighting. Aggregates samples were washed first on the sieve of 4 mm and dried in an oven at a temperature of 110±5°C until mass stabilization. After drying the tested sample was placed between two stainless sieves (of diameter 15 cm and height 7 cm) for hydro-static weighing. The system was hung to a balance of 0.01 g accuracy with a non-elastic wire and the mass vari-ation is continuously recorded. The room temperature is equal to 22°C. Figure 2illustrates the measurement system. The water absorption was calculated according to the following equation:
xa¼
MwaMws Ms
100; ð1Þ
where Mwa is the mass of saturated aggregates in water at
timet,Mwsis the mass of dried aggregates in water att0, and Msis the mass of dried aggregates in air. Thet0indicates the
beginning of the test.
Figure3 shows the evolution of water absorption versus time. At t=24 h, water absorption of GR1 and GR2 are
respectively equal to 8.3 and 6.5 %. These results corre-spond to the values obtained following NF EN 1097-6 standard (cf. Table2). Results show also that recycled aggregates are saturated after a ‘‘long time’’ more than 24 h, according to several studies (Tam et al.2008; Djerbi Tegguer 2012). Att=24 h, water absorption represents only 82 and 85 % of total degree of saturation for GR1 and GR2,
respectively. Finally, aggregates reach a water absorption of 10 and 7.8 % for GR1and GR2, respectively. At the
oppo-site, for short time relative to mixing time (5 min), the kinetic of absorption is fast.
2.3 Superplasticizer
The used Superplasticizer is Cimfluid 3002 produced by Axim Italcementi group with a solid content of 30 %. It is a new generation product based on chains of modified poly-carboxylate certified in conformity with the standard EN 934-2 and considered as a water reducing admixture.
3. Mix Method and Concrete Proportions
All mixtures were formulated on the basis of the following specifications:
– only coarse natural aggregates are replaced by recycled ones with three volumetric replacement ratios 30, 65 and 100 %;
– the granular skeleton is constituted of a ternary mixture of sand and two gravels G1 (4/10 mm) and G2 (10/
20 mm);
– at fresh state, all concretes are of S4 workability class where the target slump with the Abrams’s cone is 18±1 cm. According to the standard NF EN 206-1 the slump for a S4 flowability is comprised between 16 and 21 cm;
– at hardened state a compressive strength comprised between 35 and 43 MPa must be guaranteed at the age of 28 days;
– concretes are designated for XF2 class of environmental exposure according to the standard NF EN 206-1, where water to cement ratio (W/C) is lower than or equal 0.5 and the minimum cement content is higher than 300 kg/m3.
Table 1 Chemical and mineralogical compositions of the used cement in %.
SiO2 Al2O3 Fe2O3 CaOtotal MgO SO3 K2O Na2O C3S C2S C3A C4AF
19.8 5.14 2.3 64.9 0.9 3.4 1.1 0.005 58 13 10 6.99
A total of four concretes were then produced, a mix with natural aggregates called (NAC) and three concretes with recycled aggregates named RAC30, RAC65 and RAC100. The numbers indicate the rate of substitution. For NAC the cement content is taken equal to 360 kg/m3according to the standard NF EN 206-1 while for the other mixes this content was modified as will be explained below.
3.1 Optimization of Water to Cement Ratio The quantity of water for the cement was determined based on the flowability requirement by means of spread tests with the mini flow cone for which dimensions are 8 cm for lower diameter, 7 cm for upper diameter and 4 cm for the height (Fig.4).
For various water/cement ratios the slump dm and the
relative slump Cm are computed using the following
equation:
dm¼ d1þd2
2 ; Cm¼ d2
md02 d2
0
; ð2Þ
whered0is the lower diameter of the cone,dmis the average
of two wafer diameters d1 and d2. In Fig.4 the relative
slump Cm is depicted against the water to cement ratio,
where a straight line fits the experimental results with a correlation ratio R2=0.99. The relative slump Cm=5
yields the water content necessary for a flowable paste (El-Hilali2009).
3.2 Optimization of Solid Skeleton
Granular skeleton was optimized by the method of com-paction using vibration. The study started by measuring the packing density of each component, i.e. sand, natural gravels G1, G2and recycled gravels GR1, GR2. Binary mixtures of
Table 2 Physical properties of used aggregates.
Sand G1 G2 GR1 GR2
Dry bulk density (kg/m3)
2,550 2,510 2,510 2,240 2,240
Water absorption,xa
(%)
1.7±0.03 1.6±0.07 1.8±0.05 8.2±0.5 6.5±0.4
Fineness modulus 2.82 – – – –
Fig. 1 Aggregate gradation curves.
Fig. 2 Water absorption measurement system.
gravel were then tested to determine optimal dosages which give the densest packing. Finally ternary mixtures were tested to optimize the solid skeleton for all mixes.
Packing tests were conducted according to the test method No. 61 of LCPC (Le´de´e et al. 2004). To determine the packing density of a given granular fraction, a sample is poured in 16932 cm2cylindrical mold then vibrated while applying a pressure of 10 kPa. The packing density is cal-culated by the equation:
C¼Hf
Hi; ð3Þ
where Hf is the sample height after vibration and Hi the
height before vibration. The results for components are summarized in Table3 where each value is the average of three measurements. From this table it can be noticed that the packing density of recycled aggregates is lower than that of natural aggregates due to the presence of old cement paste.
Optimal proportions of granular mixtures are reported in Table4 where an increase in the sand content can be observed for recycled aggregates to assess the highest packing. This increase is due mainly to the lower density and lower packing ability of recycled aggregates.
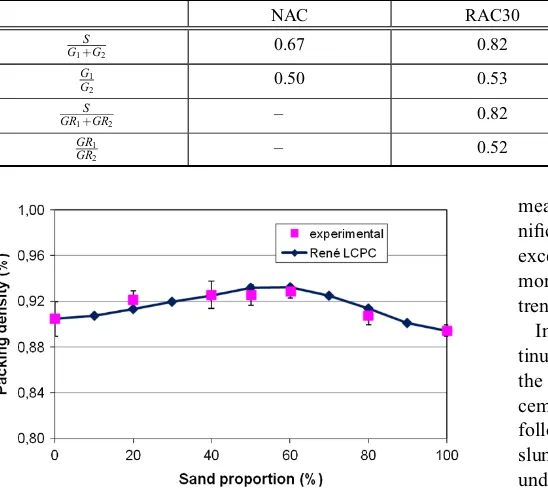
Values of Table4 were obtained by conducting packing tests on each mixture with several proportions. The curve representing the variation of packing density as a function of proportions was then plotted. The chosen optimal dosage is the point which corresponds to the maximum of the curve as shown in Fig.5for the ternary mixture of sand with recycled aggregates. For concretes RAC30, RAC65 the solid skeleton was first optimized where 30 and 65 % coarse natural aggregates were replaced by recycled aggregates GR1 and
GR2 and the packing tests were conducted. The results
showed that proportions sand to aggregates remain the same as for the mixture sand with recycled aggregates.
In order to corroborate the obtained experimental results, the software RENE LCPC was used (Sedran 1999). The software is able, from packing density and the size distri-bution curves of aggregates, to predict the packing density of a mixture. The results, plotted on Fig.4, show that theo-retical results are in tune with the experimental results.
3.3 Mix Proportions of all Components
Recycled aggregates have not been pre-saturated and the amount of absorbed water was added to the mixing water. Moreover, since the amount of water is important, an addi-tional quantity of cement was added such that the ratio of total water to cement remains constant. For NAC, the dosage of superplasticizer was gradually increased until the target slump was obtained. This dosage has not been modified for
the other formulations because water initially added to mixes had allowed to obtain the slump 18±1 cm.
Table5, containing the mixes, shows that the adopted approach leads to an increase in paste volume with a slight decrease in density. In this table, the effective water,Weff, is
defined according to the standard EN 206-1 as the total water quantity,Wtot, minus the water absorbed by aggregatesWeff ¼ WtotxaMgwhereMgis the weight of dry aggregates.
Cylindrical 16932 cm2 specimens were prepared to determine the compressive strength, elastic modulus and splitting tensile strength. Furthermore plain and prenotched 10910940 cm3prismatic specimens were cast to deter-mine the flexural strength of studied concretes. After being removed from the mold, they were cured in a water tank at room temperature for 28 days.
3.4 Test Methods
Uniaxial compression and tensile splitting tests were per-formed using a servo-hydraulic INSTRON machine with a capacity of 3,500 kN by imposing a stress increment rate of 0.5 MPa/s. Each test was repeated at least three times and results shown below are the averages of obtained values. In addition one cylinder of each material was instrumented with two strain gauges in order to determine the elastic modulus, and test were performed by imposing a strain rate of 1 mm/ min. Bending tests were performed using a 250 kN closed loop INSTRON machine with a strain rate of 1 mm/min. Finally, splitting strength was measured using the Brazilian test and dynamic modulus of elasticity was determined using E-Meter MK II device.
Water porosity was determined using the vacuum saturation method. The test includes two stages, the first consists on submitting 10910910 cm specimens, dried at 60±5°C, to vacuum (about 80 mbar) during 3 h. After this period and in a second stage, specimens are immersed in water during 5 days. The water absorption, called water porosity, is deter-mined as follows:
WA¼
WsatWdry WsatWwat
100; ð4Þ
withWsat is the weight of the saturated sample,Wdryis the
weight of the dry sample,Wwatis the weight of the saturated
sample immersed in water.
4. Test Results
4.1 Properties of the Fresh Concretes
The results of workability tests and air content are given in Table6 where it can be seen that all mixtures compile with the required workability. It can be concluded that the air
Table 3 Packing densities of used aggregates.
Sand Natural aggregates Recycled aggregates
G1 G2 GR1 GR2
Packing density 0.894±0.027 0.885±0.002 0.886±0.001 0.866±0.002 0.875±0.011
content of RAC is higher than concrete made with NA when the replacement ratio exceeds 30 %.
The slump loss during 2 h is plotted in Fig.6 for all studied materials where the slump values are averages of two
measurements. During the first 20 min, the loss is not sig-nificant for RAC65 and RAC100 and this is explained by the excess of available water in the mix. After 20 min the loss is more pronounced when the replacement ratio is higher. This trend was also observed by Poon et al. (2011).
In order to verify if the accentuation is due to the con-tinuous water absorption by recycled aggregates and not to the increase in paste volume, the loss in workability of two cement pastes corresponding to NAC and RAC100 was followed during 2 h. Figure7 shows the changes of paste slumps with time where it can be seen that the two pastes undergo the same kinetic of loss.
4.2 Properties of the Hardened Concrete Specimens
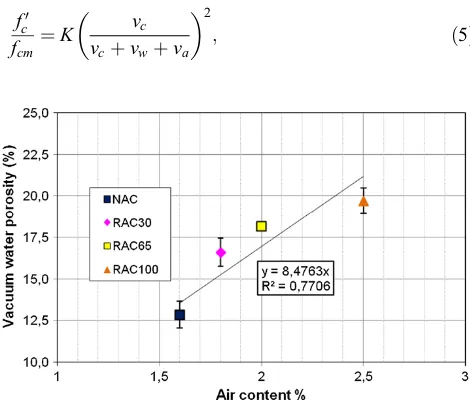
4.2.1 Water Porosity
Figure8presents the water porosities, measured at atmo-spheric pressure and under vacuum conditions, for all
Table 4 Volumetric optimal proportions of mixes.
NAC RAC30 RAC65 RAC100
S
G1þG2 0.67 0.82 1.51 –
G1
G2 0.50 0.53 0.67 –
S
GR1þGR2 – 0.82 1.51 1.50
GR1
GR2 – 0.52 0.67 0.67
Fig. 5 Packing density of ternary mixture S?GR1?GR2.
Table 5 Mix proportions for 1 m3.
NAC RAC30 RAC65 RAC100
Cement (kg/m3) 360 360 427 448
Effective water,Weff (kg/m3)
180 180 180 180
Additional water,wa
(kg/m3)
– 10 42 53
Sand (kg/m3) 703 780 957 930
Natural aggregates G1 (4/10 mm)
(kg/m3)
346 227 88 –
Natural aggregates G2 (10/20 mm) (kg/m3)
692 429 131 –
Recycled aggregates GR1 (4/10 mm) (kg/m3)
– 86 145 218
Recycled aggregates GR2 (10/20 mm) (kg/m3)
– 164 218 326
Superplasticizer (kg/m3) 1.25 1.25 1.25 1.25
Effective water/cement (Weff/C)
0.50 0.50 0.42 0.40
Total water/cement (W/C) 0.50 0.52 0.52 0.52
Paste volume (%) 29.6 30.6 36.0 37.8
Theoretical density (kg/m3) 2,280 2,236 2,188 2,155
Experimental density (kg/m3)
concrete mixes. It can be pointed out that both porosities increase with replacement ratio. These results are in agree-ment with the results of the literature where the porosity increases with substitution rate (Gomez-Soberon2002; Belin et al.2013). It can be also shown that the ratio between the porosity measured under vacuum and the porosity measured at atmospheric pressure is constant and equal to 1.16.
The increase of porosity with replacement ratio is mainly due to the high porosity of recycled aggregates, to the increase in the paste volume and to the poor interface paste-aggregates as well as to the increase in air content (cf. Fig.9).
4.2.2 Compressive Strength
Figure10shows compressive strength results at 7, 14, 21 and 28 days for the four concretes produced in this work. As illustrated in this figure, comparable strengths were obtained for all concretes with a decrease of 13 % for the concrete
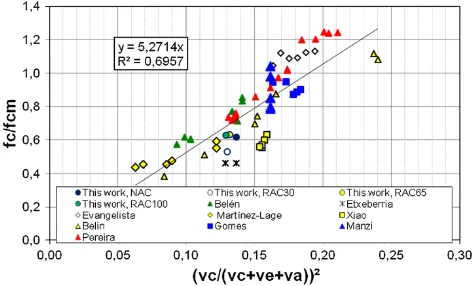
RAC30. This strength loss is due to recycled aggregates and to the increase in the total water quantity without correcting the cement content. For substitution ratio higher than 30 %, two phenomena are in competition: increasing the cement content and the replacement ratio of recycled aggregates which contribute to the increase of strength in the first case and the decrease in the second. However, the materials sat-isfy correctly the imposed specifications given in part 3 i.e. S4 flowability and 35 MPa compressive strength concretes. Compressive strength results were compared to the Fe´ret strength equation with 54 results found in references (Xiao et al.2006; Etxeberria et al.2007; Evangelista and de Brito 2007; Gomes and Brito2009; Bele´n et al.2011; Martinez-Lage et al.2012; Pereira et al.2012; Manzi et al.2013). The Fe´ret strength equation is:
fc0 fcm
¼K vc
vcþvwþva
2
; ð5Þ
Table 6 Properties of fresh concrete mixes.
Mix Slump (cm) Air content (%)
NAC 18±0.7 1.6±0.3
RAC30 19.3±1.5 1.8±0.1
RAC65 18.5±1.0 2.0±0.2
RAC100 20±1.4 2.5±0.2
Fig. 6 Slump loss of concrete mixes with time.
Fig. 7 Slump loss of cement pastes with time.
Fig. 8 Water porosities measured at atmospheric pressure and under vacuum.
Fig. 9 Relationship between air content and water porosity.
where K is the Fe´ret coefficient which depends on mix design and age, fc0 is the compressive strength of concrete (MPa),fcmis the normal compressive strength of cement,vc
is cement content in concrete (m3/m3),vwis the water
con-tent in concrete (m3/m3) andvais the air content in concrete
(m3/m3).
TheKvalue was evaluated based on the both natural and recycled aggregates concretes compressive strength (cf. Figure11). It is found that a value of 5.27 fits adequately the experimental results with a correlation factor R2=0.7. The obtained value is close to the theoretical value of K=5 found in the literature (Julio et al.2006; Hacene et al.2009). Fe´ret’s equation can therefore help to explain the obtained compressive strengths for RAC65 and RAC100. Indeed, at a constant W/C ratio, when the concentration of cement increases in the paste volume (i.e. the reduction of effective water to cement ratio), the compressive strength is main-tained constant despite the increase in air content (Table5). Moreover, the compressive strength of RAC30 decreased due to the reduction in cement concentration in the cement paste.
4.2.3 Elastic Modulus
The variation of both static and dynamic modulus of elasticity, denoted E, at the age of 28 days is plotted in Fig.12. It can be seen that the recycled aggregates have a significant effect on the elastic modulus where it decreases with the increase of replacement ratio. These results are in good agreement with the literature results which indicate a decrease in the elastic modulus (Xiao et al.2006; Casuccio et al. 2008). This reduction is the consequence of the application of recycled aggregates with a higher porosity and a lower elastic modulus than those of the natural coarse aggregates.
4.2.4 Flexural and Splitting Tensile Strengths The flexural strength obtained for all concretes is shown in Fig.13 with the tensile splitting strength. It is possible to conclude that the tensile strength with recycled aggregates is negatively affected when replacement ratio increases. The loss of both flexural and tensile strengths is about 6 % for RAC30, 11 % for RAC65 and reaches 20 % for RAC100.
The correlation between tensile strength and the porosity is illustrated on Fig.14. The results, as might be expected, show a decrease in tensile strength when the porosity increases. Figure15shows the normalized static modulus of elasticity versus the normalized tensile strength. The linear correlation indicates that the higher porosity of recycled aggregates affects both characteristics. These results are in agreement with those established by Evangelista and de Brito (2007).
4.2.5 Analysis of Peak Strain and Stress–Strain Relationship Under Compression
Stress–strain curves were obtained by uniaxial compres-sive tests for all materials developed in the present work. The analysis of these curves shows that the peak strain corresponding to the maximum stress increases when increasing the replacement ratio. The evolution of this strain, normalized by the strain of NAC, is shown in Fig.16 as a function of the rate of substitution with the results of Bele´n et al. (2011) and Martı´nez-Lage et al. (2012). The results show a linear increase of the normalized peak strain with the replacement ratio. However, this increase is more significant in the context of our work and it is probably attributed to the adopted experimental conditions.
The influence of the recycled aggregates content on the complete stress–strain curves was also investigated. The results shown on Fig.17indicate that the shape of the
post-Fig. 10 Compressive strength as a function of age and replacement (means and standard errors).
Fig. 11 Relationship between relative compressive strength and cement, water and air contents.
peak curve is more spread when the replacement ratio is important. This observation highlights a more dissipative behavior when recycled aggregates are used, and may be explained by a more diffuse damage related to the nature of recycled aggregates.
5. Prediction of Stress–Strain Relationship
and the Applicability of EC2
Eurocode 2 proposes the following expression for pre-dicting elastic modulus E (in MPa) from compressive strengthfc0(in MPa).
E¼22000 f 0 c 10
0:3
: ð6Þ
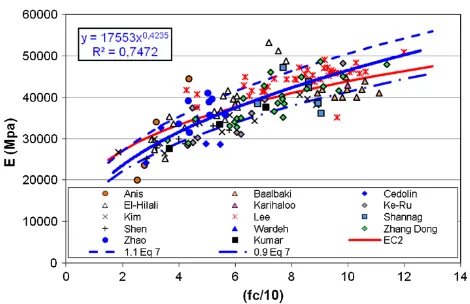
The validity of the previous expression was verified using more than 230 concretes formulated with natural aggregates (see Table7in ‘‘Appendix’’ section). The results are plotted in Fig.18and the data analysis shows that the expression of EC2 does not allow a satisfactory prediction of elastic modulus. Equation (6) fits experimental results with correlation factor R2=0.68 while the proposed Eq. (7) provides a better description of the experimental results.
Fig. 13 Flexural and splitting strength as a function of replacement.
Fig. 14 Splitting tensile strength versus water porosity.
Fig. 15 Correlation between the elastic modulus and tensile strength.
Fig. 16 Influence of RCA content on the peak strain.
Fig. 17 Normalized stress–strain relationship.
Fig. 18 Elastic modulus of NAC as a function of compressive strength.
E¼17553 f 0 c 10
0:42
: ð7Þ
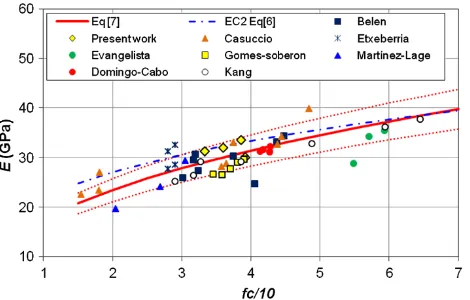
The elastic modulus of RAC developed in this work together with the results found in the literature
(Gomez-Soberon 2002; Etxeberria et al. 2007; Evangelista and de Brito2007; Casuccio et al.2008; Domingo-Cabo et al.2009; Bele´n et al.2011) are shown in Fig.19. From this figure it can be seen that Eq. (7) allows a better prediction of elastic modulus than those proposed in EC2 (Eq. (6)) for RAC. It can be pointed out also that the majority of experimental values are within the interval of±10 % bounded by the two dotted red lines. Finally, it can be concluded that the relationship betweenEandfc0does not seem affected by the nature of gravels.
EC2 proposes also a relation between the peak strain,ec1,
to the compressive strengthfc0regardless the loading rate and the specimen size. This relation is given by the following expression:
ec1¼0:7 fc0 0:31
2:80=00: ð8Þ
The validity of this expression was verified for 66 concretes of the literature with natural aggregates (see Table8 in ‘‘Appendix’’ section). The results presented in Fig.20show that the previous expression of EC2 does not predicted well the peak strain. However, it can be shown that the proposed expression given by Eq.9is more suitable for the prediction of peak stain.
ec1¼1:1 fc0 0:1750
=00 ð9Þ
For the full stress–strain curve, EC2 proposes the simple following equation:
r
f0 c
¼ kgg
2
1þ ðk2Þg; ð10Þ
withg¼ec=ec1,k¼1:05 Ecmðec1=fcÞandEcmthe secant
modulus of elasticity. The model requires the knowledge of the static modulus of elasticity, the compressive strength and the peak strainec1. The application of this model to recycled
aggregates concrete shows that it does not reproduce suitably the post-peak behavior (Fig.21). Another simple expression was proposed by Carreira and Chu (1985).
r
fc0 ¼
b ec
ec1
b1þ ec
ec1
b; with b¼ 1
1 fc0
Eec1
ð11Þ
Equations (7), (9) and (11) may therefore be used for the modeling of full stress–strain relationship of recycled aggregates concrete with the modification of peak strain with the replacement ratio. Figure21 presents a comparison between the curves calculated using the modified model of Carreira and Chu (Eq. (9)) and the model of EC2 (Eq. (8)). It can be seen that this modified model is more adequate for the modeling of post-peak behavior as the model of EC2.
Fig. 19 Variation of modulus of elasticity of RAC as a function of compressive strength.
Fig. 20 Peak-strain as a function of compressive stress.
6. Conclusion
In this paper, a natural aggregates concrete, NAC, and three recycled concrete aggregates RAC30, RAC65 and RAC100 were prepared on the basis of an imposed constant flowability at fresh state and a target compressive strength of about 35 MPa at 28 days. Moreover only coarse aggregates were replaced by recycled ones with three volumetric replacement ratios being respectively 30, 65 and 100 %. Based on the experimental results the following conclusions can be drawn:
– The use of recycled aggregates up to 30 % does not affect the demand of water of concrete, but generates a reduction of 14 % of the compressive strength. By increasing the replacement ratio, the cement content increases to maintain constant W/C ratio causing an increase in the compressive strength which counterbal-ances the negative effect of recycled aggregates. – Recycled aggregate concretes had lower elastic modulus,
splitting and flexural tensile strength than normal aggregate one.
– The strain–stress curves under uniaxial compression show that the post-cracking branch is more spread out compared to NAC. In addition, the peak-strain increases by increasing the replacement ratio. These phenomena
are explained by the more progressive and diffuse damage of concrete due to the presence of recycled aggregates.
New relationships for prediction of concrete’s elastic modulus, and a peak strain from compressive strength were proposed. The predicted results for RAC were closer to experimental results than values predicted by equations proposed in EC2. For the complete strain–stress curve, a model based on the Carreira and Chu’s model was proposed. The modified model is more adequate for the modeling of post-peak behavior than the model of EC2.
Open Access
This article is distributed under the terms of the Creative Commons Attribution License which permits any use, distribution, and reproduction in any medium, provided the original author(s) and the source are credited.
Appendix: Database of Mechanical
Characteristics
See Tables7 and8.
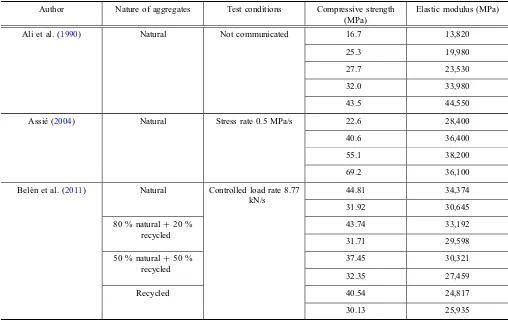
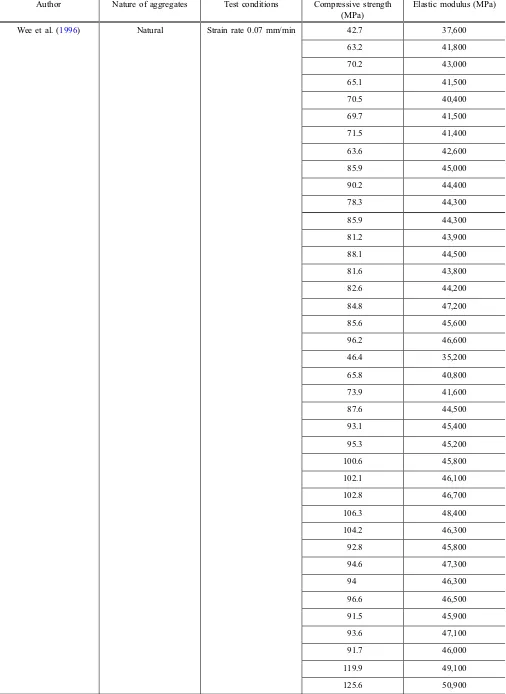
Table 7 Elastic modulus database.
Author Nature of aggregates Test conditions Compressive strength (MPa)
Elastic modulus (MPa)
Ali et al. (1990) Natural Not communicated 16.7 13,820
25.3 19,980
27.7 23,530
32.0 33,980
43.5 44,550
Assie´ (2004) Natural Stress rate 0.5 MPa/s 22.6 28,400
40.6 36,400
55.1 38,200
69.2 36,100
Bele´n et al. (2011) Natural Controlled load rate 8.77 kN/s
44.81 34,374
31.92 30,645
80 % natural?20 % recycled
43.74 33,192
31.71 29,598
50 % natural?50 % recycled
37.45 30,321
32.35 27,459
Recycled 40.54 24,817
30.13 25,935
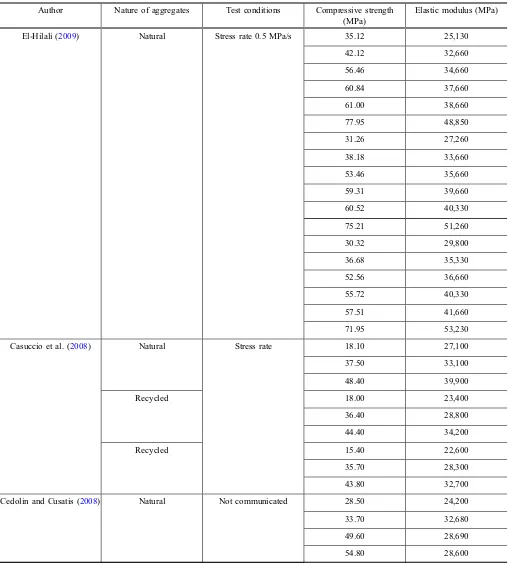
Table 7 continued
Author Nature of aggregates Test conditions Compressive strength (MPa)
Elastic modulus (MPa)
El-Hilali (2009) Natural Stress rate 0.5 MPa/s 35.12 25,130
42.12 32,660
56.46 34,660
60.84 37,660
61.00 38,660
77.95 48,850
31.26 27,260
38.18 33,660
53.46 35,660
59.31 39,660
60.52 40,330
75.21 51,260
30.32 29,800
36.68 35,330
52.56 36,660
55.72 40,330
57.51 41,660
71.95 53,230
Casuccio et al. (2008) Natural Stress rate 18.10 27,100
37.50 33,100
48.40 39,900
Recycled 18.00 23,400
36.40 28,800
44.40 34,200
Recycled 15.40 22,600
35.70 28,300
43.80 32,700
Cedolin and Cusatis (2008) Natural Not communicated 28.50 24,200
33.70 32,680
49.60 28,690
Table 7 continued
Author Nature of aggregates Test conditions Compressive strength (MPa)
Elastic modulus (MPa)
Wee et al. (1996) Natural Strain rate 0.07 mm/min 42.7 37,600
63.2 41,800
70.2 43,000
65.1 41,500
70.5 40,400
69.7 41,500
71.5 41,400
63.6 42,600
85.9 45,000
90.2 44,400
78.3 44,300
85.9 44,300
81.2 43,900
88.1 44,500
81.6 43,800
82.6 44,200
84.8 47,200
85.6 45,600
96.2 46,600
46.4 35,200
65.8 40,800
73.9 41,600
87.6 44,500
93.1 45,400
95.3 45,200
100.6 45,800
102.1 46,100
102.8 46,700
106.3 48,400
104.2 46,300
92.8 45,800
94.6 47,300
94 46,300
96.6 46,500
91.5 45,900
93.6 47,100
91.7 46,000
119.9 49,100
125.6 50,900
Table 7 continued
Author Nature of aggregates Test conditions Compressive strength (MPa)
Elastic modulus (MPa)
Gesoglu et al. (2002) Natural 77.2 47,100
71.5 48,000
66.5 46,800
70.7 47,300
61.8 45,400
68.9 47,600
59.1 40,900
62.2 45,400
75.8 43,000
67.7 48,200
53.6 46,200
57.9 44,500
92.9 46,400
94 48,300
97.7 47,000
102 48,800
93.7 50,500
86.2 47,100
87.9 43,000
82.7 45,400
79.1 44,700
85.3 45,000
86.9 46,100
90.7 48,100
89.5 47,600
87.8 45,400
90.3 45,000
95.2 50,800
92.2 50,000
97.6 49,300
87.5 48,500
87.2 41,100
80.4 43,200
86.5 44,200
83.9 44,300
80.9 44,600
84.5 45,300
Table 7 continued
Author Nature of aggregates Test conditions Compressive strength (MPa)
Elastic modulus (MPa)
Wu et al. (2001) Natural Not communicated 98.2 48,200
70.4 39,500
65.8 36,200
60.5 31,500
62.1 31,000
44.8 37,500
43.2 28,300
46.6 30,100
45.0 29,000
Shannag (2000) Natural 68.0 38,500
77.0 47,200
86.0 43,800
86.0 42,300
89.5 38,600
90.5 36,200
Baalbaki et al. (1991) Natural 105.0 42,000
106.0 44,000
111.0 41,000
99.3 45,000
99.7 42,000
95.3 40,000
98.0 40,000
103.0 40,000
90.8 42,000
89.2 41,000
Domingo-Cabo et al. (2009) Natural Not communicated 42.8 32,153
20 % recycled?80 % natural
42.7 31,178
50 % recycled?50 % natural
41.3 31,204
Recycled 41.8 31,589
Fares (2009) Natural Stress rate 0.5 MPa/s 36.6 36,110
52.7 39,000
40.8 43,930
Etxeberria et al. (2007) Natural UNE 83-304-84 29.0 32,561,7
25 % recycled?75 % natural
28.0 31,300,4
50 % recycled?50 % natural
29.0 28,591,7
Recycled 28.0 27,764
Table 7 continued
Author Nature of aggregates Test conditions Compressive strength (MPa)
Elastic modulus (MPa)
Evangelista and de Brito (2007)
Natural NP EN 12390-5 59.3 35,500
30 % recycled?70 % natural
57.1 34,200
Recycled 54.8 28,900
Gomez-Soberon (2002) Natural Not communicated 39.0 29,700
15 % recycled?85 % natural
38.1 29,100
30 % recycled?70 % natural
37.0 27,800
60 % recycled?40 % natural
35.8 26,600
Recycled 34.5 26,700
Karihaloo et al. (2006) Natural Not communicated 55.0 36,900
60.0 38,300
100.0 43,000
Kim et al. (1997,2004) Natural 18.5 26,772
33.2 28,832
58.0 35,794
31.3 29,940
47.4 33,720
82.8 40,570
32.6 28,790
45.8 33,400
85.7 39,570
34.9 26,510
55.3 31,580
66.9 34,350
88.8 38,140
Martı´nez-Lage et al. (2012) Natural Controlled strain rate 16le/s
30.5 29,500
50 % recycled?50 % natural
26.8 24,190
Recycled 20.4 19,765
Zhao et al. (2008) Natural Not communicated 43.8 31,400
43.4 39,200
50.9 35,700
56.4 35,900
50.2 41,000
50.8 38,900
40.0 33,600
Table 7 continued
Author Nature of aggregates Test conditions Compressive strength (MPa) Elastic modulus (MPa)
Dong and Keru (2001) Natural Not communicated 60.5 34,900
60.5 32,700
62.1 35,000
83.6 44,900
98.2 45,100
63.0 39,800
72.5 46,100
77.4 38,500
76.5 40,300
70.2 42,800
73.8 36,600
75.1 38,600
77.0 35,200
76.8 39,700
90.3 48,700
91.2 42,600
96.7 41,700
85.5 42,100
113.7 48,000
35.9 29,600
43.3 28,900
45.8 34,700
58.0 33,000
59.7 34,000
Wardeh et al. (2010) Natural Strain rate 1 mm/min 46.5 35,000
Praveen et al. (2004) Natural Not communicated 36.7 27,527
54.6 33,470
70.8 37,614
Shen et al. (2009) Natural Loading rate 10 kN/s 28.6 25,130
40.0 29,840
57.9 32,040
32.1 25,420
42.2 26,000
52.1 30,020
48.8 27,800
56.0 28,670
68.8 33,030
Kang et al. (2014) Natural ASTM C39/C39 M 65.4 37,700
15 % recycled?85 % natural 59.4 36,200
30 % recycled?70 % natural 48.4 32,800
Natural 38.6 29,200
15 % recycled?85 % natural 32.7 29,200
30 % recycled?70 % natural 31.7 26,500
50 % recycled?50 % natural 29 25,300
Table 8 strain at peak stress database.
Author Nature of aggregates Test conditions Compressive strength (MPa) Strain at peak stress
Bele´n et al. (2011) Natural Controlled strain rate 16le/s 44.8 0.00190
31.9 0.00174
80 % natural?20 % recycled 43.7 0.00189
31.7 0.00199
50 % natural?50 % recycled 37.5 0.0019
32.4 0.00195
Recycled 40.5 0.00219
30.1 0.00216
Martı´nez-Lage et al. (2012) Natural Controlled strain rate 16le/s 30.5 0.0021
50 % natural?50 % recycled 26.8 0.0023
Recycled 20.4 0.0025
Wee et al. (1996) Natural Strain rate 0.07 mm/min 63.2 0.00216
70.2 0.0021
65.1 0.00216
70.5 0.00206
69.7 0.00212
71.5 0.00213
63.6 0.00228
85.9 0.00226
90.2 0.00243
78.3 0.00232
85.9 0.00231
81.2 0.00224
88.1 0.00227
81.6 0.00211
82.6 0.00216
84.8 0.00252
85.6 0.00232
96.2 0.00237
73.9 0.00243
87.6 0.00243
93.1 0.00244
95.3 0.00242
100.6 0.00258
102.1 0.00256
102.8 0.00247
106.3 0.00251
104.2 0.00249
92.8 0.00242
94.6 0.00228
96.6 0.00232
91.5 0.00228
93.6 0.00219
91.7 0.00266
119.9 0.00275
References
Ali, A. M., Farid, B., & Al-Janabi, A. I. M. (1990). Stress–strain relationship for concrete in compression model of local materials. Journal of King Abdulaziz University: Engi-neering Sciences, 2, 183–194.
Assie´, S. (2004).Durability of self compacting concretes(254 pp). PhD Thesis, INSA-Toulouse, Toulouse (in French). Baalbaki, W., Benmokrane, B., Chaallal, O., & Aitcin, P.-C. (1991).
Influence of coarse aggregate on elastic properties of high-performance concrete.ACI Materials Journal, 88(5), 499–503. Bele´n, G.-F., Fernando, M.-A., Carro Lopez, D., & Seara-Paz, S. (2011). Stress–strain relationship in axial compression for concrete using recycled saturated coarse aggregate. Construction and Building Materials, 25(5), 2335–2342. Belin, P., Habert, G., Thiery, M., & Thiery, M. (2013). Cement
paste content and water absorption of recycled concrete coarse aggregates. Materials and Structures, 1–15. doi: 10.1617/s11527-013-0128-z.
Carreira, D. J., & Chu, K.-H. (1985). Stress–strain relationship for plain concrete in compression.ACI Materials Journal, 82(6), 797–804.
Casuccio, M., Torrijos, M.-C., Giaccio, G., & Zerbino, R. (2008). Failure mechanism of recycled aggregate concrete. Construction and Building Materials, 22(7), 1500–1506. Cedolin, L., & Cusatis, G. (2008). Identification of concrete
fracture parameters through size effect experiments. Cement & Concrete Composites, 30(9), 788–797. de Juan, M.-S., & Gutirrez, P.-A. (2009). Study on the influence
of attached mortar content on the properties of recycled concrete aggregate. Construction and Building Materials, 23(2), 872–877.
Dhonde, H.-B., Mo, Y.-L., Hsu, T. T.-C., & Vogel, J. (2007). Fresh and hardened properties of self-consolidating fiber-reinforced concrete.ACI Journal, 104(5), 491–500. Djerbi Tegguer, A. (2012). Determining the water absorption of
recycled aggregates utilizing hydrostatic weighing approach. Construction and Building Materials, 27(1), 112–116.
Table 8 continued
Author Nature of aggregates Test conditions Compressive strength (MPa) Strain at peak stress
Dhonde et al. (2007) Natural Stress rate 0.25 MPa/s 31.2 0.00147
38.5 0.00178
50.5 0.00194
77.6 0.00191
Praveen et al. (2004) Natural Not communicated 36.7 0.002
54.6 0.0023
70.8 0.0025
Ali et al. (1990) Natural Not communicated 16.7 0.0018
25.3 0.0021
27.7 0.0021
32.0 0.0022
43.5 0.0022
Prasad et al. (2009) Natural Strain rate 23.3 0.00197
39.6 0.00235
Suresh Babu et al. (2008) Natural Strain rate 25.0 0.001905
31.0 0.00207
31.5 0.00209
25.8 0.00199
28.0 0.00203
Carreira and Chu (1985) Natural Not communicated 20.7 0.0018
30.5 0.0018
49.5 0.00195
Carreira and Chu (1985) Natural Not communicated 10.7 0.0015
20.0 0.0019
34.8 0.0022
46.9 0.0021
52.4 0.00195
Domingo-Cabo, A., Lazaro, C., Lopez-Gayarre, F., Serrano-Lopez, M. A., Serna, P., & Castano-Tabares, J. O. (2009). Creep and shrinkage of recycled aggregate concrete. Con-struction and Building Materials, 23(7), 2545–2553. Dong, Z., & Keru, W. (2001). Fracture properties of
high-strength concrete. Journal of Materials in Civil Engineer-ing, 13(1), 86–88.
El-Hilali, A. (2009).Experimental study of the rheology and the behaviour and self-compacting concrete (SCC): Influence of limestone filler and vegetable fibres (p. 200). PhD Thesis, University of Cergy-Pontoise (in French).
Etxeberria, M., Vazquez, E., Mari, A., & Barra, M. (2007). Influence of amount of recycled coarse aggregates and production process on properties of recycled aggregate concrete.Cement and Concrete Research, 37(5), 735–742. Evangelista, L., & de Brito, J. (2007). Mechanical behaviour of concrete made with fine recycled concrete aggregates. Cement & Concrete Composites, 29(5), 397–401.
Fares, H. (2009).Mechanical and physico-chemical properties of self compacting concrete exposed to heigh temperatures(p. 206). PhD Thesis, University of Cergy-Pontoise (in French). Gesoglu, M., Gu¨neyisi, E., & O¨ zturan, T. (2002). Effects of end conditions on compressive strength and static elastic modulus of very high strength concrete. Cement and Concrete Research, 32(10), 1545–1550.
Gomes, M. & de Brito, J. (2009). Structural concrete with incorporation of coarse recycled concrete and ceramic aggregates: durability performance. Materials and Struc-tures, 42(5), 663–675. doi:10.1617/s11527-008-9411-9). Gomez-Soberon, J. M. V. (2002). Porosity of recycled concrete
with substitution of recycled concrete aggregate: An experimental study.Cement and Concrete Research, 32(8), 1301–1311.
Hacene, S.-M.-A. B., Ghomari, F., Schoefs, F., & Khelidj, A. (2009). Etude expe´rimentale et statistique de l’influence de l’affaissement et de l’air occlus sur la re´sistance a la compres-sion des be´tons.Lebanese Science Journal, 10(2), 81–100. Hansen, T. C., & Boegh, E. (1986). Elasticity and drying
shrinkage of recycled aggregate concrete. ACI Journal, 82(5), 648–652.
Julio, E., Dias, N., Lourenc¸o, J., & Silva, J. (2006). Feret coefficients for white self-compacting concrete. Materials and Structures, 39(5), 585–591. doi:10.1007/s11527 -005-9048-x.
Kang, T. H.-K., Kim, W., Kwak, Y.-K., & Hong, S.-G. (2014). Flexural testing of reinforced concrete beams with recycled concrete aggregates. ACI Structural Journal, 111(3), 607–616.
Karihaloo, B.-L., Abdalla, H.-M., & Xiao, Q.-Z. (2006). Deterministic size effect in the strength of cracked concrete structures.Cement and Concrete Research, 36(1), 171–188. Kim, J.-K., Lee, C.-S., Park, C.-K., & Eo, S.-H. (1997). The fracture characteristics of crushed limestone sand concrete. Cement and Concrete Research, 27(11), 1719–1729. Kim, J.-K., Lee, Y., & Yi, S.-T. (2004). Fracture characteristics
of concrete at early ages. Cement and Concrete Research, 34(3), 507–519.
Kou, S.-C., Poon, C.-S., & Etxeberria, M. (2011). Influence of recycled aggregates on long term mechanical properties and pore size distribution of concrete. Cement & Concrete Composites, 33(2), 286–291.
Le´de´e, M. V., de Larrard F., Sedran, T., & Brochu, F.-P. (2004). Essai de compacite´ des fractions granulaires a` la table a` se-cousses—Mode ope´ratoire. M. d. e. no. 61 (p. 13). Paris, France Laboratoire Central des Ponts et Chausse´es (in French). Li, X. (2008). Recycling and reuse of waste concrete in China: Part I. Material behaviour of recycled aggregate concrete. Resources, Conservation and Recycling 53(1–2), 36–44. Manzi, S., Mazzotti, C., & Bignozzi, M. C. (2013). Short and
long-term behavior of structural concrete with recycled concrete aggregate.Cement & Concrete Composites, 37, 312–318. Martinez-Lage, I., Martinez-Abella, F., Vazquez-Herrero, C., &
Perez-Ordonez, J.-L. (2012). Properties of plain concrete made with mixed recycled coarse aggregate.Construction and Building Materials, Non Destructive Techniques for Assessment of Concrete, 37, 171–176.
McNeil, K. & Kang T.-K. (2013). Recycled concrete aggre-gates: A review. International Journal of Concrete Struc-tures and Materials, 7(1), 61–69 doi:10.1007/s40069-0 13-0032-5).
Pereira, P., Evangelista, L., & de Brito, J. (2012). The effect of superplasticisers on the workability and compressive strength of concrete made with fine recycled concrete aggregates. Construction and Building Materials, 28(1), 722–729. Poon, C.-S., Kou S.-C., & Lam, L. (2007). Influence of recycled
aggregate on slump and bleeding of fresh concrete. Mate-rials and Structures, 40(9), 981–988. doi: 10.1617/s11527-006-9192-y.
Prasad, M. L. V., Rathish Kumar, P., & Oshima, T. (2009). Development of analytical stress–strain model for glass fiber self compacting concrete. International Journal of Mechanics and Solids, 4(1), 25–37.
Praveen, K., Haq, M.-A., & Kaushik, S.-K. (2004). Early age strength of SCC with large volumes of fly ash. Indian concrete Journal, 78(6), 25–29.
Sedran, T. (1999).Rhe´ologie et Rhe´ome´trie des be´tons: Appli-cation aux be´tons autonivelants (p. 220). Champs-sur-Marne: Ecole nationale des Ponts et Chausse´es.
Shannag, M. J. (2000). High strength concrete containing nat-ural pozzolan and silica fume. Cement & Concrete Com-posites, 22(6), 399–406.
Shen, J., Yurtdas, I. Diagana, G., & Li, A. (2009). Evolution of the uniaxial mechanical behavior of self-compacting con-crete (SCC): Effect of the compressive strength. In 27th meeting of civil engineering universities, St. Malo, France. Suresh Babu, T., Seshagiri Rao, M. V., & Rama Seshu, D. (2008). Mechanical properties and stress–strain behavior of self compacting concrete with and without glass fibres. Asian Journal of Civil Engineering (Building and Hous-ing), 9(5), 457–472.
UNICEM L’Union nationale des industries de carrie`res et mat-e´riaux de construction. Reteieved, fromhttp://www.unicem. fr/. Accessed 2013.
UNPG Union Nationale des Producteurs de Granulats. Retei-eved, fromhttp://www.unpg.fr/. Accessed 2013.
Wardeh, G., Ghorbel, E., & Mignot, V. (2010). Fracture properties of hybrid fibre self compacting concrete (pp. 219–224). Marianske Lazne: Concrete structures for chal-lenging times.
Wee, T., Chin, M., & Mansur, M. (1996). Stress–strain rela-tionship of high-strength concrete in compression.Journal of Materials in Civil Engineering, 8(2), 70–76.
Wu, K.-R., Chen, B., Yao, W., & Zhang, D. (2001). Effect of coarse aggregate type on mechanical properties of
high-performance concrete. Cement and Concrete Research, 31(10), 1421–1425.
Xiao, J., Li, J., & Zhang, C. (2005). Mechanical properties of recycled aggregate concrete under uniaxial loading.Cement and Concrete Research, 35(6), 1187–1194.
Xiao, J., Sun, Y., & Falkner, H. (2006). Seismic performance of frame structures with recycled aggregate concrete. Engi-neering Structures, 28(1), 1–8.
Zhao, Z., Kwon, S.-H., & Shah, S.-P. (2008). Effect of specimen size on fracture energy and softening curve of concrete: Part I. Experiments and fracture energy. Cement and Concrete Research, 38(8–9), 1049–1060.