Hydration Behaviors of Portland Cement with Different Lithologic
Stone Powders
Zuqiang Xiong
1), Peng Wang
1), and Yuli Wang
2),*
(Received January 17, 2014, Accepted July 18, 2014, Published online October 1, 2014)
Abstract: In this study, influence of different stone powders (SP), including limestone powders (LP), quartzite powders (QP), and granitic powders (GP), on the hydration behaviors of portland cement, for example, setting time, hydration heat, and hydration products, were discussed. The initial and the final setting time both shorten when the content of LP is 5 %, however, they are slightly delayed by the other two SPs. The LP has no obvious influence on the arrival time of the first peak in the exothermal curves, and it makes the peak value decrease; the other two SPs postpone the appearance of the first peak, and they also make the peak value decrease. For the second peak, LP shifts the peak position to the left, QP has no effect on this peak position, and GP makes the appearance of this peak delayed by 143 min. Similarly, three kinds of SPs have different influence on the hydration products of portland cement. The LP precipitates the formation of hydrated calcium carbo aluminate, the QP the formation of hydrated garnet, and the GP makes the amount of Tobermorite increase.
Keywords:lithology, stone powders (SP), portland cement, hydration product.
1. Introduction
SP is by-product from the production of manufactured fine aggregate (MFA), and its size is-75lm, which has the same mineral composition as the mother rock of MFA (Li et al. 2006). Some studies showed that LP was not completely inert, and it could react with C3A and C4AF into hydrated calcium
carbo aluminate, thereby making the properties of cement-based materials improved (Gutteridge and Dalzeil 1990; Soroka and Stern1976; Bonavetti et al.2003; Bonavetti and Irassar1994; Bonavetti et al.2001; Poppe and Schutter2005). Kakali et al. (2000) examined the hydration product of port-land cement with 0, 10, 20 and 35 % of LP at 28 days, and revealed the reaction mechanism of C3A and LP, which
showed that LP imposed great influence on the hydration products because of the formation of calcium carbo aluminate. XRD peaks of Ca4Al2O6CO311H2O and Ca4
A-l2O6(CO3)0.5(OH)11.5H2O became more obvious as the
content of LP increased, and LP quickened the formation of calcium carbo aluminate and slowed down the formation of calcium Sulpho aluminate. Zhou et al. (1996) found that different lithologic SPs could accelerate the hydration of
portland cement, and the SP could act as a nuclei and induced the devitrification of the hydration products, therefore increasing the cement hydration reaction rate. Hydrated cal-cium carbo aluminate was formed and the transformation of ettringite to hydrated calcium sulfo aluminate was restrained when LP was mixed. Kumar et al. (2013a) and Oey et al. (2013) estimated the influence of limestone fillers on reaction and property evolution in cementitious materials with simple methods, and it is concluded that the limestone fillers have accelerations in reactions. Kumar et al. (2013b) made a comparison of intergrinding and blending limestone on reac-tion and strength evolureac-tion in cementitious materials, and the results suggest that intergrinding or blending are both viable strategies to reduce the clinker factors of portland cement.
However, the research focuses on the influence of MFA and LP on the properties of concrete and cements, and the reports of other kinds of MFA and SP are less. The lithology of SP may be different because of its mother rock; therefore, the influences of SP derived from different lithologic rocks on the hydration behaviors of cement were comparatively studied.
2. Raw Materials and Test Methods
2.1 Raw Materials
The Huaxin P.O52.5 cement was used, whose properties meet the requirement of the Common portland cement
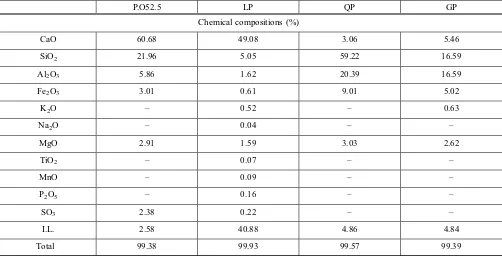
(GB175-2007), and its composition was showed in Table1. The different lithologic SPs were used, including LP, QP, and GP, and their specific surface area was listed in Table2 and the main chemical composition in Table3. XRD pat-terns of the SPs were shown in Fig.1.
1)
School of Energy Science and Engineering, Henan Polytechnic University, Jiaozuo 454003, China.
2)
School of Materials Science and Engineering, Henan Polytechnic University, Jiaozuo 454003, China. *Corresponding Author; E-mail: wangyuli@hpu.edu.cn CopyrightÓThe Author(s) 2014. This article is published with open access at Springerlink.com
International Journal of Concrete Structures and Materials Vol.9, No.1, pp.55–60, March 2015
From the above XRD patterns, it can be concluded that LP is mainly composed of calcites and Dolomites, QP is composed of quartz, and GP is composed of quartz and fairchildite.
2.2 Test Methods
The normal consistency and the setting time were tested according to theTest methods for water requirement of nor-mal consistency, setting time and soundness of the Portland cement (GB/T1346-2011), and the specific surface area test was carried out according to theTesting method for specific surface of cement-Blaine method (GB/T 8074-2008). The exothermal curves were achieved using the Heat conduction calorimetry and SETARAM hydration exothermal analyzer. The total powder quality of cement and SP is 500 mg for any sample, water to powder ratio is 1:1, and the exothermal curves were continuously recorded for 48 h.
3. Results and Discussion
3.1 Influence of SPs on the Standard Viscosity and Setting Time
The total quality of the sample is fixed at 500 g and the contents of SPs are 0, 5, 10, 15, and 20 % in the samples,
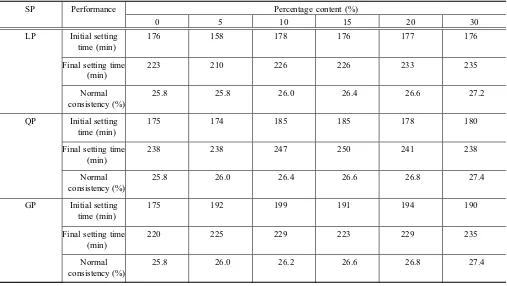
respectively. The influences of SPs on the initial, the final setting time, and the normal consistency of cement were tested. It can be concluded from Table4 that the normal consistency of the mixture paste gradually increased as the content of LP increases, the influence regularities of QP and GP are the same as the LP, and they all make the water requirement increase.
The initial setting time shortens by 20 min when the content of LP is 5 %, and the initial setting time is the same as the control without LP when the content of LP is equal to or greater than 10 %. The initial setting time does not change when the content of QP is 5 %, and it increases by 3–10 min when the content of QP continuously increases. The initial setting time increases by 17 min when the content of GP is 5 %, and it delays by 16–24 min when the content is greater than 5 %.
As shown in Table4, SPs have similar influence regularity on the final setting time. The final setting time shortens by 13 min when the LP is 5 %, the final setting time is the same as the control when the content of LP is 10–15 %, and it increases by 10 min when the content of LP is greater than 15 %. For QP, the final setting time is the same as the control when the content is 5 %, and it delays by 3–12 min when the content is greater than 5 %. The final setting time increases by 3–15 min when GP is mixed at any content. Table 1 Main mineral composition of the cement (%).
Brand C3S C2S C3A C4AF
P.O52.5 40.62 29.58 10.42 9.15
Table 3 Chemical compositions of the cement and SPs.
P.O52.5 LP QP GP
Chemical compositions (%)
CaO 60.68 49.08 3.06 5.46
SiO2 21.96 5.05 59.22 16.59
Al2O3 5.86 1.62 20.39 16.59
Fe2O3 3.01 0.61 9.01 5.02
K2O – 0.52 – 0.63
Na2O – 0.04 – –
MgO 2.91 1.59 3.03 2.62
TiO2 – 0.07 – –
MnO – 0.09 – –
P2O5 – 0.16 – –
SO3 2.38 0.22 – –
I.L. 2.58 40.88 4.86 4.84
Total 99.38 99.93 99.57 99.39
Table 2 Specific surface area of the cement and SPs.
Raw materials P.O52.5 LP QP GP
Specific surface area
(m2/kg)
In conclusion, the three kinds of SP all make the normal consistency of cement increase; the initial and final setting times delay when the content of LP is 5 %, and they have no great change when the content increases; the initial and final setting times slightly prolongs when QP or GP is mixed.
3.2 Influence of SP on the Hydration Thermal of Cement
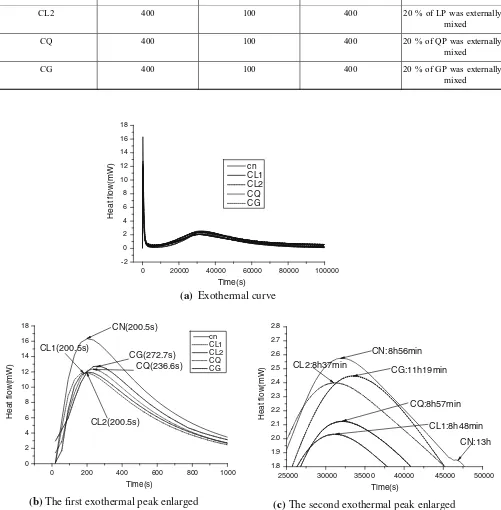
The mix proportion was shown in Table 5, and the con-tinuous exothermal curves of the hydrating samples for 48 h were shown in Fig.2. Figure2a shows the exothermal curves of 48 h, Fig.2b, c are the enlarged figures of the first peak and the second peak, which is to be easily observed. As is shown in Fig.2b, the first exothermal peaks of the CN, CL1, CL2, CQ and CG samples appear at 200.5, 200.5, 200.5, 236.6, and 272.7 s, respectively. The LP has no influences on the arrival of the first peak whether it was internally or externally mixed, and the appearance of the first exothermal peak delays by 36.1 and 72.2 s when the QP and the GP were mixed, respectively
The first exothermal peak of the cement hydration is caused by the formation of Ettringite (Runzhang 1996). It can be concluded from Fig.2b that the LP has no influence on the arrival time of the first peak, however, the peak area decrea-ses, which may be ascribed to the less cement; the arrival time of the first peak delays when the GP and the QP were mixed, which indicates that they postpone the formation of Ettringite, and the peak areas decrease, also. The first peak values of the CN, the CL1, the CL2, the CQ, and the CG are 16.34, 12.76, 12.37, 11.97, and 11.89 mW, accordingly, which shows that the first value decreases when SP is mixed.
Table 4 Influence of SPs on the setting time.
SP Performance Percentage content (%)
0 5 10 15 20 30
LP Initial setting
time (min)
176 158 178 176 177 176
Final setting time (min)
223 210 226 226 233 235
Normal consistency (%)
25.8 25.8 26.0 26.4 26.6 27.2
QP Initial setting
time (min)
175 174 185 185 178 180
Final setting time (min)
238 238 247 250 241 238
Normal consistency (%)
25.8 26.0 26.4 26.6 26.8 27.4
GP Initial setting
time (min)
175 192 199 191 194 190
Final setting time (min)
220 225 229 223 229 235
Normal consistency (%)
25.8 26.0 26.2 26.6 26.8 27.4
GP 0 1000 2000 3000 4000 5000
10 20 30 40 50 60 70
2 Theta(Deg.) Intensity(CPS) a-Si O 2 a-Si O 2 a-Si O 2 a-Si O 2 a-Si O 2 a-Si O 2 a-Si O 2 a-Si O 2 K 2 Ca (C O 3 ) 2 K 2 Ca (C O 3 ) 2 LP 0 200 400 600 800 1000 1200
10 20 30 40 50 60
2 Theta(Deg.) Intensity(CPS) Ca CO 3 Ca CO 3 Ca CO 3 Ca CO 3 Ca CO 3 Ca CO 3 Ca CO 3 Ca CO 3 Ca M g (CO 3 )2 QP 0 2000 4000 6000 8000 10000
10 20 30 40 50 60
2 Theta(Deg.) Intensity(CPS) a-Si O 2 a-Si O 2 a-Si O 2 a-Si O 2 a-Si O 2 a-Si O 2 a-Si O 2 (a) (b) (c)
The second peak in the exothermal curve is formed because of the hydration of C3S (Runzhang1996). It can be
seen from Fig.2c that the arrival time of the second peaks are 516, 528, 536, 537, and 679 min, respectively. The LP shifts the peak position to the left, which shows that the hydration of cement is accelerated by the LP. However, the appearances of the second peaks delays by 1 and 143 min by
the QP and the GP, respectively; this shows that the QP has no obvious effect on the hydration of C3S and the GP has
obvious effect. The values of the second peak are 2.48, 2.45, 2.40, 2.12, and 2.03 mW, according to the CN, the CG, the CL2, the CQ and the CL1. It can be concluded that the SPs, especially for the QP and the GP, decreases the concentration of hydration heat from the two exothermal peaks.
Table 5 Mix proportion.
No Raw materials (mg) Remarks
Cement SP Water
CN 500 0 500 Sample for reference
CL1 400 100 500 20 % of LP was internally
mixed
CL2 400 100 400 20 % of LP was externally
mixed
CQ 400 100 400 20 % of QP was externally
mixed
CG 400 100 400 20 % of GP was externally
mixed
The first exothermal peak enlarged
0 200 400 600 800 1000
0 2 4 6 8 10 12 14 16 18
Heat flow(mW)
Time(s)
cn CL1 CL2 CQ CG
CN(200.5s)
CG(272.7s) CQ(236.6s) CL1(200.5s)
CL2(200.5s)
The second exothermal peak enlarged
25000 30000 35000 40000 45000 50000
1.8 1.9 2.0 2.1 2.2 2.3 2.4 2.5 2.6 2.7 2.8
Heat flow(mW)
Time(s)
CN:8h56min
CG:11h19min CL2:8h37min
CQ:8h57min
CL1:8h48min
CN:13h
Exothermal curve
0 20000 40000 60000 80000 100000
-2 0 2 4 6 8 10 12 14 16 18
Heat flow(mW)
Time(s) cn CL1 CL2 CQ CG
(a)
(b)
(c)
There is another small peak appeared at 780 min in the exothermal curve of the CN sample in Fig.2c, however, the peak cannot be observed in the other samples with SPs. The peak is formed by the transformation of AFt to AFm, therefore, the transformation is prevented by the SPs.
3.3 Influence of SPs on the Hydration Products
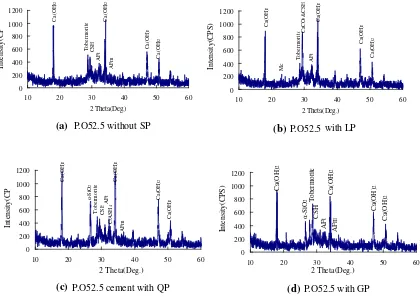
Different samples were prepared to study the influence of SPs on the hydration products of cement, and 220 g of water and 500 g of powders were used in every sample. The first sample is cement of 100 %, and the other three samples are that the cement is replaced by 10 % by quality by the LP, the QP, and the GP, respectively. The XRD patterns are shown in Fig.3.
It can be concluded through comparing Fig.3a, b that the LP induces the formation of C3ACaCO311H2O, which is shown at 2hof 23°in Fig.3b and the influence of the LP on the hydration of tricalcium silicate is unclear because of the peak overlapping of hydrated calcium silicate and calcium carbonate. The QP induces the appearance of peaks of C3ASH4in Fig.3c, which indicates the formation of a new
phase. It can be seen from Fig.3d that the peak intensity of Tobermorite is strengthened by the GP, which shows that the amount of Tobermorite is more when the GP is mixed.
4. Conclusions
The influences of the SPs on basic performances and hydration of portland cement were comparatively studied, and the following conclusions are as follow.
(1) The normal consistency increases as the content of SP increases. The initial setting time and final setting time both shortens when the content of LP is 5 %, and they slightly delays because of the QP and the GP.
(2) The LP has no effect on the arrival time of the first peak in the exothermal curve, however, the peak value decreases. The arrival time of the first peak postpones and the peak value also decreases because of the GP and the QP. The second peak shifts it position to the left when the LP is mixed, the QP has no obvious influence on the peak posi-tion, however, the peak is delayed by 143 min by the GP.
(3) The LP induces the formation of hydrated calcium carboaluminate, the QP the formation of hydrated garnet, and the GP makes the amount of Tobermorite greater.
Acknowledgments
This research is funded by the National Natural Science Foundation of China (No. 51274088 and No. 50908076) and Major Scientific Projects of Shanxi Province (No. 20121101002).
Open Access
This article is distributed under the terms of the Creative Commons Attribution License which permits any use, distribution, and reproduction in any medium, provided the original author(s) and the source are credited.
P.O52.5 without SP 0 200 400 600 800 1000 1200
10 20 30 40 50 60
2 Theta(Deg.) Intensity(C P Ca (O H ) 2 Ca (O H ) 2 Ca (O H ) 2 To b e rm o ri te CS H AF t AF m Ca (O H ) 2
P.O52.5 with LP 0 200 400 600 800 1000 1200
10 20 30 40 50 60
2 Theta(Deg.) Intensity(CPS) Ca (O H ) 2 Ca (O H ) 2 Ca (O H ) 2 Ca CO 3 &C S H T o be rm or it e AF t Mc Ca (O H ) 2
P.O52.5 cement with QP 0 200 400 600 800 1000 1200
10 20 30 40 50 60
2 Theta(Deg.) Intensity(CP Ca (O H ) 2 Ca (O H ) 2 Ca (O H ) 2 α -S iO 2 To b er m o ri te CS HAF t C 3 AS H 4 AF m Ca (O H ) 2
P.O52.5 with GP 0 200 400 600 800 1000 1200
10 20 30 40 50 60
2 Theta(Deg.) Intensity(CPS) Ca (O H ) 2 Ca (O H ) 2 Ca (O H ) 2 T obe rm or it e CS H α -S iO 2 AF t AF
m Ca(
OH)
2
(a)
(b)
(c)
(d)
References
Bonavetti, V., Donza, H., Mene´ndez, G., Cabrera, O., & Irassar, E. F. (2003). Limestone filler cement in low w/c concrete: A rational use of energy.Cement and Concrete Research, 33(6), 865–871.
Bonavetti, V. L., & Irassar, E. F. (1994). The effect of stone dust content in sand. Cement and Concrete Research, 24(3), 580–590.
Bonavetti, V. L., Rahhal, V. F., & Irassar, E. F. (2001). Studies on the carboaluminate formation in limestone filler-blended cements. Cement and Concrete Research, 31, 853–859. Gutteridge, W. A., & Dalziel, J. A. (1990). Filler cement: The
effect of the secondary component on the hydration of Portland cement: Part I. A fine non-hydraulic filler.Cement and Concrete Research, 20(5), 778–782.
Kakali, G., Tsivilis, S., Aggeli, E., & Bati, M. (2000). Hydration products of C3A, C3S and portland cement in the presence
of CaCO3.Cement and Concrete Research, 30, 1073–1077.
Kumar, A., Oey, T., Kim, S., Thomas, D., Badran, S., Li, J., et al. (2013a). Simple methods to estimate the influence of limestone fillers on reaction and property evolution in cementitious materials. Cement & Concrete Composites, 42, 20–29.
Kumar, A., Oey, T., Falla, G. P., Henkensiefken, R., Neithalath, N., & Sant, G. (2013b). A comparison of intergrinding and
blending limestone on reaction and strength evolution in cementitious materials. Construction and Building Mate-rials, 43, 428–435.
Li, B. X., Zhou, M.-K., Tian, J.-P., & Hu, X.-M. (2006). Effect of stone dust and fly ash on properties of C60 high per-formance concrete containing manufactured sand.Journal of Building Materials, 9(4), 381–387 (in Chinese). Oey, T., Kumar, A., Bullard, J. W., & Neithalath, N. (2013). The
filler effect: The influence of filler content and surface area on cementitious reaction rates. Journal of the American Ceramic Society, 96(6), 1987–1990.
Poppe, A.-M., & Schutter, G. D. (2005). Cement hydration in the presence of high filler contents.Cement and Concrete Research, 35(12), 2290–2299.
Runzhang, Y. (1996). Bonding materials science (in China). Wuhan, China: Wuhan University of Technology Press. Soroka, I., & Stern, N. (1976). Calcareous fillers and the
compressive strength of portland cement. Cement and Concrete Research, 6(3), 367–376.