R E S E A R C H A R T I C L E
Open Access
Evaluation of sampling strategies to estimate
crown biomass
Krishna P Poudel
1, Hailemariam Temesgen
1*and Andrew N Gray
2Abstract
Background:Depending on tree and site characteristics crown biomass accounts for a significant portion of the total aboveground biomass in the tree. Crown biomass estimation is useful for different purposes including evaluating the economic feasibility of crown utilization for energy production or forest products, fuel load assessments and fire management strategies, and wildfire modeling. However, crown biomass is difficult to predict because of the variability within and among species and sites. Thus the allometric equations used for predicting crown biomass should be based on data collected with precise and unbiased sampling strategies. In this study, we evaluate the performance different sampling strategies to estimate crown biomass and to evaluate the effect of sample size in estimating crown biomass.
Methods:Using data collected from 20 destructively sampled trees, we evaluated 11 different sampling strategies using six evaluation statistics: bias, relative bias, root mean square error (RMSE), relative RMSE, amount of biomass sampled, and relative biomass sampled. We also evaluated the performance of the selected sampling strategies when different numbers of branches (3, 6, 9, and 12) are selected from each tree. Tree specific log linear model with branch diameter and branch length as covariates was used to obtain individual branch biomass.
Results:Compared to all other methods stratified sampling with probability proportional to size estimation technique produced better results when three or six branches per tree were sampled. However, the systematic sampling with ratio estimation technique was the best when at least nine branches per tree were sampled. Under the stratified sampling strategy, selecting unequal number of branches per stratum produced
approximately similar results to simple random sampling, but it further decreased RMSE when information on branch diameter is used in the design and estimation phases.
Conclusions:Use of auxiliary information in design or estimation phase reduces the RMSE produced by a sampling strategy. However, this is attained by having to sample larger amount of biomass. Based on our finding we would recommend sampling nine branches per tree to be reasonably efficient and limit the amount of fieldwork.
Keywords:Aboveground biomass; Crown; Sampling strategies; Pacific Northwest
* Correspondence:Hailemariam.Temesgen@oregonstate.edu 1
Department of Forest Engineering, Resources, and Management, College of Forestry, Oregon State University, 280 Peavy Hall, Corvallis, OR 97331, USA Full list of author information is available at the end of the article
Background
The global issue of climate change and an increasing interest in the reduction of fossil fuel carbon dioxide emissions by using forest biomass for energy produc-tion has increased the importance of forest biomass quantification in recent years. Different national and international reports have presented the amount of carbon sequestered by forest ecosystems. For example, the Intergovernmental Panel on Climate Change reports that forests contain about 80% of aboveground and 40% of belowground carbon stock (IPCC 2007). Addition-ally, it is reported that the amount of carbon stored in dry wood is approximately 50% by weight (Brown 1986; Paladinic et al. 2009; Sedjo and Sohngen 2012).
Biomass, in general, includes both above and below ground living and dead mass of trees, shrubs, vines, and roots. However, most of the researches on biomass estimation have focused on aboveground biomass because of the difficulty in collecting belowground data (Lu 2006). The amount of biomass in a forest is influ-enced by various site factors such as stand density and site productivity; soil characteristics such as texture and moisture content; and tree characteristics such as species and age. On the other hand, distribution of crown biomass affects the carbon cycle, soil nutrient allocation, fuel accumulation, and wildlife habitat environments in terrestrial ecosystems and it governs the potential of carbon emission due to deforestation (Lu 2005). The major components of aboveground tree biomass are merchantable stem biomass (bole including bark and wood), stump biomass, foliage biomass, and branches/top biomass (Zhou and Hemstrom 2009).
The common biomass estimation approach selects some trees, which are representative of the populations of interest, for destructive sampling and weighs their components. Regression models are then fit to relate some easily measurable attributes, such as diameter at breast height and total tree height, with tree (or compo-nent) biomass. The amount of biomass distributed in different components is dependent on species and their geographic location (Pooreter et al. 2012), management practices (Tumwebaze et al. 2013) and tree size and stand density (Jenkins et al. 2003). Ritchie et al. (2013) found that for the given DBH and crown ratio, thinned stands had more foliage biomass but slightly less branch biomass than unthinned stands. Similarly, the contribu-tion of component biomass to the total aboveground biomass varies by tree size (de-Miguel et al. 2014b). Henry et al. (2011) found differences in biomass due to floristic composition, tree species and growth strategies for the tree species within a given climatic zone. Thus, the component biomass estimations, for example branch or crown biomass, bole biomass, and bark biomass, are important to account for the variability within the tree.
The common understanding among researchers and practitioners is that an accurate carbon stock estimate requires improved and consistent methods for tree and component biomass estimation (Hansen 2002; Zhou and Hemstrom 2009).
Crown biomass is the oven dry weight of the entire crown, including the leading shoot above the last-formed whorl, excluding the main bole (Hepp and Brister 1982). The components of crown biomass are wood, bark, and foliage weights. Crown biomass accounts for a significant portion of total tree biomass but the amount and its distribution vary by tree and site characteristics. Using the data from two Alaskan
Picea mariana ecosystems, Barney et al. (1978)
re-ported that foliage comprised 17% to 37% of the total tree mass for the lowland stands and 17% to 50% of the total tree mass in the upland stands. Total bole mass ranged from 11% to 58% in lowland stands and 21% to 61% in the upland stands. In a study to determine the patterns of biomass allocation in dominant and suppressed loblolly pine (Pinus taeda), Naidu et al. (1998) found that the dominant trees allocated 24.5% of biomass to the crown (13.2% in branch and 11.3% in needle) and the suppressed trees allocated 12.3% (6.7% in branch and 5.6% in needle). Kuyaha et al. (2013) found that crown biomass formed up to 26% (22% in branch and 4% in needle) of aboveground biomass in farmed eucalyptus species. In assessing the importance of crown dimensions to improve tropical tree biomass estimate, Goodman et al. (2013) found the trees in their study to have nearly half of the total aboveground tree biomass in branches (44% ± 2%).
Estimates of crown biomass for each stand condition is necessary to understand nutrient depletion and for evaluating the economic feasibility of crown utilization for energy production or forest products (Hepp and Brister 1982). Furthermore, estimates of crown biomass aid in fuel load assessments and fire management strat-egies (He et al. 2013) because it is one of the important input variables in most wildfire models (Saatchi et al. 2007). Much of the focus in estimating crown biomass has been in the form of regression models and in the selection of predictor variables rather than in the methods of sample selection. In addition, comparisons of sampling strategies have been carried out mainly for foliar biomass sampling rather than the total crown (branch wood, bark, and foliage) biomass. Thus, the evaluation of different sampling designs and sample size in estimating crown biomass is an important aspect of aboveground biomass estimation.
is determined by the availability of funds, required accuracy, structure and composition of vegetation, and desired specificity of estimation (Catchpole and Wheeler 1992). Additionally, the amount of time a particular technique takes to implement in the field is also important. The simple random sampling is generally used as the basis to evaluate the performance of other sampling designs (e.g. Snowdon 1986; Temesgen 2003).
Gregoire et al. (1995) have proposed a number of sam-pling procedures (randomized branch samsam-pling, import-ance sampling, control-variate sampling, two-stage and three-stage sampling) that can be used to estimate foliage and other characteristics of individual trees. The random-ized branch sampling (RBS) was originally introduced by Jessen (1955) to determine the fruit count on orchard trees. Valentine and Hilton (1977) used this method to obtain estimates of leaf counts, foliar area, and foliar mass
of mature Quercus species. Good et al. (2001) have
employed RBS with importance sampling for estimating tree component biomass. Since the sample is accumulated sequentially along the path, RBS does not require locating and counting the total number of branches beforehand. However, Chiric et al. (2014) posed some doubts on the ef-fectiveness of RBS in sampling big trees or trees with ir-regular forms. According to Valentine and Hilton (1977), the accuracy of RBS is largely dependent on the probabil-ity assignment and the time required to take RBS samples depends on the size of the trees and experience of those taking the samples.
Swank and Schreuder (1974) compared stratified two-phase sampling, two-two-phase sampling with a regression estimator, and two-phase sampling with a ratio-of-means estimator. They found the stratified two-phase sampling as the most precise and appropriate method for estimat-ing surface area and biomass for a young eastern white pine forest. Temesgen (2003) found that stratified random sampling produced the lowest mean squared error value in comparing five sampling designs to quan-tify tree leaf area. Stratification in branch biomass sampling can be done in many different ways. Snowdon (1986) showed improved accuracy of estimates by strati-fication based on crown position compared to those obtained by simple random sampling, especially at low sampling intensities. Their findings suggest that stratifi-cation by whorl was slightly but not significantly inferior to stratification based on crown position or branch diameter. Another approach used in selecting branches for estimating crown biomass is to divide the bole into sections and pile up the branches from each section into different size classes and randomly select a number of branches proportional to the total number of branches in each size class (e.g. Harrison et al. 2009, Devine et al. 2013). In an evaluation of ten different sampling strategies, Temesgen et al. (2011) found that systematic sampling
with ratio estimation as the most efficient estimate of individual tree foliage biomass. de-Miguel et al. (2014a) developed generalized, calibratable, mixed-effects meta-models for large-scale biomass prediction. One of their objectives was to investigate and demonstrate how the biomass prediction differed when calibration trees were selected using different sampling strategies. They found that a stratified sampling was better compared to the simple random sampling. Thus there is no strong rationale to support one method as being superior to another.
Crown biomass is difficult to predict because of the vari-ability within and among species and various sites. A good allometric equation for predicting aboveground biomass should be based on data collected with an appropriate (precise and unbiased) sampling method. In this context, the objective of this study was to evaluate different sampling strategies to estimate crown biomass. We also evaluated how the performance of different methods was affected when different number of branches (3, 6, 9, and 12) per tree was sampled in estimating crown biomass.
Methods
Study area
This study was conducted in the McDonald-Dunn Forest, an approximately 4,550 ha property, managed by the Oregon State University in the western of the edge of the Willamette Valley in Oregon and on the eastern foothills of the Coast Range (123°15' W, 44°35' N, 120 m elevation). The forest consists predominantly of the Douglas-fir (Pseudotsuga menziesii(Mirbel) Franco) and a small Grand fir (Abies grandis(Dougl. ex D. Don) Lindl.) and has a wide range of overstory age-class distribution with majority of the stands less than 80 years old and some stands that are 80 to 120 years old. The forest receives approximately 110 cm of annual rainfall and aver-age annual temperature ranges from 6°C to 17°C.
Data
For the first and every third branch, when proceeding from the base, in each diameter class, length and weight of both live and dead branches were recorded. From those selected branches, four branches per diameter class were weighed with and without foliage. The nee-dles were removed in the field to obtain the green weight of foliage and branch wood with bark. Two of these four branches were taken to the lab, keeping branch and foliage in separate paper bags, for drying. The branches were chipped in to small pieces to exped-ite the drying process and placed in a kiln for drying at 105°C. The oven dry weight was recorded by tracking the weight lost by each sample until no further weight was lost. Table 1 presents the tree and branch level sum-mary of the felled-tree data used in this study.
Individual branch biomass
Kershaw and Maguire (1995) developed a tree specific log linear model (Equation 1) using branch diameter (BD) and depth into the crown (DINC: the distance from tip to the base of the branch) as covariates to esti-mate branch foliage biomass. Temesgen et al. (2011) successfully used this model in comparing sampling strategies for tree foliage biomass estimation.
ln yij ¼β0iþβ1iln BDij
þβ2iln DINCij
þεij ð1Þ
This model was modified by replacing DINC with branch length (Equation 2). The modified model provided
the best fit (Adj-R2= 0.93), therefore was used to predict individual branch biomass within each tree.
ln yij ¼β0iþβ1iln BDij
þβ2iln BLij
þεij ð2Þ
whereyij,BDijandBLijare oven dry weight (kg) of branch (wood, bark, and foliage combined), branch diameter (cm), and branch length (m) of thejthbranch onithtree respectively; βij ‘s are regression parameters to be esti-mated; ln(·) is the natural logarithm; andεij‘s are the ran-dom error. The full model included other variables such as height to the base of the branch, crown width and crown length, but were dropped because they were not statistically significant (p-value > 0.05). Lengths for the 2/3rdbranches (not measured in the field) were obtained by fitting the following log linear model (Adj-R2= 0.74):
ln BLij
¼β0iþβ1iln BDij
þβ2iln RBDij
þεij ð3Þ
whereBDij,BLij,andεijare same as defined in Equation2 andRBDijis the relative branch depth (relative position of the subject branch from the crown base) ofjthbranch inith tree and is computed as follows (Ishii and Wilson2001):
RBD¼ total tree height−height to the base of subject branch
total tree height−height to the base of lowest live branch
The RBD is 1.0 for the first live branch. The logarith-mic regressions are reported to result in a negative bias when data are back transformed to arithmetic scale. The commonly used remedy to this is to multiply the back transformed results by a correction factor exp MSE
2
,
where MSE is the mean squared error obtained by the
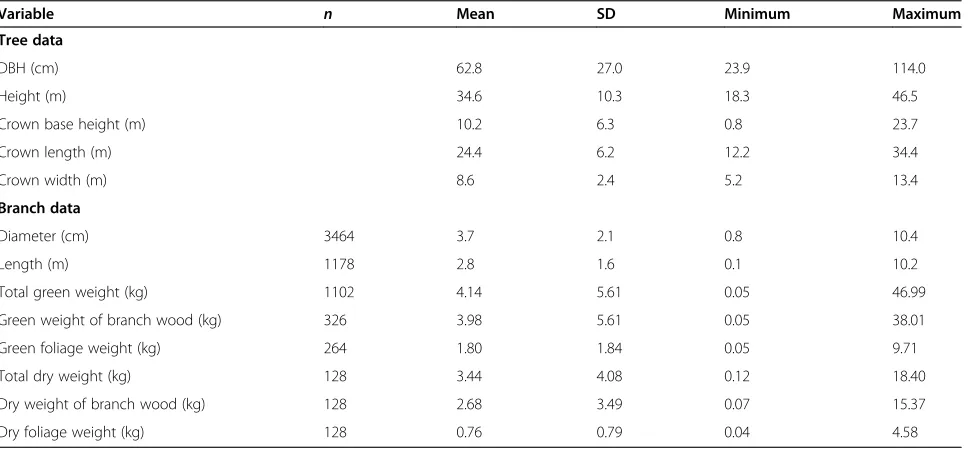
Table 1 Summary of felled-tree and branch-level attributes used in this study
Variable n Mean SD Minimum Maximum
Tree data
DBH (cm) 62.8 27.0 23.9 114.0
Height (m) 34.6 10.3 18.3 46.5
Crown base height (m) 10.2 6.3 0.8 23.7
Crown length (m) 24.4 6.2 12.2 34.4
Crown width (m) 8.6 2.4 5.2 13.4
Branch data
Diameter (cm) 3464 3.7 2.1 0.8 10.4
Length (m) 1178 2.8 1.6 0.1 10.2
Total green weight (kg) 1102 4.14 5.61 0.05 46.99
Green weight of branch wood (kg) 326 3.98 5.61 0.05 38.01
Green foliage weight (kg) 264 1.80 1.84 0.05 9.71
Total dry weight (kg) 128 3.44 4.08 0.12 18.40
Dry weight of branch wood (kg) 128 2.68 3.49 0.07 15.37
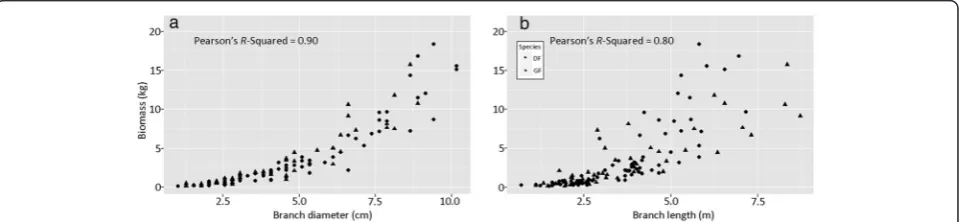
least-squares regression. However, there are conflicting remarks about the correction factor itself. For example Beauchamp and Olson (1973) and Flewelling and Pienaar (1981) suggested that this correction factor was still biased because the sample variance is consistent but it is biased for finite sample sizes. We did not use the correction factor in our study. The trend in the relationship between crown biomass and branch diameter and length was similar but the variability in biomass increased with increasing branch length (Figure 1). All statistical procedures were performed using statistical software R (R Core Team 2014).
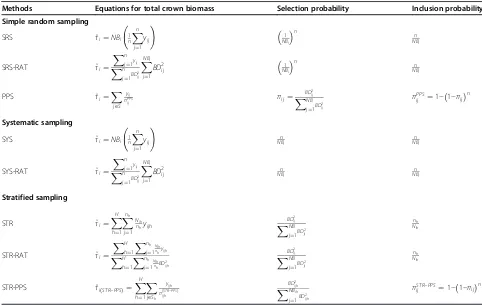
Methods for crown biomass sampling
We evaluated 11 sampling methods to select branches for estimating crown biomass. The 11 sampling strategies belonged to three main categories: simple random sampling, systematic sampling, and stratified sampling. Methods 1 and 2 are based on simple random sampling (SRS) strategy. In each of these methods, each branch was chosen randomly such that each individual branch has equal probability of selection at any stage of selection. The difference in these methods is in the estimation of total tree biomass: method 1 uses SRS estimator while method 2 (SRS-RAT) uses the ratio estimator with squared branch diameter as auxiliary information. Method 1 is also the basis for comparing the performance of other methods.
Method 3, probability proportional to size (PPS), uses branch size as auxiliary information in sample selection. Total crown biomass in this method was calculated using Horvitz-Thompson estimator (Horvitz and Thompson 1952). Methods 4 (SYS) and 5 (SYS-RAT) are systematic sampling with similar design phase but different estima-tion phase. Method 4 uses the SRS estimator while method 5 uses the ratio estimator. The fractional inter-val systematic sample selection procedure was used in the systematic selection of the branches because it ensures the equal probability of selection for all the branches (Temesgen et al. 2011). The interval was determined based on the total number of branches in each tree. In fractional interval systematic sample
selection, first a random starting point between 1 and total number of branches was randomly chosen, the interval then is added obtaining exactly n(sample size) branches. Then the numbers are divided by the sample size and rounded to the nearest whole number to get the selected samples.
Methods 6–11 belonged to different stratified sampling strategies. The stratified sampling method divides the popu-lation into subpopupopu-lations of size nh, where nh is the
number of elements in stratumh. The total crown length was divided into three sections having equal number of branches as three strata. In methods 6 (STR) and 7 (STR-RAT), n/3 branches were randomly selected with equal probability, wherenis the sample size. Again, the difference between these two methods lies in the estimation of total crown biomass. STR method uses the SRS estimation tech-nique while STR-RAT method uses the ratio estimation technique to obtain the total crown biomass. Method 8 (STR-PPS), stratified sampling with PPS, selected branches in each stratum with probability proportional to the square of branch diameter. Total crown biomass in this method was obtained by summing the stratum total crown biomass calculated using Horvitz-Thompson unequal probability estimator (Horvitz and Thompson 1952).
Methods 9–11 (stratified, unequal) are based on the idea that the distribution of crown biomass in different strata depends on the relative position of the branches in the tree. Ishii and McDowell (2001) found that mean branch volume increased from upper- to lower-crown. For a given density, biomass (oven dry weight) is the function of volume. Therefore, the stratified sampling method was modified to incorporate the variability of biomass distribu-tion within a tree. Trees were first divided into three sec-tions having equal number of branches. Then, 4, 3, and 2 branches from the lower, middle, and upper section of the trees were selected respectively. This corresponds that the number of branches selected in each section is propor-tional to the observed biomass in that section of the tree. Because stratification based on crown length resulted in the biased estimation of crown biomass, the balanced stratification method was applied. The total number of
branches selected in each tree (nine) was determined based on the amount of biomass sampled. Total crown biomass in each stratum was computed using the SRS estimation technique in method 9 STR), PPS in method 10 (Un-PPS), and ratio estimation in method 11 (Un-STRRAT). Total crown biomass in each tree was computed by sum-ming the crown biomass in each stratum. The unequal branch selection strategy was also evaluated using similar evaluation statistics used for the other eight methods.
Performances of first eight methods were evaluated by selecting four different sample sizes (3, 6, 9, and 12) in each tree. These sample sizes were chosen for the ease of distributing samples into three different strata in stratified
sampling with equal number of branches per stratum. Methods 9–11 were based on selecting nine branches in each tree. Table 2 summarizes the inclusion probability, selection probability, and the estimator of the total crown biomass in each of the sampling strategies evaluated in this study.
Evaluation of sampling strategies
We evaluated the performance of 11 sampling strategies to estimate crown biomass using the following six statistics estimated from 5,000 iterations. These measures were suc-cessfully used to evaluate the performance of sampling strat-egies to estimate foliage biomass in Temesgen et al. (2011). Table 2 Summary of methods used for crown biomass estimation in this study
Methods Equations for total crown biomass Selection probability Inclusion probability
Simple random sampling
SRS ^τi¼NBi 1
n
Xn
j¼1
yij ! 1 NBi n n NBi
SRS-RAT ^τi¼
Xn j¼1yij Xn
j¼1BD
2
ij XNBi
j¼1
BD2ij NB1i
n
n NBi
PPS ^τi¼
X
j∈S yij πPPS
ij πij¼
BD2
ij XNB
j¼1BD
2
ij
πPPS
ij ¼1− 1−πij
n
Systematic sampling
SYS ^τi¼NBi 1n
Xn
j¼1
yij ! n NBi n NBi
SYS-RAT ^τi¼
Xn j¼1yij Xn
j¼1BD
2
ij XNBi
j¼1
BD2ij NBni
n NBi
Stratified sampling
STR ^τi¼
XH
h¼1 Xnh
j¼1
Nih
nhyijh
BD2
ij XNB
j¼1BD
2
ij
nh
Nih
STR-RAT ^τi¼
XH h¼1
Xnh
j¼1 Nih nhyijh XH
h¼1 Xnh
j¼1NihnhBD2ijh
BD2
ij XNB
j¼1BD
2
ij
nh
Nih
STR-PPS ^τi STRð −PPSÞ¼ XH
h¼1 X
j∈Sh
yijh πðSTR−PPSÞ
ijh
BD2
ijh XNBih
j¼1BD
2
ijh
πST R−PPS
ij ¼1−1−πij
n
Notation:^τiis the estimated total crown biomass forith
tree;yijis the oven dry weight ofjth
branch onith
tree;NBiis the number of branches onith
tree;nis
number of branches sampled;Nihis the number of branches inhthstratum onithtree; andnhis the number of branches sampled inhthstratum.
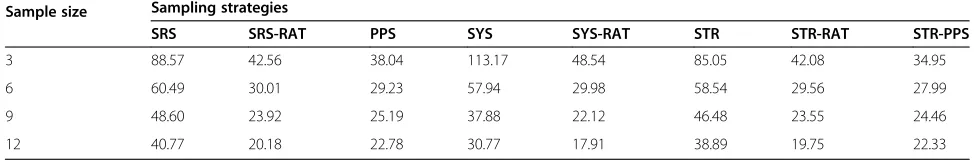
Table 3 Average bias (kg) produced by different sampling methods and sample sizes based on 5,000 simulations
Sample size Sampling strategies
SRS SRS-RAT PPS SYS SYS-RAT STR STR-RAT STR-PPS
3 0.237 −4.091 −0.158 0.433 −9.320 −0.659 −3.554 −0.104
6 0.215 −1.711 0.010 0.139 −1.922 0.399 −1.387 −0.101
9 −0.081 −0.937 −0.068 0.133 0.166 0.191 −0.857 −0.094
1. Bias:For each tree the bias (kg) was calculated as the mean difference between observed and predicted total crown biomass for that tree as follows:
Bi¼ 1 5000
X
5000
s¼1
τis−^τis
ð Þ
whereτisand^τisare the observed and predicted
total crown biomasses forithtree insthiteration,
respectively.
2. Relative bias:Relative bias percentage is the ratio of bias to the total observed crown biomass for that tree and computed as follows:
RBi¼ 1 5000
X5000
s¼1
τis−^τis
ð Þ
τis
where all the variables are same as defined previously.
3. Root mean square error (RMSE):
RMSEi¼
ffiffiffiffiffiffiffiffiffiffiffiffiffiffiffiffiffiffiffiffiffiffiffiffiffiffiffiffiffiffiffiffiffiffiffi 1
5000 X
5000
s¼1
τis−τ^is
ð Þ2
v u u t
4. Relative RMSE:
R−RMSEi¼
ffiffiffiffiffiffiffiffiffiffiffiffiffiffiffiffiffiffiffiffiffiffiffiffiffiffiffiffiffiffiffiffiffiffiffiffiffiffiffi 1
5000 X5000
s¼1
τis−^τis τis
2
v u u t
5. Biomass sampled (BS):Amount of cost for crown
biomass estimation is directly proportional to the
amount of crown biomass sampled. Therefore the amount of crown biomass sampled was also used as a criterion for the evaluation of sampling strategies. The amount of crown biomass sampled (sampling intensity) is calculated as follows:
BSi¼ 1 5000
X
5000
s¼1
X
j∈S yijs
yijsis the observed total crown biomasses forithtree,
jth
sample branch insthiteration.
6. Relative biomass sampled (RBS%)indicates the
proportion of crown biomass sampled with respect to the total crown biomass measured and is calculated as follows:
RBSij¼ 1 5000
X5000
s¼1
X
j∈S yijs τijs
Results and discussions
Except for the ratio estimators, the estimators of popula-tion totals were unbiased, with biases close to zero for all sample sizes (Tables 3 and 4). The squared bias for these methods ranged from zero to 0.435 kg. Ratio esti-mators resulted in greater bias than the other methods. The absolute bias of the ratio estimators decreased with increasing sample size as expected.
As expected, the RMSE (and relative RMSE) decreased with increasing sample size (Tables 5 and 6) for all sam-pling strategies. Based on the RMSE values obtained from 5,000 simulations, the stratified sampling with PPS estimation was the superior method compared to Table 4 Relative bias (percent) produced by different sampling methods and sample sizes based on 5,000 simulations
Sample size Sampling strategies
SRS SRS-RAT PPS SYS SYS-RAT STR STR-RAT STR-PPS
3 0.101 −2.437 −0.169 0.107 −6.086 −0.321 −2.107 −0.034
6 −0.001 −1.115 0.024 0.061 −1.061 0.197 −0.900 −0.012
9 0.063 −0.600 −0.027 0.038 0.033 0.148 −0.543 −0.069
12 −0.011 −0.523 0.100 0.037 0.032 −0.035 −0.439 −0.040
Table 5 Average RMSE produced by different sampling methods and sample sizes based on 5,000 simulations
Sample size Sampling strategies
SRS SRS-RAT PPS SYS SYS-RAT STR STR-RAT STR-PPS
3 88.57 42.56 38.04 113.17 48.54 85.05 42.08 34.95
6 60.49 30.01 29.23 57.94 29.98 58.54 29.56 27.99
9 48.60 23.92 25.19 37.88 22.12 46.48 23.55 24.46
all other methods when sample size is 3 or 6 branches per tree. However, while using PPS, stratification of the crown into sections did not reduce the RMSE and relative RMSE significantly. On the other hand, when at least nine branches per tree were sampled, the SYS-RAT was the best and the SRS-RAT was the second best method. Number of branches required to achieve desired preci-sion is another important aspect of estimating crown biomass. On average, the RMSE decreased by 34.3% when the sample size increased from three branches per tree to six branches per tree. The RMSE further decreased by 22.1% and 15.4% when the sample size increased from 6 to 9 and 9 to 12 respectively.
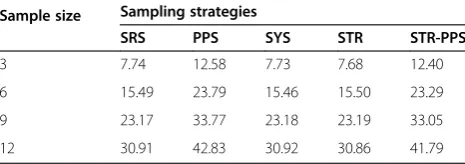
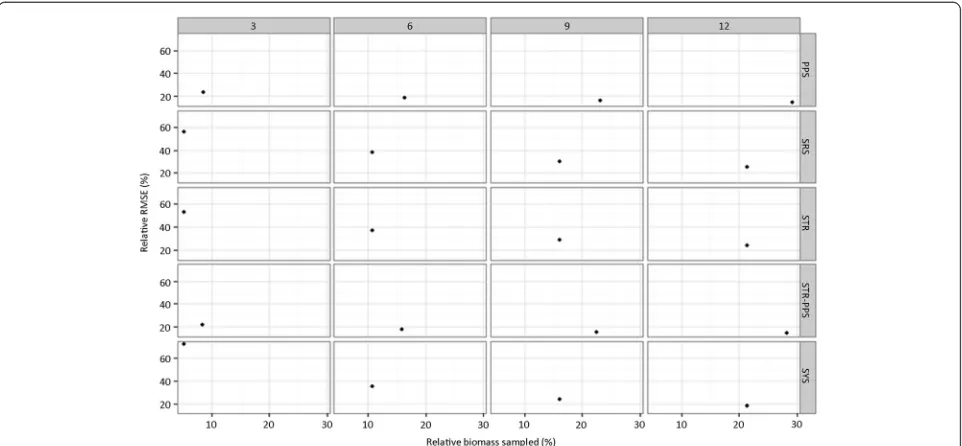
The amount of biomass sampled determines the cost that would be incurred in estimating crown biomass. Biomass sampled and relative biomass sampled in differ-ent sampling strategies are presdiffer-ented in Tables 7 and 8. The Strategy-Cost-Accuracy graph (Figure 2) shows the efficiency trade-off across the strategies compared in the study. The SRS and SYS methods resulted in the lowest amount of biomass sampled. On average, the amount of biomass sampled using the PPS method was 1.6, 1.5, 1.4, and 1.4 times higher than the amount of biomass sampled in stratified random sampling when 3, 6, 9, and 12 branches per tree were selected respectively.
On average, selecting 12 instead of 9 branches per tree increased the amount of biomass sampled by 29.2%. Therefore, nine branches in each tree were selected in evaluating the performance of unequal stratified sam-pling strategy. Results from unequal branch selection are presented in Table 9. This strategy reduced the relative RMSE by 0.6%, 4.5% and 3.5% compared to selecting 9 branches using stratified random sampling, stratified sampling with ratio estimation, and stratified sampling with PPS respectively. This reduction in relative RMSE
is obtained by sampling just a little more amount of biomass (1.03 times on average).
Use of allometric equations is inevitable in above-ground biomass estimation because weighing the trees and their components for direct biomass determination is destructive and prohibitively expensive. Choice of biomass sampling strategy determines the quality of data available for fitting such equations. Use of auxiliary information in design and/or estimation phase (ratio estimation and PPS) produced better results in terms of RMSE compared to the methods that do not make use of such information in this study. Previous researches (e.g. Temesgen et al. 2011) have also shown the benefits from using auxiliary information in the design and/or estimation concerning tree biomass.
The model used in estimating branch biomass which is later used as a dependent variable in the test popula-tion, was a logarithmic model (Equation 2). There is an inherent negative bias in this method because the dependent variable is transformed prior to estimation (Snowdon 1991). The ratio estimation strategies, SRS-RAT, SYS-SRS-RAT, and STR-RAT in this study, were nega-tively biased. However, in terms of RMSE, these strategies were clearly superior methods compared to the SRS approach. As noted in Temesgen et al. (2011), however, the efficiency of sampling strategies with ratio estimation may be affected by the amount of work and difficulty in implementing these techniques in the field.
The amount of biomass sampled determines the cost that would be incurred in estimating crown biomass. Choice of a sampling strategy determines the amount of biomass and relative biomass sampled. This ultimately determines the amount of time and cost required for a biomass estimation project. The SRS and SYS methods resulted in the lowest amount of biomass sampled. Our Table 6 Relative RMSE percent produced by different sampling methods and sample sizes based on 5,000 simulations
Sample size Sampling strategies
SRS SRS-RAT PPS SYS SYS-RAT STR STR-RAT STR-PPS
3 55.70 25.72 23.46 72.02 28.80 53.41 25.61 21.57
6 38.07 17.93 18.23 35.23 17.53 36.63 17.78 17.59
9 30.38 14.19 15.83 23.58 13.29 29.03 14.07 15.55
12 25.42 11.92 14.40 18.37 11.11 24.27 11.76 14.22
Table 7 Amount of biomass sampled (kg) by different sampling strategies and sample sizes
Sample size Sampling strategies
SRS PPS SYS STR STR-PPS
3 7.74 12.58 7.73 7.68 12.40
6 15.49 23.79 15.46 15.50 23.29
9 23.17 33.77 23.18 23.19 33.05
12 30.91 42.83 30.92 30.86 41.79
Table 8 Relative amount of biomass sampled (%) by different sampling strategies and sample sizes
Sample size Sampling strategies
SRS PPS SYS STR STR-PPS
3 5.36 8.67 5.35 5.33 8.45
6 10.71 16.37 10.71 10.72 15.87
9 16.08 23.16 16.06 16.07 22.45
results in terms of RMSE values reported and the amount of biomass sampled by each strategy are consistent with the findings of Temesgen et al. (2011) in estimating foliar biomass of Douglas-fir (Pseudotsuga menziesii var.
menziesii) and ponderosa pine (Pinus ponderosa).
Conclusions
Crown biomass estimation is a complex process that re-quires intensive manual field work involving destructive sampling. The amount of fieldwork required and the ac-curacy of biomass estimation is dependent on the sam-pling strategy used. Furthermore, the accuracy of the estimation can be improved by adopting appropriate techniques in both the design and estimation phases, beginning with the selection of sample plots and sample trees through model development. In this study, we evaluated 11 different sampling strategies that belonged to three main categories: simple random sampling, systematic sampling and stratified sampling. The SRS, PPS, and ratio estimation techniques were used to obtain the total crown biomass in each tree.
Based on the RMSE values obtained from 5,000 simu-lations, the stratified sampling with PPS estimation pro-duced better results as compared to all other methods when 3 or 6 branches per tree were sampled. However,
the SYS-RAT was the best and the SRS-RAT was the second best method when at least nine branches per tree were sampled. It should also be noted that the lower RMSE values in the PPS estimation techniques are obtained with an increased amount of biomass sampled in each tree. On the other hand, if the auxiliary information on branch size is not used, the systematic sampling pro-vided better results than the SRS or STR method when at least 6 branches per trees were selected. Thus the selection of a specific sampling strategy is dependent on the availability of the time and cost for the given biomass sampling project. Based on our finding we would recommend sampling 9 branches per tree to obtain reasonable efficiency and amount of work in-volved in the field.
The logic for selecting unequal numbers of branches per stratum within a tree is justified by the fact that the biomass distribution within a tree is not uniform. Select-ing equal branches per stratum produced approximately similar results to unequal sampling when the SRS esti-mation technique was used. However, making use of auxiliary information on branch size in the design and estimation phases further decreased the relative RMSE. Once again, the decreased RMSE by use of auxiliary in-formation is attained by having to sample slightly higher
Figure 2Relative RMSE (%) produced Vs. relative biomass sampled (percent of total crown mass) in different sampling strategies and sample sizes.
Table 9 Evaluation statistics produced when selecting 4, 3, and 2 branches from lower, middle, and upper stratum
Method Bias Relative bias RMSE Relative RMSE Biomass sampled Relative biomass sampled
Un-STR 0.100 0.061 46.16 28.87 24.25 16.87
Un-STRRAT −0.731 −0.491 22.58 13.44
amount of biomass. Findings of this study should prove beneficial for the stakeholders working in the field of aboveground biomass and carbon estimation. Additional work using the data from different species and location should be done to further validate the findings in this study.
Competing interests
The authors declare that they have no competing interests.
Authors’contributions
KP designed the sampling experiments, performed the sampling experiments, analyzed the data, and wrote the paper. TH conceived the sampling experiments, critically reviewed the manuscript, contributed to coding and data analysis, and edited the manuscript. AG critically reviewed the manuscript, edited the manuscript and contributed ideas at all phases of the project. All authors read and approved the final manuscript.
Acknowledgements
We thank Professors Lisa Madsen and Glen Murphy (both at Oregon State University) for their insights and comments on an earlier draft, and the Forest Inventory Analysis Unit for funding the data collection and analysis phases of this project.
Author details
1Department of Forest Engineering, Resources, and Management, College of Forestry, Oregon State University, 280 Peavy Hall, Corvallis, OR 97331, USA. 2USDA Forest Service, PNW Research Station, 3200 SW Jefferson Way, Corvallis, OR 97331, USA.
Received: 15 August 2014 Accepted: 17 December 2014
References
Barney RJ, Vancleve K, Schlenter R (1978) Biomass distribution and crown characteristics in two Alaskan Picea mariana ecosystems. Can J For Res 8:36–41
Beauchamp JJ, Olson JS (1973) Corrections for bias in regression estimates after logarithmic transformation. Ecology 54(6):1403–1407
Brown S (1986) Estimating Biomass and Biomass Change of Tropical Forests: A Primer. FAO Forestry Paper 134. Food and Agriculture Organization of the United Nations, Rome
Catchpole WR, Wheeler CJ (1992) Estimating plant biomass: a review of techniques. Aust J Ecol 17:121–131
Chiric G, Puletti N, Salvati R, Arbi F, Zolli C, Corona P (2014) Is randomized branch sampling suitable to assess wood volume of temperate broadleaved old-growth forests? For Ecol Manag 312:225–230
R Core Team (2014) R: A language and environment for statistical computing. R Foundation for Statistical Computing, Vienna, Austria. http://www.R-project.org/ de-Miguel S, Mehtatlo L, Durkaya A (2014a) Developing generalized, calibratable, mixed-effects meta models for large-scale biomass prediction. Can J For Res 44:648–656, a or b
de-Miguel S, Pukkala T, Assaf N, Shater Z (2014b) Intra-specific difference in allometric equations for aboveground biomass of eastern Mediterranean Pinus brutia. Ann For Sci 71:101–112, a or b
Devine WD, Footen PW, Harrison RB, Terry TA, Harrington CA, Holub SM, Gould PJ (2013) Estimating Tree Biomass, Carbon, and Nitrogen in two Vegetation Control Treatments in an 11-Year-old Douglas-fir Plantation on a Highly Productive Site. Res. Pap. PNW-RP-591. U.S. Department of Agriculture, Forest Service, Pacific Northwest Research Station, Portland, OR, p 29
Flewelling JW, Pienaar LV (1981) Multiplicative regression with lognormal errors. For Sci 27(2):281–289
Good NM, Paterson M, Brack C, Mengersen K (2001) Estimating tree component biomass using variable probability sampling methods. J Agric Biol Environ Stat 6(2):258–267
Goodman RC, Phillips OL, Baker TR (2013) The importance of crown dimensions to improve tropical tree biomass estimates. Ecol Appl. http://dx.doi.org/ 10.1890/13-0070.1
Gregoire TG, Valentine HT, Furnival GM (1995) Sampling methods to estimate foliage and other characteristics of individual trees. Ecology 76(4):1181–1194
Hansen M (2002) Volume and biomass estimation in FIA: national consistency vs. regional accuracy. In: McRoberts RE, Reams GA, Van Deusen PC, Moser JW (eds) Proceedings of the third annual Forest Inventory and Analysis symposium. General Technical Report NC-230. U.S. Department of Agriculture, Forest Service, North Central Research Station, St. Paul, MN, pp 109–120
Harrison RB, Terry TA, Licata CW, Flaming BL, Meade R, Guerrini IA, Strahm BD, Xue D, Lolley MR, Sidell AR, Wagoner GL, Briggs D, Turnblom EC (2009) Biomass and stand characteristics of a highly productive mixed Douglas-Fir and Western Hemlock plantation in Coastal Washington. West J Appl For 24(4):180–186
He Q, Chen E, An R, Li Y (2013) Above-ground biomass and biomass components estimation using LiDAR data in a coniferous forests. Forests 4:984–1002 Henry M, Picard N, Trotta C, Manlay RJ, Valentini R, Bernoux M, Saint-André L
(2011) Estimating tree biomass of sub-Saharan African forests: a review of available allometric equations. Silva Fenn 45(3B):477–569
Hepp TE, Brister GH (1982) Estimating crown biomass in loblolly pine plantations in the Carolina Flatwoods. For Sci 28(1):115–127
Horvitz DG, Thompson DJ (1952) A generalization of sampling without replacement from a finite universe. J Am Stat Assoc 47:663–685
IPCC (2007) Climate change 2007: synthesis report. In: Core Writing Team, Pachauri RK, Reisinger A (eds) Contribution of working groups I, II and III to the fourth assessment report of the intergovernmental panel on climate change. IPCC, Geneva, Switzerland, p 104
Ishii H, McDowell N (2001) Age-related development of crown structure in coastal Douglas-fir trees. For Ecol Manag 169:257–270
Ishii H, Wilson ME (2001) Crown structure of old-growth Douglas-fir in the western Cascade Range, Washington. Can J For Res 31:1250–1261
Jenkins CJ, Chojnacky DC, Heath LS, Birdsey RA (2003) National-scale biomass estimators for United States tree species. For Sci 49(1):12–35
Jessen RJ (1955) Determining the fruit count on a tree by randomized branch sampling. Biometrics 11(1):99–109
Kershaw JA, Maguire DA (1995) Crown structure in Western hemlock, Douglas-fir, and grand fir in western Washington: trends in branch-level mass and leaf area. Can J For Res 25:1897–1912
Kuyaha S, Dietz J, Muthuri C, Noordwijk MV, Neufeldt H (2013) Allometry and partitioning of above- and below-ground biomass in farmed eucalyptus species dominant in Western Kenyan agricultural landscapes. Biomass Bioenergy 55:276–284
Lu D (2005) Aboveground biomass estimation using Landsat TM data in the Brazilian Amazon. Int J Remote Sens 26(12):509–2525
Lu D (2006) The potential and challenge of remote sensing-based biomass estimation. Int J Remote Sens 7:1297–1328
Naidu SL, DeLucia EH, Thomas RB (1998) Contrasting patterns of biomass allocation in dominant and suppressed loblolly pine. Can J For Res 28:1116–1124
Paladinic E, Vuletic D, Martinic I, Marjanovic H, Indir K, Benko M, Novotny V (2009) Forest biomass and sequestered carbon estimation according to main tree components on the forest stand scale. Period Biol 111(4):459–466
Pooreter H, NIklas KJ, Reich PB, Oleksyn J, Poot P, Mommer L (2012) Biomass allocation to leaves, stems and roots: meta-analyses of interspecific variation and environmental control. New Phytol 193:30–50
Ritchie MW, Zhang J, Hamilton TA (2013) Aboveground tree biomass forPinus ponderosain northeastern California. Forests 4:179–196
Saatchi S, Halligan K, Despain DG, Crabtree RL (2007) Estimation of forest fuel load from radar remote sensing. IEEE Trans Geosci Remote Sens 45:1726–1740 Sedjo R, Sohngen B (2012) Carbon sequestration in forests and soils. Annu Rev
Resour Econ 4:127–144
Snowdon P (1986) Sampling strategies and methods of estimating the biomass of crown components in individual trees ofPinus radiataD Don. Aust For Res 16(1):63–72
Snowdon P (1991) A ratio estimator for bias correction in logarithmic regressions. Can J For Res 21:720–724
Swank WT, Schreuder HT (1974) Comparison of three methods of estimating surface area and biomass for a forest of young eastern white pine. For Sci 20:91–100
Temesgen H (2003) Evaluation of sampling alternatives to quantify tree leaf area. Can J For Res 33:82–95
Tumwebaze SB, Bevilacqua E, Briggs R, Volk T (2013) Allometric biomass equations for tree species used in agroforestry systems in Uganda. Agroforest Syst 87:781–795
Valentine HT, Hilton SJ (1977) Sampling oak foliage by the randomized-branch method. Can J For Res 7:295–298
Zhou X, Hemstrom MA (2009) Estimating aboveground tree biomass on forest land in the Pacific Northwest: a comparison of approaches. Res. Pap. PNW-RP-584. U.S. Department of Agriculture, Forest Service, Pacific Northwest Research Station, Portland, OR, p 18
Submit your manuscript to a
journal and benefi t from:
7 Convenient online submission
7 Rigorous peer review
7 Immediate publication on acceptance
7 Open access: articles freely available online
7 High visibility within the fi eld
7 Retaining the copyright to your article