J Wood Sci (2001) 47:109-114 9 The Japan Wood Research Society 2001
S o n g - Y u n g W a n g 9 Far-Ching Lin 9 Min-Yi Lin
Thermal properties of interior decorating material and the sensation of
cold/warm by contact I1: the relations among heat flux, temperature change
of material, and sensation of cold/warm by contact
Received: November 12, 1999 / Accepted: March 29, 2000
Abstract The main purpose of this study was to investigate the changes in heat flux and temperature after the subject's palm was in contact with interior decorating materials. The relations among heat flux, temperature, and sensation of cold/warm during contact were studied. Ten men and ten women were selected and introduced to 21 materials for the contact test. They were in contact with the specimens for 30min without seeing them in a climate-controlled room at 25 ~ + 1~ and 65% RH. Changes in the heat flux and temperature of the specimens were determined by a heat flux meter. A sensory evaluation test was applied to evalu- ate the cold-warm contact. Results indicated that the heat flux and temperature increased with increasing time after the subject's palm was in contact with the specimens. The heat flux (Q~) and temperature (T~0) 30min after the subject's palm contacted the specimens were greater for male subjects than for female subjects. A positive linear regression equation existed between the values for Q30 and T30, whereas a negative linear regression formula existed the sensation of cold-warm by contact (S) and the values of
ln(Q1 "20.
Therefore, the sensation of cold/warm by contact could be estimated simply by using the thermal physical properties of the interior decorating materials.Key words Interior decorating material 9 Change of skin temperature 9 Contact sensation of cold/warm - Physiologi- cal value - Thermal osmotic coefficient
S.-Y. Wang ( ~ ) 9 F.-C. Lin. M.-Y. Lin
Department of Forestry, College of Agriculture, National Taiwan University, No. 1, Sect. 4, Roosevelt Road, Taipei, Taiwan, ROC Tel. +886-2-23631736; Fax +886-2-23631736 or +886-2-23654520 e-mail: sywang@ccms.ntu.edu.tw
Part of this report was presented at the International Conference on Effective Utilization of Plantation Timber, Chi-Tou, Taiwan, ROC, May 1999
Introduction
According to our previous report, I the fingertip maximum dropping temperature (Td) of the physiological response was closely related to the specific gravity (Pu) and thermal conductivity (,%) of materials. The psychological sensation of cold-warm during contact (S) had positive linear relations with fingertip maximum dropping temperature (Td) and the product of (Td" 2). However, the sensation of cold-warm (S) had a negative linear relation with the thermal osmotic coefficient (b). Therefore, the psychological sensation of cold-warm could be evaluated by the maximum fingertip dropping temperature of the physiological response and the basic properties of the material.
This study was based on the relation between the change of heat flux after the palm contacts the material's surface and the psychological sensation of cold-warm. The effects of the thermal properties on the sensation of cold-warmth during contact were studied. The results provided basic information for the selection and evaluation of interior decorating materials.
Testing materials and methods
Testing materials
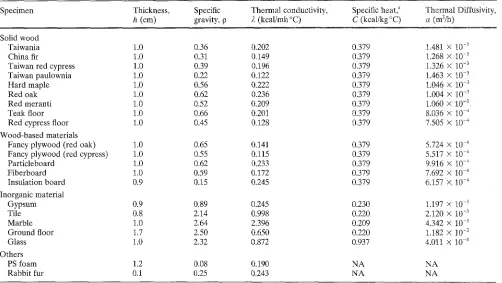
Table 1. Physical properties of 21 interior decorating materials
h ~ Thermal Diffusivity,
Specimen Thickness, Specific Thermal conductivity, Specific eat,
h (cm) gravity, p 2 (kcal/mh ~ C (kcal/kg ~ a (m2/h)
Solid wood
Taiwania 1.0 0.36 0.202 0.379 1.481 • 10 -3
China fir 1.0 0.31 0.149 0.379 !.268 • I0 -3
Taiwan red cypress 1.0 0.39 0.196 01379 1.326 • 10 -3
Taiwan paulownia 1.0 0.22 0.122 0.379 L463 • 10 -3
Hard maple 1.0 0.56 0.222 0:379 1.046 X t0 -3
Red oak 1.0 0.62 0.236 0.379 1.004 • 10 -3
Red meranti 1.0 0.52 0.209 0.379 1.060 • 10 -3
Teak floor 1.0 0.66 0:201 0.379 8.036 X 10 -4
Red cypress floor 1.0 0.45 0.128 0.379 7:505 • 10 -~
Wood-based materials
Fancy plywood (red oak) 1.0 0.65 0.141 0.379 5.724 • 10 4
Fancy plywood (red cypress) 1.0 0.55 0.115 0.379 L517 • 10 -4
Particleboard 1.0 0.62 0.233 0.379 9.916 • 10 -4
Fiberboard 1.0 0.59 0.172 0.379 7.692 X 10 -4
Insulation board 0.9 0.15 0.245 0.379 6.157 • 10 -4
Inorganic material
Gypsum 0.9 0.89 0.245 0.230 1.197 • 10 3
Tile 0.8 2.14 0.998 0.220 2.120 • 10 -3
Marble 1.0 2.64 2.396 0.209 4.342 • I0 3
Ground floor 1.7 2.50 0.650 0.220 1.182 • 10 -3
Glass 1.0 2.32 0.872 0.937 4.011 • 10 -4
Others
PS foam 1.2 0.08 0.190 NA NA
Rabbit fur 0.1 0.25 0.243 NA NA
a Specific heat was obtained from references 6 and 7
Measurement of heat flux and
temperature of specimen
A l t h o u g h h e a t t r a n s f e r is a t h r e e - d i m e n s i o n a l p h e n o m - e n o n , t h e h e a t t r a n s f e r m o d e l f o r p a l m - c o n t a c t e d m a t e r i a l c a n b e t r e a t e d as o n e - d i m e n s i o n a l . 2 W i t h t h e s u b j e c t ' s p a l m o n t h e s u r f a c e of s p e c i m e n s , as s h o w n as Fig. 1, t h e a r e a of t h e h e a t t r a n s f e r s y s t e m is A (cm2), t h e t h i c k n e s s of t h e s p e c i m e n is L (cm), a n d t h e t e m p e r a t u r e s o n t h e t w o sides of t h e s p e c i m e n s a r e t h e p a l m t e m p e r a t u r e , TA (~ a n d t h e h e a t flux m e t e r t e m p e r a t u r e , TB (~ T h e e n v i r o n - m e n t a l t e m p e r a t u r e is T% (~ TB is a f u n c t i o n of time. I f t h e h e a t t r a n s f e r s y s t e m is at s t e a d y state, t h e h e a t flux ( Q ) f r o m t h e p a l m t h r o u g h t h e s p e c i m e n c a n b e e x p r e s s e d as follows.
d Q _ 4 . A . TB - TA
dt L
w h e r e ~ is t h e t h e r m a l c o n d u c t i v i t y of s p e c i m e n s . I n E q . (1), if L = A X , 0 a n d A T = (TA -- TB), 0, it c a n b e e x p r e s s e d as follows.
a Q
~A.OT
(2)
at ~X
G e n e r a l l y , 2 is a c o n s t a n t . S u p p o s e t h e m a s s of t h e speci- m e n is m (g) a n d t h e specific h e a t is C ( c a l / g ~ h e a t flowing i n t o t h e h e a t flux m e t e r p e r u n i t t i m e is e x p r e s s e d as follows.
Palm ,"~"~" . . _ U ' ~
S p e c i m e n ~ ~ _ _ ~: . . . " H e a t flux m e t e r
o
:"
""TBo
Thermal
Insulation
:r direction
TA:Palm t e m p e r a t u r e
3. : T h e r m a l c o n d u c t i v i t y o f m a t e r i a ! A: S y s t e m area
L : T h i c k n e s s o f s p e c i m e n TB:Heat f l u x m e t e r t e m p e r a t u r e TB0:Room
temperature
dQ _ m . C dTB
dt dt
From Eqs. (1), (2), and (3) we derive the following equa- tion.
m . C dTB - 2 . A . T A - TB
dt L
Reorganizing Eq. (4) yields:
dTB 2. A
TA - T B m . C . L dt
Set )~.A
rn.C .L
- Z as a constant; then integrate Eq. (5).
111
phenomenon called sensory adaptation. Thus, the sensation (3) of cold/warmth during contact was recorded after oral in- quiry when the subject had been in contact with the speci- mens for 10s. The five grades of cold/warm sensation were very cold (1 point), cold (2 points), chilly (3 points), cool (4 points), and warm (5 points). For example, 2 points for a (4) specimen might be recorded for the right palm and 3 points for the left. After all the specimens were tested, the sensa- tion of cold/warm and its standard deviation (SD) were calculated. In other words, if there were m specimens and N (5) subjects, the psychological sensations of the contacted material was based on N ( m - 1), giving the average and SD. The change in the specimens' temperatures and heat fluxes were measured during the experiment.
;. d G
- f ; z dt
or
(6)
(7)
TA - TB I = e-zt (8)
---- TBo
that is
T B = T _ ( T _ z , B0).e z, (9)
A K e m t h e r m HFM-115 multiple points heat flux meter (Kyoto Electric K.K. product) was used for this experiment. It is equipped with 15 recording channels that recorded the surface temperature of the specimen and the heat flux of the unit area.
The heat flux sensor (Sensor ER2-L) was attached to the bottom surface of the specimen. After the subject's palm contacted the specimen, the change of heat flux and tem- perature of the specimen were recorded once every 30 s for 30rain, as shown in Fig. 1.
Sensation of cold/warm during contact
A test method based on the paired comparison method and the rating method was applied to the cold/warmth sensation experiment on the human hand because it is simple and gives clear results. The method was designed to compare materials that could not be sorted at once. Two materials were chosen for a comparison test. After mC2 times of testing, all material could be sorted for the final results.
First, the subject must sit quietly in a climate-controlled room [25~ and 65% relative humidity (RH)] for 5min. Then both hands are placed on the surfaces of two speci- mens for 30min. For the experiment to be unbiased, the test specimens are then placed in a covered box. The sensory sensitivity was reduced after long durations of stimulation, a
Results and discussion
H e a t flux properties of specimens
Because the skin surface temperature of the human body is about 34~ which is higher than the specimen temperature (25~ the palm is treated as a heat source, with heat trans- ferring from palm to specimen because of the temperature difference. H e a t flux was measured by a heat flux meter affixed to the bottom of the specimen.
In this experiment, the results showed that heat flux increased gradually with time after the palm contacted the specimen, although a tendency to decrease was found in some specimens at the end of the experiment. The increas- ing tendency depended on the subject's gender and the material tested. H e a t flux was noted at 30min, as shown in Table 2; and the values for men were higher than those for women. The F-test indicated that materials showed a significant gender difference except China fir, Taiwan red cypress, fancy plywood of red oak with polyurethane resin (PU) coating, teak solid wood floor with PU coating, par- ticleboard, marble, glass, and polystyrene foam. This find- ing may be due to the metabolism of men being more active than that of women.
Generally, heat flux increased with increasing thermal conductivity (2), but it did not show this relation at 30min (Q30). Although inorganic materials such as tiles, marble, and ground floor had large 2 values, their heat flux did not increase proportionally. The reason could be that because of the large heat capacity of the material it stored heat and did not immediately transfer it to the heat flux meter at the bottom of the specimen.
To eliminate the influence of the heat capacity difference of materials, the heat flux at the first minute (Q1), or the instant heat flux at the first minute, was measured. The results showed that Q1 increased with an increase in 2, but the relation was varied because most specimens were wood and wood-based material. Obviously, the Q1 value for MDF, gypsum board, tiles, marble, glass, and rabbit fur were higher than those for other wood and wood-based materials.
Table 2. Results of t-test for difference between male and female contacts with 21 interior decorating materials at various conditions Specimen Heat flux at 1 min Heat flux at 30rain
(W/m2), Q~ (W/m2), Q3o
Male Female Male Female
Temperature increase of material after 30 rain, T3o (OC)
Male Female Solid wood
Taiwania 1.3 0.9 32.6* 28.2 3.8 4.0
China fir 0.7 0.6 31.9 27:6 4.4 3.8
Taiwan red cypress 1.0 1.1 32.8 25.6 3.9 35 Taiwan paulownia 1.2 1.5 33.9* 29.7 4,5 3.6 Hard maple 0.5 1.1 33.9* 33.7 4.8 4.6
Red oak 15 1.0 36.2* 31.8 4:6 4.2
Red meranti 0.5 0.9 33.5* 30.4 4.3 4.4 Teak floor 0.3 014 37.9 34.2 4.9 3.9 Red cypress floor 0.7 1.0 33.7* 28.9 5.1 3.8 Wood-based materials
Fancy plywood (red oak) 0.3 0.2 33.9 24~9 4.8 35 Fancy plywood (red cypress) 0.7 1.3 38.3* 28.1 4.6 3.9 Particleboard 0.9 0.3 38.0 34.3 4.8 4,1 Fiberboard 0.5 0.9 35.1" 32.0 4.8 4.2 Insulation board 7.4 6.7 32.2* 25.9 4.8 3.7 Inorganic material
Gypsum 12.6 7.2 51.1" 34.2 6.7 5.0
Tile 8.8 9.7 42.8* 37.7 5.6 4.6
Marble 11.7 9.3 39.3 29.6 6.1 4~1
Ground floor 0.8 0.5 28.1" 19.3 3.5 2.3
Glass 11.9 10.3 52.8 48.6 6.3 5.8
Others
PS foam 1.5 1.3 20.6 18.1 2.6 2.6
Rabbit fur 45.3 41.9 54.2* 40.3 6.4 4.8 * Significant difference between males and females
c o n t a c t e d the specimens the h e a t flux i n c r e a s e d r a p i d l y and r e a c h e d a m a x i m u m at 50s; it then d e c r e a s e d slightly and r e m a i n e d constant. T h a t t e n d e n c y was s o m e w h a t different from the results of this study, which could be b e c a u s e t h e y affixed the sensor ( K e m t h e r m H F M , M A , E M ) to the inside of the p a l m and t h e n e s t a b l i s h e d contact with the surface of the specimen; the b o t t o m of the m a t e r i a l was s p r e a d with mortar. This is totally different from w h e n the sensor is affixed to the b o t t o m of the specimen. Thus, in their study h e a t flux was less influenced by h e a t capacity. T h e y also i n d i c a t e d that the m a x i m u m h e a t flux (qmax) and h e a t flux at 10min (ql0) of the p a l m - c o n t a c t e d m a t e r i a l s d e c r e a s e d in the order: steel > p l y w o o d > styrofoam. H e n c e , the higher t h e r m a l conductivity of m a t e r i a l s is associated with a l a r g e r h e a t flux. T h e p a l m t e m p e r a t u r e was influenced by p e r s o n a l differences, such as physiological and psychological condi- tions and the environment. A l t h o u g h the h e a t flux varied, q . . . . and ql0 were i m p o r t a n t indicators for evaluating the
cold/warm sensation of m a t e r i a l s during contact. T e m p e r a t u r e change of specimens
T h e specimen t e m p e r a t u r e g r a d u a l l y i n c r e a s e d with an in- crease in contact time. A t the end of the e x p e r i m e n t the t e m p e r a t u r e of solid wood, w o o d - b a s e d materials, and inor- ganic m a t e r i a l s r o s e 3 . 5 ~ 1 7 6 3.5~176 and 2.3~176 respectively. T h e results were caused by the h e a t flux of the
palm. O t h e r then taiwania, red meranti, and styrofoam, the rise in t e m p e r a t u r e was g r e a t e r when induced b y m e n than by w o m e n . T h e results consisted in a h e a t flax tendency. T h e t-test results of increasing t e m p e r a t u r e are shown in T a b l e 3. T h e relations b e t w e e n the h e a t flux at 30rain a n d the t e m p e r a t u r e increase on the m a t e r i a l ' s surface could b e r e p r e s e n t e d by positive linear regressions. T h e i r coef- ficients of d e t e r m i n a t i o n (R 2) were significantly different at the 0.01 confidence level by F-test, s u m m a r i z e d as follows:
T30 = 0.113Q30 + 0.607 R 2 = 0.869 F = 2655**
H e a t transfer m o d e l of s p e c i m e n
A c c o r d i n g to Eq. (7), e x p e r i m e n t a l d a t a were substituted as follows.
in ( p a l m t e m p e r a t u r e - r o o m t e m p e r a t u r e ) ( p a l m t e m p e r a t u r e - h e a r t flux m e t e r t e m p e r a t u r e )
= A T
Table 3. Results of t-test for time delay between male and female palm contacts with interior decorating materials; their determination coefficient for time-delay regressive equations
Specimen Delay time Determination
(rain) coefficient (R 2)
Male Female Male Female
Solid wood
Taiwania -4.80 -0.22 0.977 0.952
China fir -2.78 5.91 0.977 0.977
Taiwan red cypress 4.67 -4.79 0.962 0.979
Taiwan paulownia 2.29 - 1.68 0.958 0.984
Hard maple -3.25 -0.40 0.977 0.970
Red oak 2.41 0.35 0.971 0.954
Red meranti 1.82 1.35 0.976 0.989
Teak floor 1.40 -3.29 0.975 0.980
Red cypress floor -1.39 -2.93 0.952 0.983
Wood-based materials
Fancy plywood (red oak) -3.87 -5.04 0.986 0.995
Fancy plywood (red cypress) -1.04 1.00 0.983 0.974
Particleboard 1.52 -5.33 0.986 0.994
Fiberboard 3.19 - 1.81 0.971 0.988
Insulation board 4.97 4.24 0.902 0.939
Inorganic material
Gypsum 5.60 1.88 0.924 0.947
Tile 0.42 0.75 0.953 0.959
Marble 3.83 4.29 0.962 0.983
Ground floor - 4.65 - 6.25 0.993 0.989
Glass 2.20 1.20 0.965 0.970
Others
PS foam 3.19 -6.27 0.968 0.962
Rabbit fur 8.24 11.00 0.977 0.945
113
where A T is regression of time.
A T = - a - ct = - c ( t - x )
(11)
hence, x = - a / c (min) (12)
A c c o r d i n g to the o n e - d i m e n s i o n a l heat transfer theory, the material t e m p e r a t u r e should rise i m m e d i a t e l y after the palm contacts the specimen; however, the heat flux m e t e r did n o t i m m e d i a t e l y react a n d delayed x m i n (x = - a / c ) ,
which might be called the "delay time." T h e cause m a y be due to the sensitivity of the heat flux meter, the varied heat capacities of materials, or e x p e r i m e n t a l error.
T h e R 2 values of the above regression were higher than 0.90, as shown in T a b l e 3. Thus the o n e - d i m e n s i o n a l heat transfer m o d e l is suitable for this experiment. Theo- retically, the value c should relate to the sensation of cold/ w a r m t h (S), but, there was no significant relation b e t w e e n either the a value or the c value with S. F u r t h e r studies are needed.
H e a t flux a n d sensation of cold/warm during contact
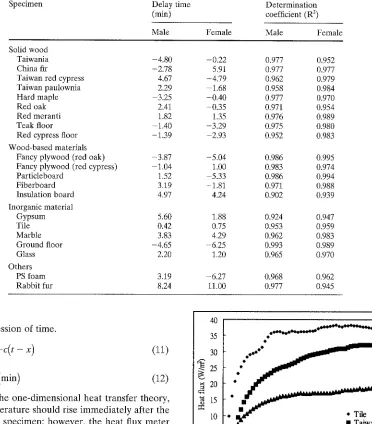
Figure 2 shows that the change in heat flux after the p a l m contacted three interior decorating materials, including tile, taiwania, a n d sponge, with different t h e r m a l conductivities. It was f o u n d that the heat flux increased with contact time; the t e n d e n c y to increase was significant for specimens with high t h e r m a l conductivities (2), as was the heat flux at i a n d
40
35
3O
20
15
10
Y
ii >
~l~llm i I I I
0 5 10 15 20 25 30 mm.
Fig. 2. Change of heat flux during contact with tile, taiwania, and sponge
30rain (Q: a n d Q30)- With the palm in contact with the specimen there was a large heat flux b e t w e e n the two a n d psychologically it felt cooler. However, w h e n analyzing the relation b e t w e e n Q~ and S, the heat flux at l m i n (Q1) did n o t have a significant relation with the sensation of cold/ warmth (S).
Suppose that the i n s t a n t heat flux at l m i n (Q~) was influenced by the t h e r m a l conductivity (2), Q1 multiplied by 2. T h e results show that the higher is Q~ • 2, the lower are the cold/warmth points, or the cooler the specimen is. These relations can be s u m m a r i z e d as follows:
The F-test results showed that the regression of the sen- sation of cold/warmth (S) and the natural logarithm of (Ol • 2) was significant at the 0.01 confidence level. This is similar to the results reported by Okajimar He indicated that the heat flux of red meranti was low and ranked as a "warm" material; aluminum and stainless steel, with a larger heat flux, were ranked as "cold" materials. This also agrees with our previous report. 5 Sakuragawa et al) indi- cated there was negative relation between the sensation of cold/warmth (S) and the logarithm of the heat flux (log (2). This means that the heat flux between palm and specimen is an important indicator for the sensation of cold/warm (S). The difference with their and our results was that the sensor was affixed inside the palm in Sakuragawa et al.'s experi- ment, not under the specimen as in our study; thus, heat flux was therefore less influenced by heat capacity.
Thermal diffusivity and sensation of cold/warm during contact
It is known that heat transfer is governed by the heat equation
3U __ (32/d 32U O2U" ]
3y 2
3z 2 )
which gives the temperature
u(x,y,z,O
in a b o d y of material. H e r e a is the thermal diffusivity, which can be expressed as follows.2
9 a - (13)
C ' A
where 2 refers to the thermal conductivity of the material, C refers to the specific heat, and Pu refers to the specific grav- ity. The a values of 21 materials are given in Table 1. A n analysis of a or ln~,'a with S did not show a good relation. The results are consistent with those of H a r a d a et al. 8 and Okajima et al. s H a r a d a et al. 8 investigated the sensation of cold/warm during contact and indicated that a significant negative relation existed a m o n g the psychological value (S), thermal conductivity (2), log 2, thermal capacity
(C9),
and logCp.
In contrast, the relation between S and a ( =2/Cp)
was not significant. Okajima et al. 6 also indicated there were some problems estimating the S value from the a value, considered the physical characteristics of the material, which meant that a was not an important indicator for the sensation of cold/warm during contact. In the previous re- port a the S value had a significant negative relation with the thermal osmotic coefficient, b ( = ~,2.C.2), which meant that the thermal properties (2, C, p) were good indicators of the sensation of cold/warm during contact.
Considering all the experimental factors, including the materials' thermal properties of 2, C, and p, statistical analy- sis was done by stepwise regression. It showed that the coefficients of 2, C, and p were significant at the 0.01 confidence level. The sensation of cold/warm (S) can be expressed exponentially as follows.
S = 0.338
p-0.128 2-0248.C
0133 R 2 = 0.546 F = !50.6"* It can be concluded that the factors that influence the sensation of thermal properties of a material during contact are 2 > C > p, according to the absolute values. This also means that only the thermal properties of m a t e r i a ! are enough to predict the sensation of cold/warm during contact.Conclusions
1. The heat flux at 30min (Q30) is higher in men than in women. The one-dimensional heat transfer model is ap- propriate for the experiment.
2. The temperature of material gradually increased with the increase in duration of palm c o n t a c t At the end of the experiment, the temperature of solid w o o d a n d wood-based materials and of inorganic materials rose 3.5~176 and 2.3~176 respectively. The tempera- ture rise was higher for men than for women.
3. The relation between the heat flux at 30min (Q30) and the temperature increase at 30min (T30) can be repre- sented by a positive linear regression formula.
4. T h e relations between the sensation of cold/warm (S) and the natural logarithm of (Q1 • 2) can be r e p r e s e n t e d by a negative linear regression formula at the 0.01 significance level. Therefore thermal properties of mate- rials m a y be considered indicators when assessing the sensation of cold/warm during contact.
5. The material thermal property coefficients 2, C, and 9 are excellent indicators for predicting sensation of cold/ warm during contact without considering other factors.
Acknowledgment
The investigation reported in this paper was sup- ported financially by the National Science council of the Republic of China (NSC-88-2313-B-002-112-A09).References
1. Wang SY, Lin MY, Lin FC (in press) Thermal properties of interior decorative material and contacted sensory cold-warmth. I. J Wood Sci
2. Hsie SS (1990) Fundamental heat transfer (in Chinese ). Tung-Hun Book Co., Taipei, pp 1-37
3. Sakuragawa S, Maruyama N, Hirai N (199t) Evaluation of contact thermal comfort of floors by heat flow. Mokuzai Gakkaishi 37~753- 757
4. Okajima T (1984) Tactile response of building materials. Wood Ind 39(8):9-12
5. Wang SY, Kuo PW (1995) Changes of skin temperatures as feet contacted floors constructed of different materials. Mokuzai' Gakkaishi 41:731-740
6. OkajimaT, TanahashiI, YasudaT, Takeda Y (1976) Tactile warmth of building materials (in Japanese). Jpn Building Soc Bull 245:1- 7
7. Asano I (1982) Dictionary of wood (Mokuzai No Jiten) (in Japanese). Asakura Book, Tokyo, Japan, p 127