O R I G I N A L A R T I C L E
Seismic performance of post and beam timber buildings I: model
development and verification
Minghao Li•Frank Lam•Ricardo O. Foschi• Shiro Nakajima•Takafumi Nakagawa
Received: 24 March 2011 / Accepted: 31 August 2011 / Published online: 17 December 2011
ÓThe Japan Wood Research Society 2011
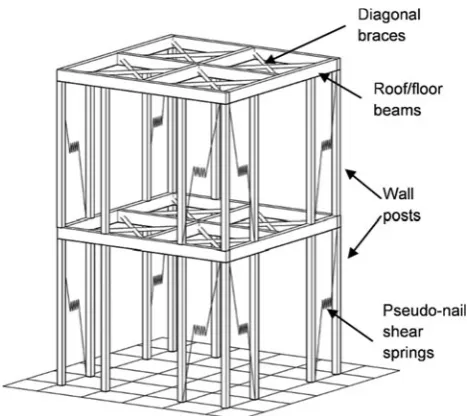
Abstract This paper presents a structural model called ‘‘PB3D’’ to perform nonlinear time history analyses of post and beam timber buildings under seismic loads. The model treats the three-dimensional structure as an assembly of roof/floor diaphragms and wall subsystems. The roof/floor diaphragms are modeled by beam elements and diagonal brace elements in order to take into account the in-plane stiffness. The wall system consists of vertical beam ele-ments, for wall posts, as well as nonlinear shear springs to consider the contribution of diagonal wall bracing mem-bers or sheathing panels. The hysteretic characteristics of the shear springs are represented by a simplified, mechanics-based model named a ‘‘pseudo-nail’’. Standard
finite element procedure is used to construct the system’s equation of motion, which is solved by Newmark’s inte-gration. The model was verified against shake test results of a three-story post and beam building subjected to strong ground motions scaled to the 1995 Kobe earthquake. Model predictions agreed very well with the test results in terms of base shear forces and inter-story drift responses. This model provides a robust and efficient tool to study the seismic behavior of post and beam timber buildings. Keywords Seismic performance Timber buildings Nonlinear analysis Post and beam construction
Introduction
The 1995 Hyogo-ken Nanbu (Kobe) earthquake raised a lot of concerns about the seismic safety of traditional post and beam (P&B) timber construction in Japan. The poor per-formance of the severely damaged P&B houses can be attributed to some structural design issues such as heavy tile roofs, weak first stories, irregular shear wall layout, and inadequate provision of inter-story and foundation anchor-age. Poor maintenance was also a culprit [1]. Since the Kobe earthquake, a lot of efforts have been directed to study the seismic behavior of the P&B buildings and the Building Standard Law (BSL) in Japan has also been upgraded. Similar to the wood-frame construction in North America, P&B timber buildings in Japan are also box-type structures consisting of two-dimensional horizontal and vertical assemblies such as walls, floors, ceilings and roofs. Nail fasteners are also extensively used to attach sheathing panels to timber frames. However, the timber frames of the P&B buildings are usually constructed by members with rela-tively large cross sections, for example, 105 mm9105 mm
Part of this article has been presented in the 11th World Conference on Timber Engineering, Riva del Garda, Trento, Italy, 2010.
M. Li (&)
Department of Wood Science, University of British Columbia, 2835-2424 Main Mall, Vancouver, BC V6T 1Z4, Canada e-mail: [email protected]
F. Lam
Department of Wood Science, University of British Columbia, 4041-2424 Main Mall, Vancouver, BC V6T 1Z4, Canada e-mail: [email protected]
R. O. Foschi
Department of Civil Engineering, University of British Columbia, 2005-6250 Applied Science Lane,
Vancouver, BC V6T 1Z4, Canada e-mail: [email protected]
S. NakajimaT. Nakagawa
Building Research Institute, 1-Tachihara, Tsukuba, Ibaraki 305-0802, Japan e-mail: [email protected] T. Nakagawa
for wall posts and 105 mm9210 mm for floor/roof beams. A special feature of the P&B construction is the extensive use of traditional mortise-and-tenon joinery reinforced by metal hardware. Thus, it is very challenging to develop detailed finite element (FE) models to simulate the seismic response of such complicated building systems.
Performance-based seismic design of wood buildings requires reliable and efficient numerical models to perform nonlinear time history analyses. Compared with the state-of-art numerical models for steel or concrete structures, very limited numerical models have been developed to study wood structures. A simple model to study the seismic responses of a wood building might be a multidegree-of-freedom (MDOF) model in which each floor or roof is lumped into a structural mass point and nonlinear shear springs are used to connect floors and roof. Only horizontal degrees of freedom (DOF) are considered. The character-istics of each shear spring are calibrated by the total con-tribution of the shear walls at each story. Agawa and Miyazawa [2] used such a MDOF model to study existing residential buildings in Japan. Although MDOF models are very computationally efficient for nonlinear time history analyses, they are highly simplified and cannot consider torsional effects and vertical effects in the buildings. Researchers also developed models which are able to consider the hysteresis of individual shear walls. Folz and Filiatrault [3] reported a benchmark modeling study of a two-story building tested in the CUREE-Caltech wood-frame project. Blind predictions with the assumption of rigid roof/roof diaphragms were reported. One of models was built in the RUAUMOKO program [4] and two were built in DRAIN-2DX and DRAIN-3D program [5]. Recently, van de Lindt et al. [6] reported a model called SAPWood to perform time history analyses of wood-frame buildings. In this model, the assumption of rigid floor/roof diaphragms was also used. The model consists of nonlinear shear springs for shear walls and non-symmetric linear springs to provide vertical restraints for the buildings. The assumption of rigid roof/floor diaphragms can greatly simplify the analyses since only three DOFs (two transla-tional and one rotatransla-tional) need to be considered for each floor or roof. The model accuracy greatly relies on the level of the accuracy of shear wall hystereses implemented into the building model.
Detailed FE models have also been developed to model wood buildings. He et al. [7] developed a sophisticated model called LightFrame3D for wood-frame buildings. In this model, a wood-frame building was modeled as an assembly of generic super-elements consisting of framing elements, panel elements and nail connection lines. Nak-agawa and Ohta [8,9] and Nakagawa et al. [10] developed a model to simulate the collapsing process of traditional Japanese wood houses under severe ground shaking using
the extended distinct element method since the authors believe that it is difficult to simulate such an ultimate failure process using common finite element methods. This model provides a very insightful tool to study the rela-tionship between seismic intensity and collapse limit of timber buildings. Commercial structural analysis software has also been used to model wood buildings, although most of them might have limited ability to represent the hys-teretic characteristics of wood connections/walls, such as strength/stiffness degradation and pinching effect. Masa-lam et al. [11] developed a dynamic model in SAP2000 for a three-story wood-frame building tested in the CUREE-Caltech wood-frame project. Collins et al. [12] developed a static model in ANSYS for a one-story wood-frame building. Lam et al. [13] also developed a static model in ANSYS for a one-story P&B building. Xu and Dolan [14] developed a dynamic FE model in ABAQUS to study the seismic behavior of a two-story wood-frame building in which the modified Bouc-Wen-Barber-Wen (BWBN) model was integrated to represent the hystereses of shear walls.
Typically, detailed FE models are very computational intensive to perform nonlinear time history analyses of complicated wood systems although they are more com-prehensive and more accurate to predict structural responses. Therefore, they may not be suitable for seismic reliability evaluations which require a robust and efficient computer model to run a large number of simulations, considering the uncertainties in ground motions and structural capacity. In this study, a computer model called ‘‘PB3D’’ is developed to model the seismic behavior of the P&B timber buildings. This model aims to capture the global characteristics in the seismic response of the buildings with reasonable accuracy and computational efficiency by incorporating simplified structural component models for the roof/floor diaphragms and shear walls. For model verification purpose, shake table test results of a full-scale three-story building, excited by strong ground motions, were used.
Theory
boards/OSB), and gypsum wallboards (GWB). The load– deformation hysteresis F(D) of the shear springs are calculated by a mechanics-based subroutine named ‘‘pseudo-nail’’.
Shear walls
In many building models, shear walls are represented by shear springs with F(D) being the load–drift relationship and defined by mathematical functions. These functions associated with loading and unloading rules are usually obtained by empirically fitting hysteretic loops of shear walls from cyclic testing or detailed shear wall modeling. Numerous empirical hysteresis models for wood shear walls have been discussed in literature [15–18]. In the ‘‘PB3D’’ model, the shear walls are modeled by two types of elements: beam elements for the vertical posts to carry vertical loads and provide vertical restraints; and nonlinear
shear springs for lateral resistance. TheP-Deffect is not considered. Since the contribution from wall posts to lateral resistance is small, the lateral resistance of the building is primarily provided by the shear springs. The uplifting characteristics of the building are not modeled by adding linear/nonlinear vertical spring elements. Instead, the uplifting is simply prevented by wall post elements which are fully end restrained onto the foundation or stories. The hysteresisF(D) for each shear spring, i.e., each shear wall, is calculated by the ‘‘pseudo-nail’’ model, as shown in Fig.2. The concept of this model was motivated by the fact that a nailed connection and a wood shear wall demonstrate similar hysteretic features such as strength/stiffness deg-radation and pinching effect. The algorithm for the ‘‘pseudo-nail’’ model is a revised version of a nail con-nection model called HYST [19], originally developed to model wood connections with metal fasteners, except that the ‘‘pseudo-nail’’ model parameters need to be calibrated to represent a shear wall hysteresis instead of a nail hys-teresis. These parameters include the nail length L and diameterDand six parameters to describe the compressive properties the surrounding embedment medium. The ‘‘pseudo-nail’’ model is very computationally efficient and is believed to be more robust than the empirical curve-fitted models because, to some extent, it embodies the internal mechanism of a wood shear wall to resist lateral loads such as the interaction between wood medium and metal fas-teners. Furthermore, this model can adapt to any loading protocols while using a fitted hysteresis for any loading implies an extrapolation from the protocol used for the fitting. The details of the ‘‘pseudo-nail’’ model have been discussed elsewhere [20, 21]. Recently, Li et al. [22] modified the original HYST algorithm by adding the stiffness degradation in wood embedment medium under cyclic loading in order to fully address the strength/stiff-ness degradation and pinching effect in wood connections. The modified algorithm has also been applied into the ‘‘pseudo-nail’’ algorithm implemented into the ‘‘PB3D’’ model.
Fig. 1 Schematics of a ‘‘PB3D’’ model
Fig. 2 A shear wall hysteresis
Roof/floor diaphragm
Observations from past earthquake experiences and shake table tests show that when wood buildings are excited by strong ground motions, roof and floor diaphragms usually do not experience high nonlinearity. Severe structural damage and most of the input energy dissipation take place in the wall systems. Therefore, in the ‘‘PB3D’’ model, roof/ floor components are modeled by linear elastic 3D beam and truss elements. The roof and floor beams with large cross sections are modeled by the beam elements with each node having three translational DOFs and three rotational DOFs. Other components such as joists/rafters, sheathing panels and nail connections are condensed and simply modeled by diagonal truss elements with each node having three translational DOFs. The connections between the beam elements and the truss elements are simply assumed to be rigid. The cross sections of truss elements are cali-brated to match the in-plane stiffness of the floor/roof diaphragms in actual buildings. The element stiffness matrices can then be calculated and assembled into a global system stiffness matrix.
Formulation of system equation
The system equation of motion for the ‘‘PB3D’’ model is formulated as:
M€uþCu_þfsðu;uÞ ¼ M_ u€g ð1Þ
whereMandCare, respectively, the mass and the damping matrix; u, u_ and u€ are the displacement velocity and acceleration vector of the finite element assemblage;u€g is
the ground acceleration;fsðu;uÞ_ is the resistant force vector
depending on the load history of the nonlinear system. Damping mechanism in wood buildings is very complicated. In general, under strong ground motions, the major energy dissipation is attributed to structural nonlinear deformations while the secondary energy dissipation mechanism can be approximately accounted by the viscous damping. In this model, mass-proportional and stiffness-proportional damping are used to account for the viscous damping:
C¼aMþbK ð2Þ
whereM is the lumped mass matrix andKis the stiffness matrix. The mass-proportional damping ratio a and stiff-ness-proportional damping ratiobcan be determined based on test results.
Newmark’s integration with constant acceleration assumption for each time step is used to calculate the time history response of the system. Given a short time interval
Dt, the incremental form of Eq. (1) is
MDu€iþCDu_iþ ðDfsÞi¼DPi ð3Þ
ðDfsÞi can be approximated by tangent stiffness matrix
of the system as
ðDfsÞi¼ ðK_ iÞTDui ð4Þ
in whichðKiÞTis the global tangent stiffness matrix which
is an assembly of element tangent stiffness matrices fol-lowing standard finite element procedures.
In the ‘‘PB3D’’ model, for computation efficiency, the stiffness matrices for the linear elastic elements are established in a pre-process procedure. Thus, during iter-ations, only the stiffness matrices of the nonlinear elements need to be updated for each time step. Newton–Raphson iterations are used to solve for the incremental nodal dis-placement vector. Both energy and force convergence criteria are used to assure a converged solution.
Model verification
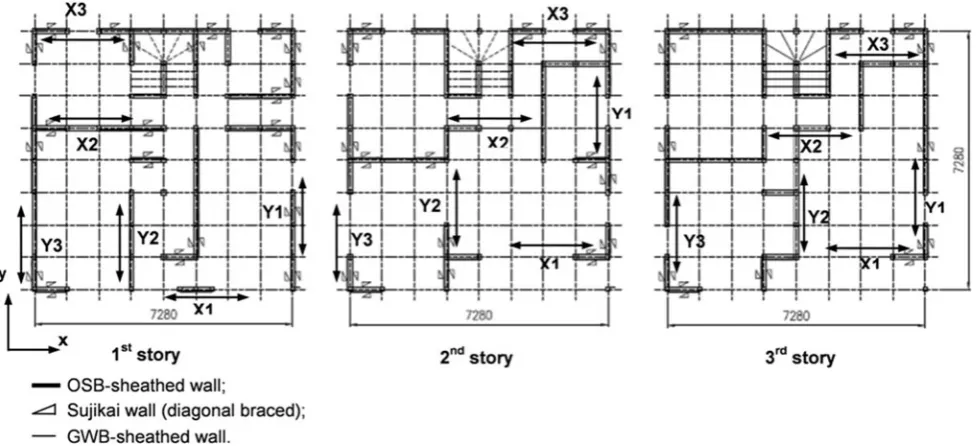
existing shear walls in the first story, excluding the walls with openings, was about 71.9 m along thexdirection and 78.4 m along theydirection, ratios of 2.32 and 2.53 of the code minimum by the wind loads, and ratios of 4.02 and 4.38 of the minimum requirement stipulated by the BSL. This building also had a wide carport opening in the first story which greatly increased the building eccentricity and caused significant torsional effect under seismic loading.
In the ‘‘PB3D’’ model, the diagonal truss elements for the floor diaphragm were calibrated by a static test of a floor segment with a plan size of 3.6 m95.4 m (Fig.5). All the floor beams and joists were Canadian Hem-fir members. Plywood panels with thickness of 16 mm were
Fig. 3 Three-story building and the ‘‘PB3D’’ model
Fig. 4 Shear wall layout of the building
sheathed onto the frame by JIS CN50 nails spaced at 150 mm on edge and 300 mm on field. Third point loading was applied via a steel loading beam onto one floor side. Both supporting sides were tied down on the strong con-crete floor in the lab. The in-plane stiffness of the floor segment along both horizontalxandydirections was tes-ted. However, along the deeperxdirection, considering the floor aspect ratio, the concept of treating this floor segment as a ‘‘deep’’ beam may not be appropriate since the loading effect was highly concentrated in an area close to the loading points. The test results indicated that the in-plane stiffness of the floor segment was about 8.45 kN/mm along theydirection. Accordingly, the diagonal bracing elements of floor diaphragms in the building model were calibrated. The in-plane stiffness of a typical roof segment in the P&B construction was estimated by detailed FE modeling using the commercial software ANSYS, as shown in Fig.6. The modeled roof was also constructed by Canadian Hem-fir members and sheathed by 12.5 mm thick plywood
panels. JIS N50 nails were spaced at 100 mm on edge and 200 mm on field. Beam elements and panel elements and link elements were used to model the roof beams and rafters, sheathing panels and nailed connections. The cross section of the diagonal truss elements was calibrated by matching the in-plane stiffness of these two structural systems.
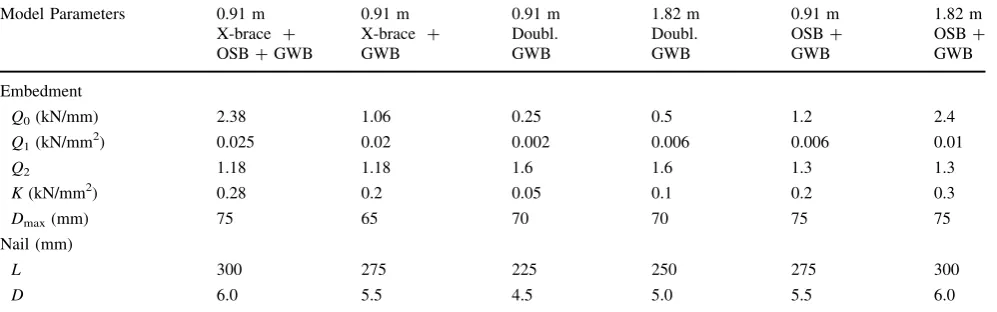
The ‘‘pseudo-nail’’ model parameters for individual shear walls were calibrated by a test database of P&B shear walls constructed with different wood species, sheathing materials, nailing schedules, and construction methods. In such tests, the load–drift backbone curves from reversed cyclic tests are usually used to determine the shear wall design values considering yielding, ductility and energy dissipation and deformation limit of the walls. The back-bone curves of the load–drift loops were used to calibrate the ‘‘pseudo-nail’’ model parameters which were imple-mented into the building model. Table1 shows the cali-brated ‘‘pseudo-nail’’ model parameters for the six types of
Fig. 6 Roof diagonal bracing calibration by FE models
Table 1 ‘‘Pseudo-nail’’ model parameters in three-story building
Model Parameters 0.91 m X-brace ?
OSB?GWB
0.91 m X-brace ?
GWB
0.91 m Doubl. GWB
1.82 m Doubl. GWB
0.91 m OSB?
GWB
1.82 m OSB?
GWB Embedment
Q0(kN/mm) 2.38 1.06 0.25 0.5 1.2 2.4
Q1(kN/mm2) 0.025 0.02 0.002 0.006 0.006 0.01
Q2 1.18 1.18 1.6 1.6 1.3 1.3
K(kN/mm2) 0.28 0.2 0.05 0.1 0.2 0.3
Dmax(mm) 75 65 70 70 75 75
Nail (mm)
L 300 275 225 250 275 300
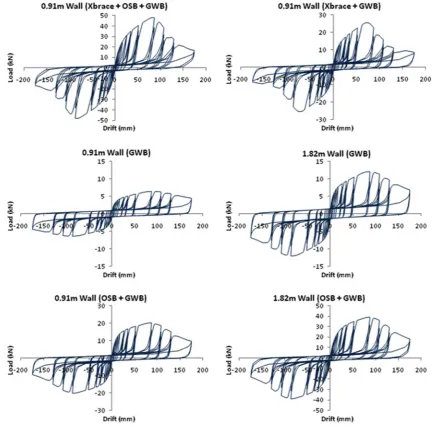
full-height walls used in this building. The definitions of these parameters have been given in literature [20, 21]. Figure7 shows the model predicted load–drift hystereses subject to a standard cyclic loading protocol. The hysteretic characteristics of strength/stiffness degradation and pinch-ing effect have been full addressed.
In this study, the building model did not consider the contributions from exterior wall claddings (FMQ5MIV siding panels manufactured by AT-WALL) to the building lateral resistance because these claddings were simply hanging on the exterior walls by metal clips and it is believed that their contributions to the shear wall resistance are very small compared with those from the OSB shea-things, cross braces and GWBs. It should be noted that the building model also did not consider the contributions from the walls with openings. One reason is that this building
had a limited number of walls with window/door openings. For example, using the opening reduction factor Ko stipu-lated by the guideline from Seismic Evaluation and Retrofit for Wood Houses by Japan Building Disaster Prevention Association [24], the calculated effective length of walls with openings in the first story was 3.185 m along the xdirection and 4.55 m along theydirection, approximately 4.4 and 5.8% of the total effective length of full-height walls with OSB sheathing, cross braces, and GWBs along the corresponding direction in the first story. Therefore, the lateral resistance of this building was mainly governed by the full-height shear walls. Of course, the model predic-tions of the seismic response of this building would be more accurate should the actual shear resistances of these walls with openings be available and considered by the model as well. In other situations, if a building has
Fig. 8 Major failure modes in shear walls
significant amount of walls with openings or the wall fin-ishing materials have significant contributions to shear wall resistance, the seismic simulations should take into account their influence on the seismic response of the entire building.
The total weight of the building was about 341 kN. The structural mass (including the structural self-weight and additional mass to simulate live loads) was 228 kg/m2for the 2nd floor, 225 kg/m2for the 3rd floor and 159 kg/m2 for the roof. The input ground motions were the three axial 1995 Kobe JMA ground motion records including EW, NS and UD components. The weak x direction (due to the carport opening) of the building was excited by the NS component which has a higher PGA than the EW compo-nent. The building was tested with 150 and 200% Kobe
JMA records, respectively. The recorded PGAs were 1.35 and 1.75 g along thexdirection of the building. During the 150% Kobe JMA shaking, the peak inter-story drift (PID) of the entire building occurred at the carport opening in the first story and was about 59 mm, a drift ratio of 2.1%. No serious structural damage was observed except some corner breakage of GWBs, minor damage at OSB corners, and some detachment of the stucco siding in the first story. No repair was thus made after this shaking. However, during the 200% Kobe JMA shaking, at the carport opening, the PID reached 196 mm, a very high drift ratio of 7.2%. This building was at a near collapse state. Most of the shear walls in the first story experienced severe structural dam-age. As shown in Fig.8, the OSB sheathing was detached from the frame due to the complete failure of nail lines and
the diagonal bracing members were broken due to the out-of-plane buckling failure.
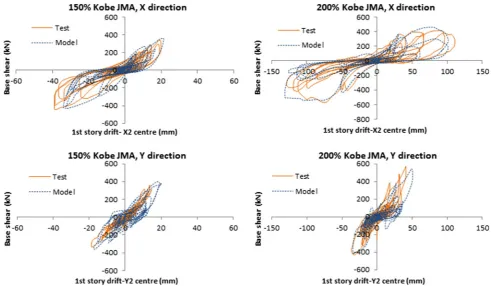
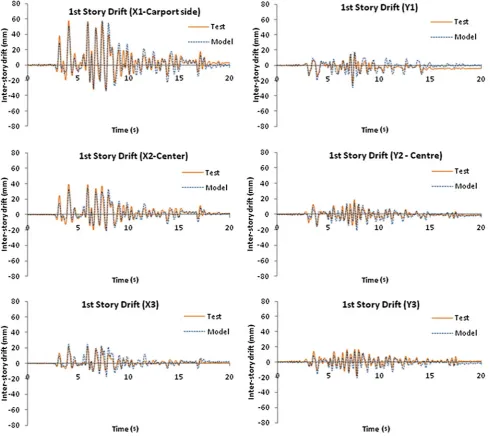
In the ‘‘PB3D’’ model simulation, structural mass was lumped onto roof/floor nodes based on their tributary areas. Combined ground motions of the 150 and 200% Kobe JMA shakings were input as one time history analysis since no structural repair was made between these two shake table tests. A damping ratio of 5% was assumed in the model simulation based on a previous free vibration test on a one-story post and beam building in which a damping ratio of 4.7% was recorded [20]. The 5% damped model predic-tions also indicated that the PID of the entire building occurred at the carport opening side in the first story. Figure9 shows the comparison between the model pre-dictions and the test results in terms of the relationship between the base shear and the first story drift. In general, good agreements can be observed. During the 150% Kobe JMA shaking, the model predicted maximum base shear, along thexdirection, was 434 kN and the prediction error was only 0.5%. During the 200% Kobe JMA shaking, the model predicted maximum base shear, along thex direc-tion, was 544 kN and the prediction error was about -3.5%. The model predicted inter-story drift response also agreed very well with the test results, especially for the 150% Kobe JMA shaking. Figure10 shows the predicted first story responses at different locations where displace-ment sensors were installed compared with the test results from the 150% Kobe JMA shaking. The predicted PID at the carport opening side was 56.6 mm, 4.0% lower than the test results. Figure11 shows the predicted first story drift responses along the x direction compared with the test results from the 200% Kobe JMA shaking. The predicted PID was 194.5 mm, 0.7% lower than the test results. Table2 gives the model predicted PIDs at different
building locations compared with the tests results. Fig. 11 Inter-story drift responses under 200% Kobe JMA shaking
Table 2 Model predicted peak
inter-story drifts versus test results
Shake table test Sensor location
Peak inter-story drift (mm)
1st story 2nd story 3rd story 150% Kobe JMA X1 56.6 (-4.0%) 25.6 (18.0%) 11.3 (-28.5%)
The numbers in parentheses give the prediction errors in percentage. In general, model predictions agreed very well with the test results.
Conclusions
This paper presents a computer model called ‘‘PB3D’’ to simulate the seismic response of post and beam wood buildings commonly used in Japan. The roof/floor dia-phragms are modeled by beam elements and truss elements considering the in-plane stiffness of diaphragms. The shear walls are modeled by vertical beam elements as wall posts and nonlinear shear springs. The hysteresis of the nonlinear shear springs is represented by a mechanics-based algo-rithm called a ‘‘pseudo-nail’’ model which can be cali-brated by shear wall test results or detailed wall models. Model predictions of a full-scale three-story building were compared against the shake table test results. The predic-tions agreed very well with the test results, especially in terms of the base shear forces and the first story inter-story drift responses. The torsional effect was also captured very well by the model.
For seismic reliability analysis of timber buildings, a major computational demand is to establish a seismic response database, considering different seismic events and structural characteristics. The ‘‘PB3D’’ model presented in this paper provides a robust and efficient tool to estimate the seismic response of the post and beam timber buildings, facilitating the development of reliability-based assessment of the seismic safety of such building systems.
Acknowledgments Research grant from Natural Sciences and
Engineering Research Council (NSERC) of Canada and Coast Forest Products Association of British Columbia is greatly acknowledged. The collaboration of Mr. Minoru Okabe from the Centre for Better Living of Japan is also acknowledged for providing the technical information on shear walls.
References
1. Arima T (1998) Timber housing damage in the 1995 Southern Hyogo earthquake. In: Proc. 5th WCTE, Montreux, Switzerland, 1:748–749
2. Agawa M, Miyazawa K (2004) Evaluation of seismic perfor-mance based on statistical research for actual wooden dwelling houses in Japan. In: Proc. 8th WCTE, Lahti, Finland
3. Folz B, Filiatrault A (2004) Blind predictions of the seismic response of a wood-frame house: an international benchmark study. Earthquake Spectra 20(3):825–851
4. Carr AJ (2000) Ruaumoko—inelastic dynamic analysis program. University of Canterbury, Christchurch
5. Prakash V, Powell GH (1993) DRAIN-2DX, DRAIN-3DX and DRAIN BUILDING: base program design documentation, Report No. UCB/SEMM-93/17. University of California, Berkeley
6. van de lindt JW, Pei S, Liu H, Filiatrault A (2010) Three-dimensional seismic response of a full-scale light-frame wood building: numerical study. J Struc Eng 136(1):56–65
7. He M, Lam F, Foschi RO (2001) Modeling three-dimensional light-frame buildings. J Struc Eng 127(8):901–913
8. Nakagawa T, Ohta M (2003) Collapsing process simulations of timber structures under dynamic loading I: simulations of two-story frame models. J Wood Sci 49:392–397
9. Nakagawa T, Ohta M (2003) Collapsing process simulations of timber structures under dynamic loading II: simplification and qualification of the calculating method. J Wood Sci 49:499–504 10. Nakagawa T, Ohta M, Tsuchimoto T, Kawai N (2010) Collapsing process simulations of timber structures under dynamic loading III: numerical simulations of real-size wooden houses. J Wood Sci 56:284–292
11. Mosalam K, Machado C, Gliniorz K, Naito C, Kunkel E, Mahin S (2002) Seismic evaluation of an asymmetric three-story wood-frame building. CUREE Publication No. W-19
12. Collins M, Kasal B, Paevere P, Foliente G (2005) Three-dimensional model of light frame wood buildings I: Model description. J Struc Eng 131(4):676–683
13. Lam F, Li M, Gu J (2006) Structural performance of one storey Japanese post-and-beam building. In: Proc. 9th WCTE, Portland, USA
14. Xu J, Dolan JD (2009) Development of a wood-frame shear wall model in ABAQUS. J Struc Eng 135(8):977–984
15. Dolan JD (1989) The dynamic responses of timber shear walls. PhD thesis, University of British Columbia, Vancouver, Canada 16. van de Lindt JW (2004) Evolution of wood shear wall testing, modeling and reliability analysis: bibliography. Pract Period Struc Des Constr 9(1):44–53
17. Pang WC, Rosowsky DV, Pei S, van de Lindt JW (2007) Evo-lutionary parameters hysteretic model for wood shear walls. J Struc Eng 133(8):1118–1129
18. Li M (2009) Seismic performance of post-and-beam wood buildings. PhD thesis, University of British Columbia, Vancou-ver, Canada
19. Foschi RO (2000) Modeling the hysteretic response of mechan-ical connections for wood structures. In: Proc 6th WCTE, Whistler, Canada
20. Li M, Lam F (2009) Lateral performance of nonsymmetric diagonal-braced wood shear walls. J Struc Eng 135(2):178–186 21. Li M, Lam F, Foschi RO (2009) Seismic reliability analysis of
diagonal-braced and structural-panel-sheathed wood shear walls. J Struc Eng 135(5):587–596
22. Li M, Foschi RO, Lam F (2011) Modeling hysteretic behavior of wood shear walls with a protocol-independent nail connection algorithm. J Struc Eng http://dx.doi.org/10.1061/(ASCE)ST. 1943-541X.0000438(in press)
23. Japan Housing and Wood Technology Centre (HOWTEC) 2004 Allowable stress design for wooden post-and-beam construction 24. Japan Building Disaster Prevention Association 2006 Seismic