http://www.sciencepublishinggroup.com/j/cse doi: 10.11648/j.cse.20190301.12
The Effect of Zinc Acetate Concentration on Optical
Properties of ZnS Thin Films by Spectroscopic
Ellipsometry Analysis Method
Batool Ahmadi Khanegahi, Hassan Sedghi
Department of Physics, Faculty of Science, Urmia, Iran
Email address:
To cite this article:
Batool Ahmadi Khanegahi, Hassan Sedghi. The Effect of Zinc Acetate Concentration on Optical Properties of ZnS Thin Films by Spectroscopic Ellipsometry Analysis Method. Control Science and Engineering. Vol. 3, No. 1, 2019, pp. 6-11.
doi: 10.11648/j.cse.20190301.12
Received: December 3, 2018; Accepted: December 14, 2018; Published: March 28, 2019
Abstract:
In the present work ZnS thin films with different concentration (0.25, 0.5, 0.75 and 1 M) have been deposited on glass substrates by sol–gel spin coating method using an acidic solution, containing zinc acetate (Zn(CHC3COO)2.2H2O) andthiourea (CH4N2S) as precursors. The optical properties of ZnS thin films such as refractive index, extinction coefficient,
dielectric function and band gap energy of the films were obtained by spectroscopic ellipsometry analyzes method in the wavelength of 300 to 800 nm. Considering the data obtained, it can be deduced that the optical properties of ZnS films is highly influenced by Zn concentration. The extinction coefficients (k) of the films were increase with increasing concentration of zinc acetate. From these results it is found that the energy gap of the ZnS films decreases with increasing concentration of zinc acetate in the range of 3.65-2.75eV.
Keywords:
Spectroscopic Ellipsometry, Zn Concentration, Thin Film, Zinc Sulfide, Optical Properties1. Introduction
ZnS is an important direct gap semiconductor of 3.58eV
[1], and has attracted considerable research interest due to their variety of applications, such as optoelectronic devices [2], photoluminescence [3], photoconductors [4], optical sensors [5], phosphors [6] , solar cells [7] and etc.
ZnS films have been deposited by a number of methods including sol-gel [8], chemical vapour deposition [9] and atomic layer epitaxy [10]. The characteristic of these methods is that they require expensive deposition equipment particularly where very large areas have to be covered.
A cheap method of producing such display materials would considerably enhance the possibility of commercial usage. This paper describes a simple, non – vacuum method of producing undoped zinc sulphide films and it is mainly focused on the synthesize and characterizations of ZnS thin films prepared by the sol – gel spin coating deposition. The optical characteristics of the films produced by this method are described and it is shown that they are similar to zinc sulphide films produced by other method.
Spectroscopic ellipsometry (SE) is an optical measurement
technique that characterizes light reflection (or transmission) from samples [11]. The key feature of ellipsometry is that it measures the change in polarized light upon light reflection on a sample (or light transmission by a sample). Ellipsometry measures the two values ( , Δ). These represent the amplitude ratio and phase difference Δ between light waves known as p- and s-polarized light waves. In spectroscopic ellipsometry, ( , Δ) spectra are measured by changing the wavelength of light. In general, the spectroscopic ellipsometry measurement is carried out in the ultraviolet/visible region. Spectroscopic ellipsometry has been applied to evaluate optical constants and thin-film thicknesses of samples.
In this work the optical properties of ZnS thin films with
different Zn concentration were examined using
spectroscopic ellipsometry measurement.
2. Materials and Method
ZnS thin films were synthesized via simple sol – gel method at different concentration values of zinc acetate. The sol was prepared with Zn(CH3COO)2.2H2O and CH4N2S as
starting precursors and 2-methoxyethanol and
The molar ratio of MEA to zinc acetate was maintained at 1.0. The S/Zn molar ratio was 1 in the mixture. The solution was stirred at 80°C for 120 min to become a homogeneous. The solution was aged for 24 h at room temperature. Before the deposition, the substrates were cleaned thoroughly using acetone and de – ionized water. The films were deposited on glass substrates using spin coater at the coating speed of 3600 rpm. After deposition, the films were preheated at 200 for 10 min and they were annealed at 500 for 1 hour.
In this work, the optical analyzing process was done by
SE800DUV (SENTECH) spectroscopic ellipsometry
instrument with the measurement wavelength of 300-800 nm, which applies the Step Scan Analyzer measurement mode. SE method was used to extract the optical parameters of the layers such as optical band gap . Ellipsometry parameters ,
Ψ, Δ were recorded at an incidence angle of 70º.
3. Results and Discussion
Ellipsometry is an optical measurement technique that characterizes light reflection (or transmission) from samples. The key feature of ellipsometry is that it measures the change in polarized light upon light reflection on a sample (or light transmission by a sample). Ellipsometry measures the two values ( , Δ). These represent the amplitude ratio and phase difference Δ between light waves known as p- and s-polarized light waves. In spectroscopic ellipsometry, ( , Δ) spectra are measured by changing the wavelength of light. In general, the spectroscopic ellipsometry measurement is carried out in the ultraviolet/visible region. Spectroscopic ellipsometry has been applied to evaluate optical constants and thin-film thicknesses of samples.
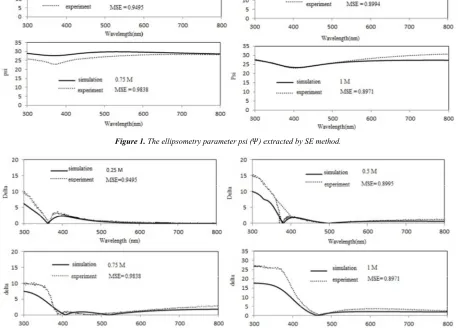
Figure 1. The ellipsometry parameter psi ( ) extracted by SE method.
Figure 2. The ellipsometry parameter delta ( ) extracted by SE method.
The optical properties of ZnS thin films grown on glass substrates were investigated by using spectroscopic ellipsometric measurements. The experimental data was taken at an incident angle of 70° and then fitted theoretically
using Lorentz model. The measured spectroscopic
ellipsometry parameters Ψ and Δ are fitted against the designed model in the spectral range from 300 nm to 800 nm
by minimizing the square error (MSE), is shown in figures 1 and 2. The mean square error is used to qualify the difference between the experimental and fitted data, and is calculated by following equation.
∑ !"#$%&'$ ($
Where +) is standard deviation of the i-th data point, N is number of data point, ,-) is i-th experimental data point and ./) is i-th calculated data point from assumed theoretical model. When the model matches the experimental data as closely as possible the mean square error exhibits a minimum value.
The model used to analyze the ellipsometry data consists of a glass substrate, ZnS thin film, surface roughness layer and air. Surface roughness layer was modelled by effective
medium approximation (EMA). Adding surface roughness layer, improves the MSE value compared to the single layer model. The model used to analyse is shown in Figure 3.
The (Ψ, Δ measured from ellipsometry are defined from the ratio of the amplitude reflection coefficients for p- and s-polarizations:
0 ≡ 234 exp 7Δ ≡89
8: (2)
Figure 3. (a)ZnS sample with surface roughness (b) optical model used for analyze the ellipsometry data.
The calculated refractive index (n) of the ZnS thin films with different Zn concentration using spectroscopic ellipsometry method is shown in Figure 4. As it can be seen, there is a peak in n as a function of wavelength for all layers. By increasing Zn concentration this peak is shifted to higher wavelengths.
Figure 4. Variation of ‘n’ as a function of wavelength for ZnS thin films with
different Zn concentration.
The extinction coefficient (k) as a function of wavelength
for ZnS thin films with different Zn concentration were calculated using spectroscopic ellipsometry method. It can be deduced from Figure 5 that by increasing wavelength, the extinction coefficient (k) of all layers decreases. Also increasing Zn concentration leads to increase in the extinction coefficient values. The layers with zinc acetate concentration of 0.25 and o.5 M were transparent in the visible wavelength.
Figure 5. Variation of ‘k’ as a function of wavelength for ZnS thin films with
different concentration.
The real and imaginary part of dielectric function obtained by spectroscopic ellipsometry measurement method is shown in Figure 6. Increasing Zn concentration up to 0.75 M leads to decrease in real part of dielectric function Figure 6a. Figure 6b shows that by increasing Zn concentration, the imaginary part of dielectric function increases.
The real and imaginary part of conductivity were plotted as a function of wavelength for different concentration of Zinc acetate and found in Figures 7a and b. The optical conductivity is calculated using following equation’s [12].
+ = >?
@A (3)
+< %=B>?
@A (4)
As is shown in Figure 7a increasing Zn concentration resulted in increasing the real part of conductivity. By increasing wavelength, the imaginary part of conductivity decreases, as is shown in Figure 7b.
The increased optical conductivity at low wavelength is due to the high absorbance of ZnS thin films in that region [13].
Figure 7. Variation of + (a) and +< (b) as a function of wavelength for ZnS thin films with different Zn concentration.
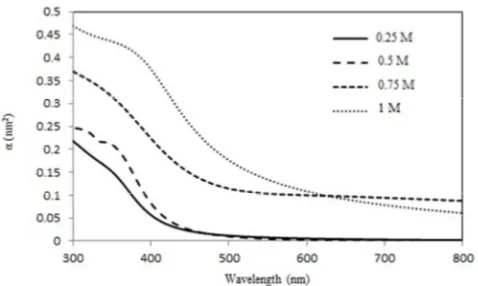
The absorption coefficient (C was calculated as a function of wavelength of ZnS thin films with different concentration of Zn.
The optical absorption coefficient (C is determined using the following equation [14].
C @AD
E (5)
Where (k) is the extinction coefficient (k) and F is the wavelength. As is shown in Figure 8, by increasing zinc acetate concentration the absorption coefficient increases. Also for all films it can be deduced from figure 8 the increasing wavelength leads to decreasing of absorption coefficient to a constant value in visible range.
Figure 8. Variation of absorption coefficient (C for ZnS thin films with
different Zn concentration.
The optical band gap (Eg) of ZnS thin films was evaluated
from the optical absorption coefficient(C near the absorption
edge for allowed direct transitions and is given by Eq.6 [15].
C/υ B /υH ΕJ K (6)
Where B is an energy dependent constant, Eg is the band
gap of the material, /L is photon energy, and n is an index that characterizes the optical absorption process and it theoretically equal 2, 1/2, 3 and 3/2 for indirect allowed, direct allowed, indirect for- bidden and direct for-bidden transitions respectively.
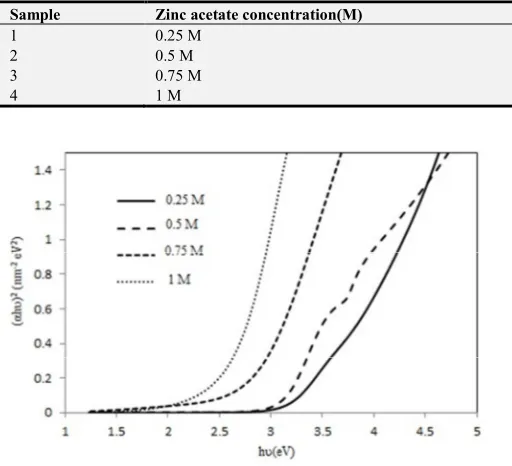
The optical band gap was calculated by extrapolating the linear portion of the (αhυ) 2 versus hυ curve towards energy axis. The variation of (αhυ)2 with photon energy hυ is shown in figure 9. The optical energy gaps have linear decreasing trend from 3.65 to 2.75 eV with increase of concentration from 0.25 to 1 M.
The E-axis interception in this figure reflects the direct allowed transitions in our prepared samples. This behavior is in agreement with that reported in the literature for ZnS nanocrystals and thin films [16].
As shown in Figure 8, the direct band gap energy decreases progressively from about 3.65 to 2.75 with increasing in concentration values from 0.25 to 1 M. The decrease of optical band gap could be attributed to the structural and morphological change as well as the stoichiometric deviations in the film, which gave rise to the formation of located states in the band gap region. Other possibilities to explain this change in optical band gap could be related to the increase in particle size and this is well known for colloidal semiconductors [17, 18].
(Eg) of 3.65 eV, which closely agreed with other values previously reported for ZnS bulk [19].
The calculated values of optical band gap energy of all films is shown in table1.
Table 1. The values of optical band gap energy and MSE for ZnS thin films with different Zn concentration.
Sample Zinc acetate concentration(M) Energy gap(eV) MSE
1 0.25 M 3.65 eV 0.9495
2 0.5 M 3.25 eV 0.8994
3 0.75 M 3.15 eV 0.9838
4 1 M 2.75 eV 0.8971
Figure 9. Variation of band gap for ZnS thin films with different Zn
concentration.
4. Conclusions
ZnS thin films with different Zn concentration values (0.25, 0.5, 0.75 and 1 M) have been produced on glass substrates by simple sol – gel method. Optical constant (n and k) of the films were determined using spectroscopic ellipsometry method. The band gap energy of the ZnS thin films is found to be dependent on the Zn concentration. However, there are many factors effects the change band gap energy of the ZnS thin films. From these results it is found that the energy gap of the ZnS films decreases with increasing concentration of zinc acetate in the range of 3.65-2.75eV.
References
[1] S. Vesna, H. E. Thomas, C. P. Alain, and, J. M. Randy, “Sol-gel processing of ZnS,” J. Matterials Letters, vol.35, pp.35-38, 1997.
[2] M. Saeed. A, Saiva. R and N. Shahzad, “Optical properties of sol-gel deposited ZnS thin films: spectroscopic ellipsometry,”International Conference on Solid State Physics, vol.2, pp.5497-5503, 2015.
[3] K. Raju, C. R. N. Baghel, V. K. Chandra and B. P. Chandra, “Synthesis, characterization and photoluminescence studies of undoped ZnS nanoparticles,” J. Superlattices and
Microstructures, vol. 84, pp. 132-143, 2015.
[4] H. F. Mohd, and K. Rajneesh, “Structural, optical and photoconductivity study of ZnS nanoparticles synthesized by a low temperature solid state reaction method,” J. Materials Science in Semiconductor Processing, vol.20, pp.
61-67, 2014.
[5] Y. Ali. and J. Aseel, “NO2 Gas Sensing Properties of Nanoparticle Zinc Sulfide Films Sensors Prepared by Chemical Spray Pyrolysis,” International Journal of Basic and Applied Science, vol.03, pp. 1-20, 2015.
[6] Q. Lai, I. L. Burtrand, M. K. Jong, E. J. Jae, and Y. C. Jae, “Synthesis and characterization of ZnS: Cu, Al phosphor prepared by a chemical solution method,”J. Luminescence, vol.104, pp. 261-266, 2003.
[7] O. O. Isaiah and C. Lee, “Synthesis and processing of CdS/ZnS multilayer films for solar cell application,” J. Thin Solid Films, vol.474, pp.77-83, 2005.
[8] M, I. Rusu, C. R. Stefanb, M. Elisab, I. D. Ferarub, I. C. Vasiliub, C. Barthac, R. D. Truscad, E. Vasiled and S. Peretze, “CdS/ZnS-doped silico-phosphate films prepared by sol-gel synthesis,” J. Journal Non- Crystalline Solids, vol. 481, pp. 435-440, 2018.
[9] Z. Z. Zhang, D. Z. Shen, J. Y. Zhang, C. X. Shan, Y. M. Lu, Y. C. Liu, B. H. Li, D. X. Zhao, B. Yao, and X. W. Fan, “The growth of single cubic phase ZnS thin films on silica glass by plasma-assisted metal organic chemical vapor deposition,” J. Thin Solid Films, vol.513, pp. 114-117, 2006.
[10] C. H. Su, P. Zhang, T. N. Zhang, Y. Y. Chen, and Z. H. Ye, “ZnS thin films grown by atomic layer deposition on GaAs and HgCdTe substrates at very low temperature,”J. Infrared Physics and Technology, vol.85, pp.280-286, 2017.
[11] M. Oikkonen, M. Tammenmaa and M. Asplund, “Comparison of ZnS thin films grown by atomic layer epitaxy from zinc acetate and zinc chloride: An x-ray diffraction and spectroscopic ellipsometry study,”J. Materials Research Bulletin, vol.23, pp.133-142, 1988.
[12] H. Kangarlou and M. M. Aghgonbad, “Deposition-rate dependence of optical properties of titanium
[13] Nanolayers, Ukr. J. Phys. Opt, vol.13, pp.4-11.2012.
[14] M. Y. Nadeem and W. Ahmed, “Optical Properties of ZnS Thin Films,” Turkish Journal of Physics, vol. 24, pp. 651-659, 2000.
[15] J. Yuvaloshin, Ra. S and G. Ravi, “Effect of annealing on optical and structural properties of ZnS/MnS and MnS/ZnS superlattices thin films for solar energy application,” J. Optic, vol.125, pp.1775-1779, 2014.
[17] K. B. Bacha, A. Timoumi, N. Bitri and H. Bouzouita, “Structural, morphological and optical properties of sprayed ZnS thin films on various substrate natures, “J. Optik, vol.126, pp. 3020–3024, 2015.
[18] X. Xu, F. Wang, Z. Li, J. Liu, J. Ji and J. Chen, “The Effect of Thickness Nanoparticle ZnS Films on Optical Propertie,” J. Electrochim. Acta, vol.87, pp.511-517, 2013.
[19] R. W. Miles, O. E. Ogah, G. Zoppi and I. Forbes, “Photosensitivity of ZnO/Cu20 thin film hetrojunction,” J. Thin Solid Films, vol.517, 2009.