http://www.sciencepublishinggroup.com/j/ijfmts doi: 10.11648/j.ijfmts.20190502.11
ISSN: 2469-8105 (Print); ISSN: 2469-8113 (Online)
Optimization of S-Shaped Air Intake by Computational
Fluid Dynamics
Hamid Parhrizkar
1, Kiumars Khani Aminjan
1, *, Mohammad Mahdi Doustdar
2, Ahad Heydari
31
Faculty of Aerospace Engineering, Malek Ashtar University of Technology, Tehran, Iran 2Faculty of Engineering, Imam Hossein University, Tehran, Iran
3
Faculty of Engineering, University of Mohaghegh Ardabili, Ardabil, Iran
Email address:
*
Corresponding author
To cite this article:
Hamid Parhrizkar, Kiumars Khani Aminjan, Mohammad Mahdi Doustdar, Ahad Heydari. Optimization of S-Shaped Air Intake by Computational Fluid Dynamics. International Journal of Fluid Mechanics & Thermal Sciences. Vol. 5, No. 2, 2019, pp. 36-42. doi: 10.11648/j.ijfmts.20190502.11
Received: March 21, 2019; Accepted: May 10, 2019; Published: June 4, 2019
Abstract:
Due to the presence of air intakes outside the body of some missiles with research objectives as well as some unmanned aerial, the use of the air intake duct in S-shaped is necessary and therefore the air flow quality must be determined, with the most important parameters being the total drop and distortion is from the beginning of the air intake until the delivery phase to the engine. In this research, it has been determined that the optimum air intake geometry is determined according to the dimensions of a unmanned aerial. Therefore, we first tried to optimize the geometry of S-shaped air intake and then optimize this geometry based on the reduction of total pressure drop. The computational grid with ICEM software and mesh analysis by computational fluid dynamics (Fluent software) has been done. Given that the intake of unmanned aerial was considered in this study, Mach flight is considered 0.3. Since the output section is actually the same section of the motor, whose cross section is constant, it has been considered in optimizing the inlet section and the wall. By optimizing geometry, the total pressure drop dropped to about half. Given the fact that the optimization repetition resulted in undesirable changes in geometry, optimization of geometry was not repeated. Additionally, by comparing the optimized geometry with the initial geometry, It is known that the slow rotation of the flow (the lower rotation angle) reduces the total pressure drop and reduces the amount of distortion. In the end, the results of the numerical solution with the experimental results presented by NASA have been investigated, which indicates that the numerical solution is desirable.Keywords:
S-Shaped Air Intake, Pressure Drop, Geometry Optimization, Distortion1. Introduction
The entrance ports of the aircraft and the input channel connected to it are designed to direct the air flow to the required extent from the environment to the inlet section of the engine, and another task is to convert the free-flow kinetic energy to the static pressure at the compressor cross-section. The channel design should be such that free flow velocity decreases smoothly and slowly, resulting in an increase in static pressure with uniform flow distribution at the compressor inlet section. The greater the flying plane of the plane will make the design of the entrance channel more complicated. The input channel efficiency has a direct effect
compressor section must be as long as the motor is tolerant. Therefore, the design of this set must be such that the required air (the desired discharge) is engineered with a minimum pressure drop and with a suitable distortion and with the least uniform flow of flow (Distortion) into the motor compressor. These characteristics depend entirely on the size and size of the inlet and diffuser openings. The shapes and sizes are directly related to the characteristics of the aircraft and the layout of its components.
The input channel, named as one of the main sections of the aircraft, has always been in the design of the aircraft and has been trying to increase its efficiency to minimize the loss of trusts in the aircraft engine. Almost all modern fighters use S-shaped inputs. These inputs are facing varying demands on the engine. Today, jet engines have lower compressor and high pressure ratios in each stage, and are therefore highly sensitive to current variations. These dependencies made the designers make more efforts to integrate the engine and input with the optimum input on the aircraft. Aerodynamic specialists have resorted to experimental and numerical methods due to the complex nature of the flow in these entrances. Thin et al. [1] designed a s-shaped air intake duct for the Boeing 727 aircraft. In this research, a 2D analysis code of potential flow for the outside of the boundary layer and a boundary-layer solution code and their coupling The use of the vortex generator in the lower wall of the duct had a relatively large effect on the flow core at the outlet and the output stream was somewhat more uniform. Little and colleagues [2] investigated the experimental flow of a s-duct at the entrance of a high speed jerk motor. They tested three different shapes on a motor, measuring the total and static pressure distribution at the outlet The ducts obtained the output deformation rate. The results showed that an increase in the output-to-duct input ratio from 1 to 1/25 resulted in a 5% recovery loss.
McDell et al. [3] devised an analytical design of a s-duct for a turboprop with some deviations due to the gearbox. They used empirical methods to evaluate the flow through the duct. Lawyers and colleagues [4] conducted an empirical study of condensing secondary flow in a s-duct with circular cross-section. Richter [5] examined the effect of the vortex generator on the internal flow of a s-duct. The results of this study showed that the vortex generator eliminates the return flow in the s-duct and the flow in the output becomes much more uniform. Richter et al. [6] tried to improve the performance of the s-duct by reducing the flow of the duct and controlling it. In this study, the effect of the number of vortex producers and their distance was also investigated. Finally, it was concluded that, by installing the vortex generator to reduce the secondary flow, the s-duct performance improved significantly.
Lee et al. [7] optimized the aerodynamics of a s-duct sample by numerical method. In this research, a non-navigational equation solving code, coupled with a two-equation turbulence model for flow resolution, was used. Finally, an air duct shape optimized aerodynamics and its return flow was greatly eliminated, and the total pressure
contour in the output was more uniform Became Wing et al. [8] controlled the rotation of the flow in a rectangular cross-sectional s-duct to improve its performance at an angle of attack. They used a variable-angle blade in the first bend of the duct and a moving edge at the inlet to control the rotation of the flow and test They performed the aerodynamics in an infrared wind tunnel. Meyer et al. [9] have designed designs for a subfloor design. In fact, the purpose of this design was to reduce the weight of the bird, in which it was tried to design a curved, shorter length than a bird's weight Less crap. Lopez et al. [10] performed numerical analysis of the flow in a s-duct using the LES disturbance model. In this work, the effects of mesh and meshing were considered, and finally, the result was that how the mesh The placement is very important near the location where the curvature of the curve changes.
Pradeep et al. [11] tried to experiment with the secondary flow control by generating vortex, and this method improved the performance of the s-shaped duct with a circular cross section. In this study, the stream of outflow from the duct was tried to be more uniform As well as recycling, more pressure is achieved. Also, the jet mass flow rate was considered to be about 10% of the mass flow rate of the main current, and using a jet producing vortex, a more uniform flow of flow and a better overall pressure recovery were achieved. By using the vortex generator method, about 20% of the pressure drop was lost, and the thickness of the boundary layer in the outlet of the duct and in the inner wall was about 40% and in the outer wall about 10%. The turbulence intensity of the outlet stream was also reduced by about 30% using the jet of the vortex generator. Muller [12] studied the numerical and experimental flow in the form of M2129 s. In this research, the WIND_US code was used for numerical analysis and two types of organized and organization meshs. They tried to determine the effect of the blades on the flow path separation. When there was no blade inside the duct, there was a large in-duct return flow area both in numerical analysis and in the empirical investigation. But when the blades were used inside the duct, this region returned from The boundary layer remained largely sticking to the wall, and the overall pressure drop was also reduced. The flow of s-shaped inputs can be separated. One way of controlling the flow in the s-channels is to create a vortex at the input. By creating a vortex at the input and control, it attempts to not cause any separation within the duct. The field of activity was carried out by Adam Perriysk [13]. In fact, by creating the vertex at the input, the separation of the flow formed within the s-duct completely disappeared.
Latif and his colleagues [15]. The result obtained in this study was that for S-shaped ducts with the same central line, Changing the cross-section and increasing it, the flow separation zone moves towards the entrance of the duct. When the output-to-input ratio is equal to 1 and the 30.30-duct curve has no return flow inside the 30.30-duct. As the surface ratio increases, the separation region of the flow (return flow) is generated inside the duct. In a s-duct with an angle of twenty 30.30 with an increase in the ratio of the surface area of 1 to 1.9, the amount of pressure recovery rises from 19% to 41%. The rise of the surface ratio of 1.51 to 1.9 causes excessive fluctuations and no significant effect on recycling. Zhang et al. [16] investigated the multidisciplinary design of a s-wave duct. In this research, a strategy was developed to allow a combination of multidisciplinary design to achieve an optimal design from an aerodynamic and electromagnetic viewpoint.
Became Johnson et al. [17] investigated the numerical analysis of the flow in a s-duct along with the suction of the boundary layer. In this study, the effect of the suction of the boundary layer was numerically simulated and for numerical verification purposes, the results of numerical analysis were compared with the experimental results. This indicates a good accuracy of the numerical method. Inside Iran, there have also been some activities in this field that can be cited by Bayati et al. [18]. In this study, using the analytic relationships governing inputs and taking into account geometric constraints, the aerodynamic design of the air intake s The shape of a jet drone bird was compared with the results of manual calculations. After designing the average flow line and dimensions of the duct, using numerical fluid dynamics, optimizing its geometry, taking into account the maximum input pressure recovery and minimal turbulence, was applied. Improved turbulence, reduced flow turbulence and increased pressure recovery have resulted in optimization results at this air intake. Successful ground and air tests confirmed the optimized air intake performance. A numerical study of the flow in the s-duct of a bird was carried out by Qasem Behfrzad et al. [19]. In this study, the goal is to determine the best geometry of the s-duct in order to achieve a minimum total pressure drop. In the same year, another activity was carried out by Mr. Qasem Behfrzad and his colleagues [20] in the field of reducing the return flow and reducing the total pressure drop in s-shaped ducts. In this study, the effects of vortex plates and blow-ups on the boundary layer were investigated. Finally, it was concluded that both methods (cross-sectional plates and blow-ups of the boundary layer) had no significant effect on the reduction of the pressure drop, but had a relatively large effect on the uniformity of the output current.
2. Method
Fluent software is used in order to provide a numerical solution in this study. The fluent software works based on finite volume method. Solution is primarily meshed in pre – processer ICEM software. The generated network are fluent
software inlet for numerical solution.
2.1. Input Geometry Profile
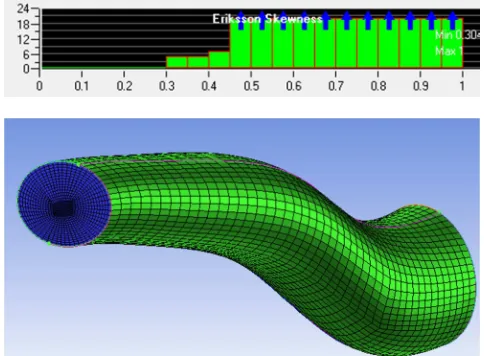
The geometry of the S-shaped air input is shown in Figure. 1, and its geometric characteristics are as follows. It is worth mentioning that the inputs are designed for a drone:
1 The shape of the inlet section is elliptic in shape, with a large diameter of 140 mm and a small diameter of 90mm.
2 Input Length: Input duct is 1m.
3 Input height) The vertical distance between the center of the cross section and the duct outlet is 300 mm. 4 The shape of the cross-section of the circle with a
diameter of 190mm.
Figure 1. The geometry of air intake.
2.2. Boundary Conditions and Meshing of the Flow Field
In the analyzes that have been done in this study, structured meshing has been used (Figure 2), and due to the independence of the mesh, the mesh has been sufficiently thinned.
The boundaries of the field and boundary conditions related to each one are:
Border 1: Flow Inlet Flow (0.3) Pressure (5e1) and Hydraulic Diameter (0.11)
Border 2: Output current (motor input) (with definite hydraulic diameter (0.15)
Border 3: Adiabatic air duct wallDespite the fact that for uneven geometry problems with many complexities, the application of non-uniform meshing is inevitable, but in this project, good quality meshing is used.
2.3. Governing Equation and the Numerical Method
The governing equations are three-dimensional non-convex Navier Stokes equations that are used to solve these equations using finite volume method. In relation (1), the Navier Stokes relationship with the form (RANS) is given:
0 (1)
φu µ
!"́!$́ (2)
In the above relation, Term !"́!$́ shows the effect of turbulence and i, j, l of the current components. Recent analysis and results show that the accuracy of the perturbation equations is considered to be the geometry of the model and the type of analysis.
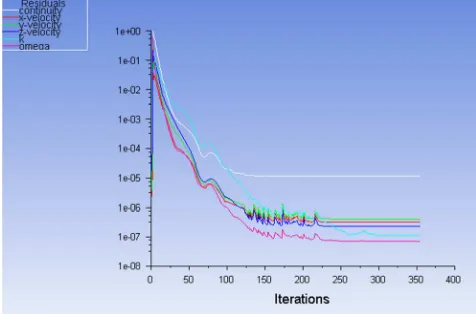
Navier Stokes equations are solved explicitly and simultaneously in a steady state. In this regard, Fluent Computational Fluid Dynamics software is used, the air agent fluid is assumed to be a complete gas. For numerical solution convergence, two criteria are considered and examined in each repetition. One criterion is the reduction of the remaining solving of all the governing equations and the total pressure at the outlet which is investigated by mass flow integral over these boundaries in each repetition (Figures 3, 4).
Figure 3. Total pressure result at outlet for numerical solution Convergence.
Figure 4. Residuals result for numerical solution Convergence.
2.4. Choosing Turbulent Model
The transition model governing the K-ω standard turbulent model is expressed as the following transitional equations.
φk & '() )* +) ,) (3)
φw . '(/ /* +/ ,/ (4)
In these equations, Gk represents the generation of turbulent kinetic energy under the influence of the mean velocity gradient and Gω represents the production of ωm. And lk and lω respectively represent K andω, Yk and Yω, respectively, respectively, and respectively the turbulent K and ω, respectively. There are two K-ω and K-ω SST disturbances in the Fluent software. The K-ω SST model has been used in this study.
2.5. Independence Review the Results of Numerical Analysis from the Number of Cells
In order to investigate the ineffectiveness of the results of numerical analysis of the mesh, the previous analysis was repeated with a doubling of the number of cells, which revealed a slight error indicating the independence of the results from the number of cells. The results are summarized in Table 1 Come:
Table 1. Summary of numerical analysis results.
Cell number
Initial pressure drops (Pa)
Initial air intake efficiency (%)
Distortion value in the initial input air outlet (%)
Pressure drop after optimization (Pa)
Optimized air intake efficiency (%)
The amount of distortion in the air inlet output is optimized (%)
46060 768.52 98.28 32 443.28 98.57 22.8
102885 748.75 98.33 33.2 429.35 98.61 23.1
2.6. Validation
The foundations of numerical methods and the idea of solving problems based on them have been largely effective and efficient, but human confidence by its own hands and those advanced methods have not yet succeeded in validating the results. Therefore, in all investigations and research is the
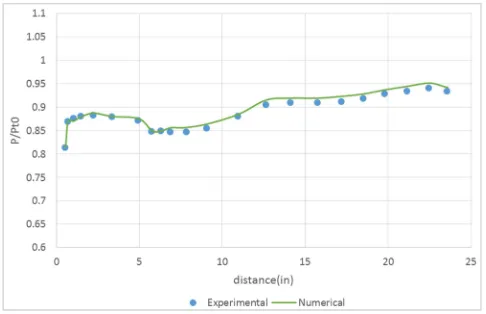
about 12.9 cm, and the diameter of the engine section of about 15.2 cm. The analysis at Mach was 0.12 and the total pressure was 0.19899 Pascal, the total temperature was 627.19 and the angle of attack was zero degrees. In Figures 5, 6, and 7, the above geometry is compared with the results of [21], which indicates that the numerical solution is desirable.
Figure 5. Modeling the geometry case study in the [21].
Figure 6. Comparison of the distribution of pressure in top wall in numerical and experimental tests.
Figure 7. Comparison of the distribution of pressure in port wall in numerical and experimental tests.
3. Result
The simulation result are presented in Figure 8:
Figure 8. Display the total pressure contour along the input channel.
The total pressure drop in this mode is equal to 786.52344 Pa. Therefore, the amount of air intake efficiency will be equal to:
ɳ1 2 456 762 8 76 98.284% (5)
Meanwhile, due to the relatively common standard of quantitative distortion in the reports, according to this ratio, the amount of rye is calculated as follows:
? 2 456 76@ A
B2 456 76 32% (6)
Given that the input of the air has been considered in a drone, the efficiency is considered appropriate. It is obvious, however, that the actual efficiency may be slightly lower than the above, this also applies to distortion rates. In the following theresults of geometry optimization provided.
Due to the fact that the air intake outlet is equal to the sectional area of the engine and the motor's cross-sectional area is constant, it has been considered in the optimization of the inlet section of the air inlet and the entrance wall of the air, as shown in Figure 9
The total drop in this mode is equal to 443.28906 Pa, and its efficiency and distortion are as follows:
ɳ1 2 456 762 8 76 98.576% (7)
? 2 456 76@ A
B2 456 76 22.8% (8)
4. Discussion
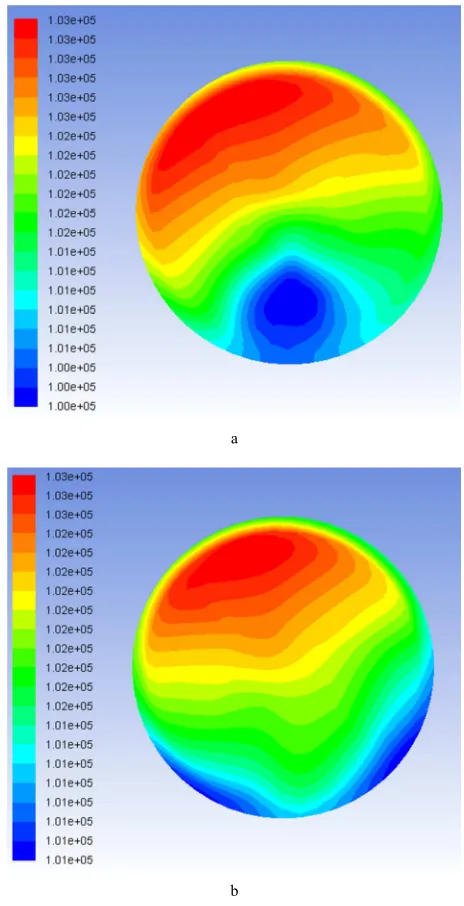
By comparing the results of the optimization with the main state, it is clear that by optimizing the efficiency, the amount of distortion decreases. In the following, comparing the initial geometry with optimized geometry in Figures 10 and 11 shows:
a
b
Figure 10. a) Total pressure contour in the initial geometry b) Total pressure contour in optimized geometry.
a
b
Figure 11. a) Total pressure contour in the engine face in initial geometry b) Total pressure contour in the engine face in optimized geometry.
By comparing optimized geometry or initial geometry, it's evident that a smooth and uniform rotation of the current leads to increased efficiency and reduced distortion. Optimum geometry can also be optimized again, but there must be restrictions such as installation restrictions and... It is also considered because refinement leads to the removal of geometry from its original form.
5. Conclusion
increased about 0.3%. Of course, with re-optimization, we were able to further reduce the total pressure drop, but given the fact that further optimization would lead to adverse changes in geometry, re-optimization of geometry did not repeat. By comparing the optimized geometry with initial geometry, it can be understood that a slow rotation (lower rotation angle), in addition to reducing the total pressure drop and increasing the intake efficiency, it generates uniform total pressure distribution on engine face and reduces distortion so that in this study, the distortion amount decreased by about 9%. It is suggested that this analysis be repeated at different flight mach number and various attack angles. The effect of bending and the distance between the centers of the entrance and exit sections and the length of each section of the air inlet can also be interesting subjects for research.
References
[1] Ting CT, Kalosclimidt G, Syltebo BE (1975) Design and testing of new center inlet and S–duct for B–727 airplane with refanned JT8D engines. Report/Patent Number: AIAA PAPER: 75–59.
[2] Little BH, Trimboli WS (1982) An experimental investigation of S-duct diffusers for high-speed prop-fans. Report/Patent Number: AIAA 82–1123.
[3] McDill PL, Tolle LI (1983) Analytical design and experimental verification of S-duct diffusers for turboprop installations with an offset gearbox. Report/Patent Number: AIAA PAPER 83–1211.
[4] Vakili A, Wu JM, Liver P, Bhat MK (1983) Measurements of compressible secondary flow in a circular S-duct Report/Patent Number: AIAA PAPER 83–1739.
[5] Reichert BA, Wendt BJ (1993) An experimental investigation of S-duct flow controling arrays of low–profile vortex generators. Report/Patent Number: AIAA PAPER 93–18. [6] Reichert BA, Wendt BJ (1994) Improving diffusing S-duct
performance by secondary flow control. Report/Patent Number: AIAA PAPER 94–0365.
[7] Lee BJ, Kim C, Rho OH (2003) Aerodynamic optimization for the subsonic S-shaped diffuser using two-equation turbulence models. Report/Patent Number: AIAA PAPER 2003–3960.
[8] Weng PF, Guo RW (1994) On swirl control in an S-shaped air intake high angle of attack. Report/Patent Number: AIAA PAPER 94–366.
[9] Mayer DW, Anderson BH, Johnson TA (1998) 3D subsonic diffuser design and analysis. Report/Patent Number: AIAA PAPER 98–3418.
[10] Silva Lopes A, Piomelli U (2003) Large eddy simulation of the flow in an S-duct. Report/Patent Number: AIAA PAPER 2003–964.
[11] Pradeep AM, Sullerey RK (2004) Secondary flow control in a circular S-duct diffuser using vortex generator jets. Report/Patent Number: AIAA 2004–2615.
[12] Stanley R, Mohler Jr (2004) Wind-US flow calculations for the M2129 S-duct using structured and unstructured grids. Report/Patent Number: AIAA 2004–525.
[13] Jirasek A (2006) Design of vortex generator flow control in inlets. J Aircraft, 43 (6).
[14] Kirk AM, Rediniotis OK, Cizmas PGA (2007) Numerical and experimental investigation of a serpentine inlet duct. Report/Patent Number: AIAA 2007–842.
[15] Abdellatif OE, Abd Rabbo M, Abd Elganny M, Shahin I (2008) Area ratio effect on the turbulent flow through a diffusing S-duct using large–eddy simulation. Report/Patent Number: AIAA 2008–5726.
[16] Zhang JM, Wang CF, Lum KY (2008) Multidisciplinary design of S-shaped intake. AIAA 2008–7060.
[17] Johnson BC, Webster RS, Sreenivas K (2010) A numerical investigation of S-duct flows with boundary layer ingestion Report/Patent Number: AIAA 2010–841.
[18] Bayati Morteza, Fathi Mahdi, Bahmani NadAli, Gholami Ali (2007), Aerodynamic design and aerodynamic optimization of engine air intake of a jet drum.
[19] BehfardShad Qasem, Forghani Farzad (2009), Numerical investigation of total pressure in a S-shaped air intake duct in different Mach numbers, 8th International Aerospace Conference.
[20] BehfardShad Qasem, Mahlou Saeud, Kadivar Amin (2009), Investigating the effects of the installation of vortex plate and floating-point blown plates on the efficiency of a bending air intake duct, International Aerospace Conference.