http://www.sciencepublishinggroup.com/j/wjph doi: 10.11648/j.wjph.20190403.13
ISSN: 2637-6040 (Print); ISSN: 2637-6059 (Online)
Prevalence and Trends of HIV and Syphilis Among Blood
Donors in the Northern Region of Ghana; A Five-year
Retrospective Study
Abdulmuizz Tikumah Muktar
1, *, Adadow Yidana
2, Michael Wombeogo
1, Enoch Weyori Weikam
31Department of Public Health, School of Allied Health Sciences, University for Development Studies, Tamale, Ghana 2
Department of Community Health and Family Medicine, School of Medicine and Health Sciences, University for Development Studies, Tamale, Ghana
3
National Aids Control Programme, Ghana Health Services, Northern Region, Ghana
Email address:
*Corresponding author
To cite this article:
Abdulmuizz Tikumah Muktar, Adadow Yidana, Michael Wombeogo, Enoch Weyori Weikam. Prevalence and Trends of HIV and Syphilis Among Blood Donors in the Northern Region of Ghana; A Five-year Retrospective Study. World Journal of Public Health.
Vol. 4, No. 3, 2019, pp. 65-73. doi: 10.11648/j.wjph.20190403.13
Received: March 14, 2019; Accepted: April 28, 2019; Published: September 19, 2019
Abstract:
Blood transfusion is considered a life-saver in health care settings, but could potentially pose as a risk factor for transmission of life-threatening viral infections, including HIV, HBsAg, HCV and Syphilis infections. This study was carried out to find out the prevalence and trends of HIV and Syphilis infections among blood donors in the Northern Region of Ghana. Blood screening data of blood donors recorded in blood transfusion centers in the Northern region between 2011 and 2015 were collected and analyzed anonymously. Screening results for HIV and Syphils infections were sorted and analyzed from a total of 198,229 blood donors in the region within the period under consideration. Majority of the donors were female and aged between 20–39 years. The overall seroprevalence rates of HIV and Syphilis were 30.77% (7319) and 27.78% (4893) respectively. The highest seroprevalence was found for HIV followed by Syphilis. These infections were more prevalent in female donors. Highest seroprevalence for both HIV and Syphilis was observed among donors in their youthful ages, i.e. between 20 to 49 years, while Syphilis seroprevalence increased with age. There exists a decreasing trend of transfusion-transmissible viral infections (i.e. HIV and Syphilis) in blood donations. This indicates that the Ghana National Blood Service mandate of ensuring the safety of blood supply has been successful. Even though available statistics show that the prevalence rates of viral infections detected during blood donations has reduced drastically, there is still more to be done, especially using robust and efficient techniques like polymerase chain reaction (PCR). This, the researchers think could guarantee more safety blood for transfusion.Keywords:
Viral Infections, Transfusion, Syphilis, HIV, Seropositive, Blood Donors1. Introduction
The discovery of transfusion-transmissible infections (TTIs) has heralded a new era in blood transfusion practice worldwide with an emphasis on two fundamental objectives, safety, and protection of human life [1]. Ghana is one of the developing countries where blood safety remains an issue of major concern in transfusion medicine; especially that
of post-transfusion hepatitis [10]. Hepatitis B virus is highly contagious and relatively easy to be transmitted from one infected individual to another by blood transfusion, during birth, by unprotected sex, and by sharing needles and has a relatively higher prevalence in the tropics.[11, 15].
A study conducted in Addis Ababa, Ethiopia showed that HCV antibody prevalence was 0.9% and higher among HIV positive compared to HIV-negative individuals (4.5% vs. 0.8%, respectively). Similarly, higher prevalence of HCV antibodies was seen among HIV-positive compared to HIV negative antenatal care attendees (2.9% vs. 0.8%, respectively), and sex workers (5.3% vs. 1.3%, respectively) [9]. Syphilis is also a systemic disease caused by Treponema pallidum which can be spread by sexual contact, blood transfusion and via vertical transmission [3]. In sub-Saharan Africa, syphilis remains a serious public health problem. Prevalence of active syphilis infection among African countries showed 12.8% in Tanzania[5], and 3.8% in Kenya [14]. A study conducted to assess the prevalence of infection with HIV, syphilis, and HBV among Ethiopian blood donors in 1995 showed that the seroprevalence of HIV-1, syphilis, and HBV was 16.7%, 12.8% and 14.4%, respectively[7]. Evaluation of trends in the prevalence of viral infections among blood donors is not only essential for estimating the effectiveness of blood safety strategies [4, 6, 8], but it also gives clue to health policymakers to improve the current blood bank strategies to minimize the potential risk of acquiring these infections through blood transfusion [7, 10, 13].
The continuous prevalence of HIV, HBV, HCV, and syphilis has heightened the problems of blood safety in Ghana. Thus, continuous monitoring of the magnitude of transfusion-transmissible infections in blood donors is important for estimating the risk of transfusion and optimizing donor recruitment strategies to minimize infectious diseases transmission. Therefore, this study was conducted to determine the prevalence and trends of transfusion-transmissible viral infections, specifically HIV and syphilis infections among blood donors in the Northern region of Ghana during a Five Year period from 2011 to 2015. This is the first report on the trends of Syphilis and HIV infections among the donor population in the Northern region of Ghana.
The study sought to specifically estimate the prevalence of HIV and Syphilis amongst the age categories of blood donors in the Northern region of Ghana; also to determine the significance prevalence difference between males and females in the Region and also to estimate the trend of HIV and Syphilis from 2011 to 2015.
2. Methods
This study which is a retrospective descriptive one involved blood donor data recorded at blood transfusion centers of the Northern Region of Ghana over a period of five years, from 2011 - 2015. All blood transfusion centers located in the Northern region of Ghana were covered,
including the Tamale Teaching Hospital blood transfusion center which serves as the largest center contributes to collecting most of the blood units.
The Tamale metropolis, which is the capital of the Northern region of Ghana, is a commercial port and an important economic center of the region. The records of all blood donors who donated blood at any of these blood centers from 2011 to 2015 were taken and anonymously analyzed with respect to the results of serological screening for Syphilis and HIV infections.
This study was approved by the ethics review team of the Navrongo Health Research Center Institutional Review Board with reference number (NHRCIRB) GHS-ER.Rec.1394.108.
As a routine pre-donation practice, it is assumed that all blood donors went through a physical examination and health history interview prior to donation in an attempt to ensure their eligibility for donating blood. This is a protocol observed by all health agencies and blood donation sites across the country.
Those donors who had body weight above 45 kg, hemoglobin level of 12.5 g/dL or greater, physical and mental fitness, no history of high-risk behavior, blood transfusion, jaundice, hepatitis, surgery, and hypertension, as well as the other serious illness and current fever are considered eligible donors per the protocols. Those who were outside the range of eligibility criteria would have been excluded.
2.1. Screening Methods
The study assumes that after donating blood, all donated blood was screened for the presence of HIV antigen/antibody (HIV Ag/Ab) and Syphilis virus using commercially available ELISA kits per the protocol. All initially positive samples would have been retested and the repeatedly reactive samples would have been labeled seropositive.
These seropositive results are also assumed to have been confirmed using HIV I/II Western Blot (WB) and Syphilis test as per the protocol. Regarding HIV, the HIV WB-negative samples would have further been evaluated for the presence of HIV P24 antigen, and the reactive samples confirmed using monoclonal neutralization assay. According to the GHS policies, the initial positive blood units would have been excluded, and the confirmed positive donors were recalled for counseling and appropriate treatment.
2.2. Statistical Analysis
Also, a student t-test was used to look at the difference in prevalence i.e. whether there is a significant difference between the prevalence in the years (i.e. 2011-2012, 2012-2013 etc.) Statistically, P values of less than 0.05 were accepted as significant.
2.3. Limitations
This study was a retrospective one and therefore consent could not be sought from the subjects whose data were used for the analysis, even though ethical clearance was sought.
Also, no history of the subjects is known with regards to blood donation and other factors. But it is assumed that those conditions would have been addressed as part of the protocol
for the blood donation exercise.
3. Results
3.1. Data Analysis And Interpretation
A total of 110038 prospective blood donors were screened for HIV from January 2011 to December 2015. Out of this, 66309 (60.3%) were males and 43729 (39.7%) were females. Likewise, syphilis screening was also carried out on 88191of which 41861 (47.5%) were males and 46330 (52.5%) were females. The donors were categorized into five age groups in table 1 below.
Table 1. Distribution of blood donors stratified by years for HIV and Syphilis from 2011 to 2015.
Date HIV Donors Syphilis Donors
Year Population Total Pos. Prevalence Population Total Pos. Prevalence
2011 23814 1720 7.22 14622 855 5.85
2012 24693 2203 8.92 17211 1061 6.16
2013 25827 1995 7.72 22617 1389 6.14
2014 24291 1154 4.75 22256 996 4.48
2015 11413 247 2.16 11485 592 5.15
Totals/ Average 110038 7319 6.7 88191 4893 5.5
Source: Fieldwork, 2019.
From the table above, a total average prevalence of HIV amongst donors was 6.7 over the five-year period whiles syphilis recorded a prevalence of 5.5. The highest prevalence of HIV and syphilis over the years was recorded in 2012 with
8.9% and 6.16% respectively. However, in 2015 the least prevalence of 2.2% was recorded HIV whiles syphilis had the least prevalence in the year 2014 with 4.48.
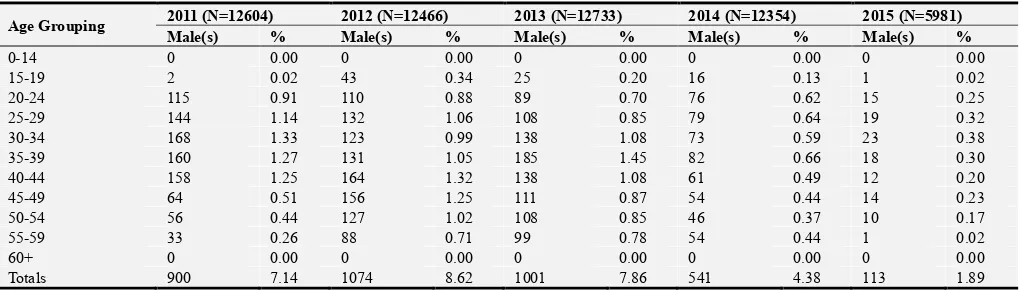
Table 2. HIV Prevalence for Males amongst age categories – Blood Donors for 5 years period.
Age Grouping 2011 (N=12604) 2012 (N=12466) 2013 (N=12733) 2014 (N=12354) 2015 (N=5981)
Male(s) % Male(s) % Male(s) % Male(s) % Male(s) %
0-14 0 0.00 0 0.00 0 0.00 0 0.00 0 0.00
15-19 2 0.02 43 0.34 25 0.20 16 0.13 1 0.02
20-24 115 0.91 110 0.88 89 0.70 76 0.62 15 0.25
25-29 144 1.14 132 1.06 108 0.85 79 0.64 19 0.32
30-34 168 1.33 123 0.99 138 1.08 73 0.59 23 0.38
35-39 160 1.27 131 1.05 185 1.45 82 0.66 18 0.30
40-44 158 1.25 164 1.32 138 1.08 61 0.49 12 0.20
45-49 64 0.51 156 1.25 111 0.87 54 0.44 14 0.23
50-54 56 0.44 127 1.02 108 0.85 46 0.37 10 0.17
55-59 33 0.26 88 0.71 99 0.78 54 0.44 1 0.02
60+ 0 0.00 0 0.00 0 0.00 0 0.00 0 0.00
Totals 900 7.14 1074 8.62 1001 7.86 541 4.38 113 1.89
Source: Fieldwork, 2019.
Table 2 reveals the trend of HIV amongst age categories of males. The most significant prevalence estimated was seen in the age category 35-39 with 1.45 in the year 2013 (average prevalence = 7.86) even though the year with the highest
average prevalence was seen to be 8.62. More so, the age category of 55-59 within the years (2015) had the lowest prevalence of 0.02.
Table 3. Syphilis Prevalence for Males amongst age categories – Blood Donors for 5 years period.
Age Grouping 2011 (N=6564) 2012 (N=8617) 2013 (N=10801) 2014 (N=10775) 2015 (N=5104)
Male(s) % Male(s) % Male(s) % Male(s) % Male(s) %
0-14 0 0.00 0 0.00 0 0.00 0 0.00 0 0.00
15-19 38 0.58 11 0.13 65 0.60 41 0.38 15 0.29
20-24 49 0.75 79 0.92 64 0.59 86 0.80 39 0.76
25-29 53 0.81 94 1.09 77 0.71 79 0.73 37 0.72
Age Grouping 2011 (N=6564) 2012 (N=8617) 2013 (N=10801) 2014 (N=10775) 2015 (N=5104)
Male(s) % Male(s) % Male(s) % Male(s) % Male(s) %
35-39 48 0.73 89 1.03 81 0.75 60 0.56 10 0.20
40-44 41 0.62 76 0.88 85 0.79 55 0.51 11 0.22
45-49 43 0.66 28 0.32 95 0.88 56 0.52 12 0.24
50-54 38 0.58 25 0.29 65 0.60 31 0.29 11 0.22
55-59 33 0.50 15 0.17 31 0.29 21 0.19 10 0.20
60+ 0 0.00 0 0.00 0 0.00 0 0.00 0 0.00
Totals 399 6.08 537 6.23 649 6.01 497 4.61 174 3.41
Source: Fieldwork, 2019.
The table above shows the summary of prevalence from the age categories within the years. The various categories show a decline in prevalence over the years from 2011 to
2015. The age group with the highest prevalence is 30-34 with an average prevalence of 0.85 whiles age 55-59 recorded the least average prevalence of 0.27 over the years.
Table 4. HIV Prevalence for Females amongst age categories – Blood Donors for 5 years period.
Age Grouping 2011 (N=11210) 2012 (N=12227) 2013 (N=13094) 2014 (N=11937) 2015 (N=5432) Female(s) % Female(s) % Female(s) % Female(s) % Female(s) %
0-14 0 0.00 0 0.00 0 0.00 0 0.00 0 0.00
15-19 1 0.01 42 0.34 23 0.18 21 0.18 1 0.02
20-24 112 1.00 126 1.03 93 0.71 84 0.70 19 0.35
25-29 131 1.17 135 1.10 114 0.87 87 0.73 25 0.46
30-34 157 1.40 140 1.15 124 0.95 82 0.69 31 0.57
35-39 143 1.28 130 1.06 187 1.43 85 0.71 16 0.29
40-44 139 1.24 178 1.46 128 0.98 73 0.61 15 0.28
45-49 60 0.54 155 1.27 113 0.86 66 0.55 13 0.24
50-54 49 0.44 129 1.06 112 0.86 55 0.46 12 0.22
55-59 28 0.25 94 0.77 100 0.76 60 0.50 2 0.04
60+ 0 0.00 0 0.00 0 0.00 0 0.00 0 0.00
Totals 820 7.31 1129 9.23 994 7.59 613 5.14 134 2.47
Source: Fieldwork, 2019.
Show the trend of distribution of prevalence in females according to age categories as shown in the table above. The most significant HIV prevalence amongst the years is 9.2%
representing 2012. The minimal prevalence amongst females was 2.5 representing the year 2015.
Table 5. Syphilis Prevalence for Females amongst age categories – Blood Donors for 5 years period.
Age Grouping
2011 (N=8054) 2012 (N=8594) 2013 (N=11816) 2014 (N=11481) 2015 (N=6381) Female(s) % Female(s) % Female(s) % Female(s) % Female(s) %
0-14 0 0.00 0 0.00 0 0.00 0 0.00 0 0.00
15-19 47 0.58 12 0.14 78 0.66 35 0.30 25 0.39
20-24 51 0.63 68 0.79 88 0.74 83 0.72 86 1.35
25-29 67 0.83 91 1.06 89 0.75 75 0.65 58 0.91
30-34 54 0.67 118 1.37 91 0.77 57 0.50 49 0.77
35-39 55 0.68 86 1.00 95 0.80 59 0.51 55 0.86
40-44 52 0.65 87 1.01 98 0.83 61 0.53 50 0.78
45-49 53 0.66 25 0.29 101 0.85 65 0.57 41 0.64
50-54 38 0.47 27 0.31 69 0.58 35 0.30 31 0.49
55-59 39 0.48 10 0.12 31 0.26 29 0.25 23 0.36
60+ 0 0.00 0 0.00 0 0.00 0 0.00 0 0.00
Totals 456 5.66 524 6.10 740 6.26 499 4.35 418 6.55
Source: Fieldwork, 2019.
3.2. Trend Analysis
Source: Fieldwork, 2019.
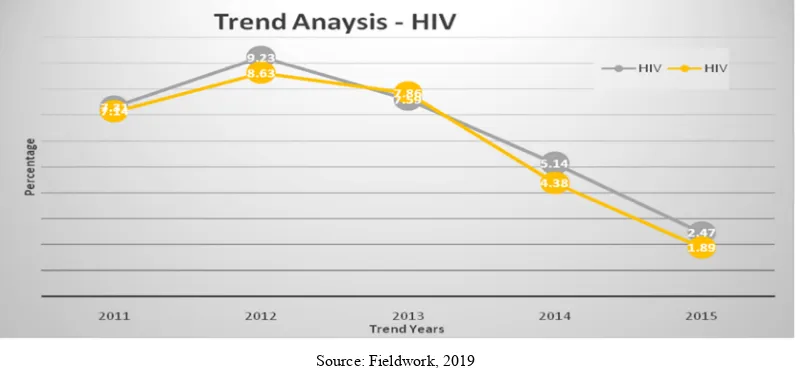
Figure 1. Trend of Cases of HIV amongst Donors of Blood within the Northern Region 2011-2015.
A steady increase was revealed from 2011 to 2012 in the prevalence of 7.2 to 8.2 respectively. There was relatively a decline in the prevalence running from 2012 (8.9) to 2015 (2.2).
Source: Fieldwork, 2019
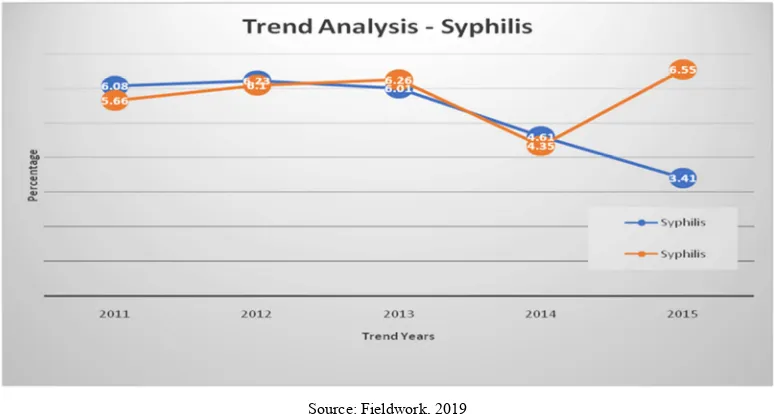
Figure 2. Trend of Cases of Syphilis amongst Donors of Blood within the Northern Region 2011-2015.
Figure 2 denotes a steady downward trend line from 2011 (5.8%) to 2015 (5.2). Even though a steady upwards trend is shown from 2011 (5.8%) to 2012 (6.2%) with a slight decline from 2012 (6.2%) to 2013 (6.1) and a further sharp decline to 2014 (4.5%).
Source: Fieldwork, 2019
Figure 4 shows the trend of prevalence from 2011 to 2015 for syphilis. The trend shows a steady decline in yearly prevalence from 2011 to 2015 with 6.08 to 3.41 for males whiles females recorded a steady prevalence increase from
2011 to 2013 with 5.66 and 6.26 respectively. However, it was revealed that there were a sharp decline and an increase in the prevalence from 2013 to 2015 for females.
Source: Fieldwork, 2019
Figure 4. Trend analysis of Male and Female prevalence from 2011 to 2015 for Syphilis.
The figure above shows the prevalence trend of HIV amongst blood donors from 2011 to 2015. Both Males and females had a sharp increase from 2011 to 2012 with a significant difference of 1.9% and 1.5% respectively. Also, the graph revealed a sharp decline in the prevalence from 2012 to 2015 for both males and females with a statistically significant difference of 6.8% and 6.7% respectively.
3.3. Hypothesis Testing
The researchers used secondary data from the blood bank stations of the Northern region. In this view, the researchers sought to find out the difference between the prevalence of males and females.
H0: There is no significant difference between the prevalence of males and females from 2011 to 2015 amongst HIV donors in the northern region.
Table 6. Summarized statistics for male and female blood donor’s HIV prevalence.
Group Statistics
Sex N Mean Std. Deviation Std. Error Mean
HIV Males 5 5.9800 2.79243 1.24881
Females 5 6.3480 2.61113 1.16773
SPSS Output Version 22, 2019.
The summary statistics for the independent samples t-test shows a mean difference between males and females to be 0.37 with standard deviations of 2.79 and 2.61 respectively.
Both males and females recorded a slightly high standard error for means to be 1.25 and 1.17 respectively.
Table 7. Independent samples test for assumed and equal variances.
Independent Samples Test
Levene's Test for Equality
of Variances t-test for Equality of Means
F Sig. t df Sig.
(2-tailed)
Mean Difference
Std. Error Difference
95% Confidence Interval of the Difference Lower Upper
HI V
Equal variances
assumed .098 .762 -.215 8 .835 -.36800 1.70972 -4.31062 3.57462
Equal variances not
assumed -.215 7.964 .835 -.36800 1.70972 -4.31370 3.57770
SPSS Output Version 22, 2019.
equality of variance, we have an F-statistic which produces a p-value of 0.78. This tells us that we fail to reject H0, which means that the population variance for males and females in the entire population are not different.
The test statistics for equality of means from the group with equal variances depicts a not significant value of 0.835 compared to the significance level of 0.05 with a confidence
interval of -4.31 to 3.58.
From the test of significance, we say that there is no statistically significant difference between the prevalence of males and females over the five-year period.
H0: There is no significant difference between the prevalence of males and females from 2011 to 2015 amongst Syphilis donors in the northern region.
Table 8. Summarized statistics for male and female blood donor’s syphilis prevalence.
Group Statistics
Sex N Mean Std. Deviation Std. Error Mean
Syphilis Males 5 5.2680 1.22683 .54866
Females 5 5.7840 .86385 .38632
SPSS Output Version 22, 2019.
Table 8 reveals that mean statistics was 5.3 for males and 5.8 for females respectively which depicts a difference in means across the years but an unknown difference in
statistical significance. The difference between the standard deviations was 0.39.
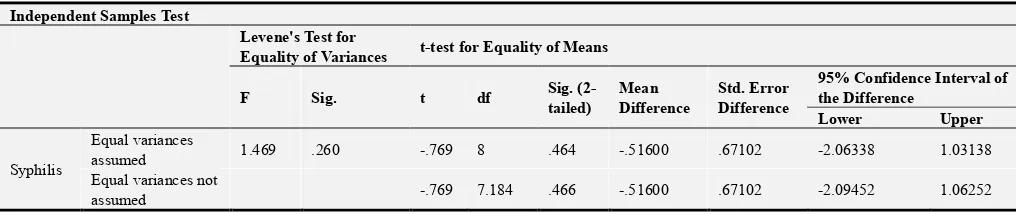
Table 9. Independent samples test for assumed and equal variances.
Independent Samples Test
Levene's Test for
Equality of Variances t-test for Equality of Means
F Sig. t df Sig.
(2-tailed)
Mean Difference
Std. Error Difference
95% Confidence Interval of the Difference
Lower Upper
Syphilis
Equal variances
assumed 1.469 .260 -.769 8 .464 -.51600 .67102 -2.06338 1.03138
Equal variances not
assumed -.769 7.184 .466 -.51600 .67102 -2.09452 1.06252
SPSS Output Version 22, 2019.
A confidence level of 95% with a 1.96 critical value was used in a one-tailed test to obtain the t-test value of 0.42.
The p-value of 0.23 is greater than a 95% confidence level with 1.96 critical value which is 0.05 (p>0.05).
The test statistics, therefore, falls in the region of rejection, hence to fail to reject H0. So, therefore, there is no difference between the prevalence amongst males and female blood donors in the region, any difference detected is as a result of chance.
4. Discussion
HIV and Syphilis infections occurrence among blood donors in the northern region was determined by serological methods of which the results were compared year on to assess the trends in five consecutive years, 2011, 2012, 2013, 2014, and 2015. The general trend of HIV cases across the years showed a steady increase from 2011 to 2012 and a sharp decline year on. Statistics from early studies have shown that there is a general decline in cases of HIV amongst blood donors this is confirmed by Miller et al., 2014.
This study trend estimated conforms to the trend of HIV cases in blood donors as stipulated by earlier studies [15, 16]. This marginal decline might be attributed to other factors like social and economic determinants as well as awareness creation of these viral infections in the country.
More so, the trend of syphilis was also examined and it
was realized that there was an undulating trend line estimated, which depicts a statistically insignificant decline in the prevalence rate across the five (5) years period. These actually contest the view of other studies that depicts a marginal decline in trend of syphilis cases across the years in blood donors. [5]
This trend suggests that much is not done in controlling the enabling factors and determinants of the incidence of syphilis across the years.
It was also realized from the analysis that there was a significant decline in prevalence notified yearly according to males and females within the age categories estimated. This was basically a trend seen in HIV prevalence within the age categories of males and females.
It was also revealed from the analysis that, syphilis prevalence as estimated for females appreciated significantly from 5.66 in 2011 to 6.55 in 2015 whiles for males there was a significant decline from 2011 to 2015 with 6.08 to 3.41 respectively.
This undulating prevalence seen over the five-year period in our analysis raises a lot of concerns with regards to the degree of blood donors reactive to various viruses of interest to public health. This in the opinion of the researchers poses a lot of treat to the work force, human development and socio-economic growth of the country.
males and females across the years of interest regarding HIV and Syphilis.
The results noted that, there is no significant difference between the prevalence of males and females for HIV and syphilis reactive cases amongst blood donors. This therefore tells us that, there is no significant difference in the infection rate of males and females in the region for blood donors.
Lastly, an average prevalence of 6.7 was seen over the five years period for HIV cases whiles a 5.5 prevalence was recorded for syphilis cases for blood donors within the regional setting. This tells us that the rate of spread of HIV is more predominant than the spread of syphilis. It is in this light that the Ghana health services have set up a body to manage the affairs of HIV and its related complications in the country. Even though much has been done in line with HIV, it still posses as a strong public health threat to the region and the country as a whole.
The rate of infections keeps fluctuating for HIV giving an indication to how volatile the virus is as well as having an averagely high prevalence over the years.
5. Conclusion and Recommenmdations
5.1. Conclusion
In conclusion, blood bank services represent the heart of blood transfusion in the country and as such plays an important role in the health service delivery to saving lives.
It is therefore important that all blood donated be screened for possible infections of certain infectious diseases of public health concern. The prevalence trend to HIV and syphilis of blood donors for the five years period informs the service to carefully monitor the screening process to further reduce the risk of transfusing infected blood to vulnerable patients.
Measures such as more sensitive techniques, education, and sensitization must be carried out to ensure that people are well enlightened and protected from these infections of public health interest.
5.2. Recommendations
At the end of this study, the researchers carefully state the following recommendation to policy makers and other stakeholders to whom it concerns most;
The trend of HIV and syphilis amongst blood donors is average higher than the clinical trends over the years of interest. This tells us of a worrying trend of reactive but not confirmed cases of HIV and confirmed cases of syphilis that are in one way or the other not treated. Measures should be taken to address these huge cases left to the mercies of their communities.
Also measures such as sensitive techniques as well as confirmation of this cases, education and sensitization of the populace should be enhance in other to enlighten and to protect the exposed population to these diseases
Lastly, funding services should be secured from the Ghana health service purposely for the blood donation services of
the country to tackle this menace of high prevalence amongst these donors as well as to protect the exposed population through education and sensitization.
References
[1] Ahmed Z, Umaru N, Shreesha K. Seroprevalence of Transfusion Transmitted Infections Among Blood Donors in Mangalore. Medica Innovatica. 2012; 1 (2): 24–7.
[2] ALGani FA. Prevalence of HBV, HCV, and HIV-1, 2 infections among blood donors in Prince Rashed Ben Al-Hassan Hospital in North Region of Jordan. Int J Biol Med Res. 2011; 2 (4): 912–6.
[3] Farshadpour F, Makvandi M, Samarbafzadeh AR, Jalalifar MA. Determination of hepatitis C virus genotypes among blood donors in Ahvaz, Iran. Indian J Med Microbiol. 2010; 28 (1): 54–6. pmid: 20061766.
[4] Kafi-abad SA, Rezvan H, Abolghasemi H, Talebian A. Prevalence and trends of human immunodeficiency virus, hepatitis B virus, and hepatitis C virus among blood donors in Iran, 2004 through 2007. Transfusion. 2009; 49 (10): 2214– 20. pmid: 19527477.
[5] Kafi-abad SA, Rezvan H, Abolghasemi H. Trends in the prevalence of hepatitis B virus infection among Iranian blood donors, 1998–2007. Transfus Med. 2009; 19 (4): 189–94. pmid: 19708860.
[6] Khedmat H, Alavian SM, Amini M, Abolghasemi H, Hajibeigi B, Alaeddini F, et al. Trends in seroprevalence of hepatitis B, hepatitis C, HIV, and syphilis infections in Iranian blood donors from 2003 to 2005. Hepat Mon. 2009; 9 (1): 24– 8.
[7] Li C, Xiao X, Yin H, He M, Li J, Dai Y, et al. Prevalence and prevalence trends of transfusion-transmissible infections among blood donors at four Chinese regional blood centers between 2000 and 2010. J Transl Med. 2012; 10: 176. pmid: 22929614.
[8] Mohammadali F, Pourfathollah AA. Changes in Frequency of HBV, HCV, HIV and Syphilis Infections among Blood Donors in Tehran Province 2005–2011. Arch Iran Med. 2014; 17 (9): 613–20. pmid: 25204477.
[9] Nwankwo E, Momodu I, Umar I, Musa B, Adeleke S. Seroprevalence of major blood-borne infections among blood donors in Kano, Nigeria. Turk J Med Sci. 2012; 42 (2): 337– 41.
[10] Nwokeukwu HI, Nwabuko CO, Chuku A, Ajuogu E, Dorathy OA. Prevalence of human immunodeficiency virus, hepatitis B virus, hepatitis C virus, and syphilis in blood donors in a tertiary health facility in southeastern Nigeria. Hematology and Leukemia. 2014; 2 (1): 4.
[11] Sethi B, Kumar S, Butola K, Mishra J, Kumar Y. Seroprevalence pattern among blood donors in a tertiary health care center. Internet Journal of Medical Update. 2014; 9 (1): 10–5.
[13] Song Y, Bian Y, Petzold M, Ung COL. Prevalence and trend of major transfusion-transmissible infections among blood donors in Western China, 2005 through 2010. PloS one. 2014; 9 (4): e94528. pmid: 24714490.
[14] Taherkhani R, Farshadpour F. Epidemiology of hepatitis C virus in Iran. World J Gastroenterol. 2015; 21 (38):10790– 810. pmid: 26478671; PubMed Central PMCID: PMC4600581.
[15] Elbjeirami WM, Arsheed NM, Al-Jedani HM, Elnagdy N, Hazem M, et al. (2015) Prevalence and Trends of HBV, HCV,
and HIV Serological and NAT Markers and Profiles in Saudi Blood Donors. J Blood Disord Transfus 6:280. doi: 10.4172/2155-9864.1000280.