Bond Strength of GFRP Bars Embedded in Engineered Cementitious
Composite using RILEM Beam Testing
Khandaker Muhammed Anwar Hossain*
(Received May 9, 2017, Accepted January 7, 2018)
Abstract: This paper presents a study on the bond characteristics of glass fiber reinforced polymer (GFRP) bars in engineered cementitious composite (ECC). Ninety beam specimens having variable parameters namely bar diameter, GFRP bar types (s-tandard low modulus ‘LM’ and high modulus ‘HM’), two concrete types (ECC and normal concrete ‘NC’) and embedded length (5, 7 and 10 times bar diameter) were tested as per RILEM specifications. Bond stress–slip characteristics and failure modes of specimens as well as influence of variable parameters on bond strength are described. The performance of various Codes and other existing equations in predicting bond strength of both low/high modulus GFRP bars embedded in ECC compared to NC is described based on experimental results. The bond strength decreased with the increase of embedment length—maximum bond strength reduction of 36% was observed. For both ECC and NC, bond strength reduced with the increase of bar size and ECC produced maximum 1.6 times higher bond strength compared to NC. Code based and other existing equations were found conservative in predicting bond strength of GFRP bars embedded in ECC.
Keywords:glass fiber reinforced polymer bar, engineered cementitious composite, RILEM beam test, bond strength, codes.
1. Introduction
During the last decades, tremendous progress has been made on the high performance concrete (HPC). Such HPC technology involves the family of highly durable fibre reinforced engineered composites (ECCs). ECCs have high ductility, tight crack width and can be tailored for low to high strength. Micro-mechanical design allows optimization of ECC for high performance. ECC strain hardens after first cracking, like a ductile metal, and demonstrates a strain capacity 300 to 500 times greater than conventional concrete (Li and Kanda1998; Li2003; Sahmaran et al.2009; Ozbay et al.2012). Even at large deformation, crack widths of ECC remain less than 60lm. With intrinsically tight crack width associated with self-healing potential and high tensile duc-tility, ECC is the material of future which offers significant potential to resolve durability problems of reinforced con-crete (RC) structures. Given the worldwide demand for infrastructure systems, the potential application of ECC either in new construction or as repair/retrofitting material is enormous. Research over the years has contributed to the development of green cost-effective ECC mixtures incor-porating locally available sand (instead of relatively expen-sive and difficult to obtain micro-silica sand), natural
pozzolans, industrial wastes and self-healing agents (Sah-maran et al. 2009; Ozbay et al. 2012; Sherir et al. 2015; Hossain and Anwar2014; Sherir et al.2017) as well as their potential applications in bridge and building structures confirming superior structural and durability performance (Hossain et al. 2015a, b; Rafiei et al. 2013; Issani and Hossain2013).
Corrosion is a serious problem in RC structures which damage the steel bar-concrete interface thus degrading bond strength and ultimately shortening the service life. Periodic maintenance, repairs and rehabilitations of corroded RC structures lead to substantial economic burden to authorities in the United States, Canada and other countries in the world. There has been an increasing demand for the alternate materials and techniques for reinforcement in RC structures (Hossain et al.2014; Lee et al.2008). Glass fibre reinforced polymer (GFRP) bars are recognized as a superior alterna-tive to ordinary steel bars for their high strength, lightweight, noncorrosive and nonconductive characteristics. The use of GFRP bars can prevent deterioration due to corrosion, improve durability and increase the service life of structures. Researches have been conducted to evaluate the durability performance in aggressive environment and to develop models for predicting long-term strength retention of GFRP bars embedded in concrete (Benmokrane et al.2002; Chen et al.2006; Robert et al.2009; Mufti et al.2007). GFRP bars were proved to be a durable face to the concrete environment and it was shown that the service lifetime allowed to reach tensile strength retention of less than 50% should be infinite (Robert et al.2009; CSA S6-062006) which also supported the findings of Mufti et al. (2007) who tested few GFRP Department of Civil Engineering, Ryerson University,
350 Victoria Street, Toronto, ON, Canada.
*Corresponding Author; E-mail: [email protected] CopyrightThe Author(s) 2018. This article is an open access publication
International Journal of Concrete Structures and Materials DOI 10.1186/s40069-018-0240-0
reinforced structures after up to 9 years in service conditions.
However, it is also reported that the GFRP bars do dete-riorate over time when embedded in concrete or when immersed in concrete pore solutions due to chemical reac-tions (Kim et al. 2012). Gardoni et al. (2013) developed a time-variant probabilistic model to predict the tensile capacity of GFRP bars embedded in concrete. The model was based on a general diffusion model, in which water or ions penetrate the GFRP bar matrix and degraded the glass fiber-resin interface. The model indicated that GFRP bars with larger diameters exhibited lower rates of capacity loss. Park et al. (2014) investigated the long-term flexural behavior and ductility of GFRP and steel bar reinforced concrete (RC) members subjected to sustained loads and accelerated aging conditions (for example, 47C and 80% relative humidity). Results indicated that the accelerated aging conditions reduced flexural capacity in not only RC-steel, but also RC-GFRP specimens. Different types of GFRP reinforcement exhibited different rates of degradation of the flexural capacity when embedded in concrete under the same exposure conditions.
Extensive research studies have been conducted on the use of GFRP bars in structural elements and on bond charac-teristics of GFRP bars with conventional concrete (Hossain et al. 2014; Lee et al. 2008; Choi et al. 2012; Masmoudi et al. 2011; Yan et al. 2016; Gu et al. 2016; Chaallal and Benmokrane 1993; Robert and Benmokrane 2010; Tigh-iouart et al.1998; Hao et al.2009). The bond behaviour of GFRP bars is different from that of deformed steel bars. Bond strength of GFRP bars in conventional concrete depends on bar diameter, surface condition (sand coated, ribbed, helically wrapped or braided), embedment length, bar mechanical properties and environmental conditions. Current Canadian Code CSA S806-12 (2012) and Canadian Highway Bridge Design Code (CHBDC) CSA S6-06 (2006) provide design equations for the development length of GFRP bars in conventional concrete taking into account of bar location, bar surface, clear cover, and distance between bars. Okelo and Yuan (2005) suggested an equation relating bond capacity and concrete compressive strength based on 151 test specimens comprising concretes with compressive strength varying from 29 to 60 MPa and GFRP bars of 6–19 mm diameter. Lee et al. (2008) also suggested an equation for bond strength of sand-coated and helically wrapped GFRP bars embedded in concrete whose com-pressive strength ranged between 25 and 92 MPa.
The GFRP reinforced ECC is a new technology and can improve strength, ductility, durability, resistance to deterio-ration against aggressive environment, self-healing capabil-ity and overall service life of structures compared to their conventional concrete counterparts (Sherir et al.2015,2017; Hossain et al. 2015a, b). Full understanding of the bond characteristics of GFRP bars in ECC is important for this technology to be adopted in structural applications. Cur-rently, the existing standards, including the Canadian Codes CSA S806-12 (2012) and CSA S6-06 (2006), do not provide any specific design models for ECC. However, the
performance of Code based equations developed for con-ventional concrete as well as those developed by other researchers should be studied in order to validate their applicability to GFRP reinforced ECC.
Limited research has been conducted on the bond perfor-mance of embedded GFRP bars in ECC (Hossain et al.
2015a,b). All such research studies used traditional pullout tests to determine GFRP bond characteristics. No research has been conducted to study the bond strength of GFRP bars in transversely reinforced confined ECC using beam tests as per RILEM (1994) which simulates the reinforcement behavior in real structural elements used in building systems. It should be noted that the beam test normally achieves higher bond strength compared to traditional pullout test due to auxiliary transverse reinforcement providing confinement to the GFRP bars over the bonded length (ACI Committee 408 2003). The confining effects of fibers and transverse reinforcement are included in the bond strength equations provided the Canadian Codes, which is ignored in ACI 440.1R-15 (2015).
This paper presents the results of a research conducted on the bond characteristics of both low modulus (LM) and high modulus (HM) GFRP bars embedded in ECC using trans-versely reinforced beam specimens of two configurations having variable parameters such as: bar diameter, bar types, embedded length and concrete types (based on strength class). The influences of each of these parameters on bond strength are described. Bond strengths derived from existing Code based design equations are compared with those obtained from experiments. This research contributes to GFRP-ECC bond technology where knowledge is limited and provides data for the Code writers and professionals. The findings and conclusions of this research will surely benefit engineers, builders and local authorities involved in designing and con-structing structures with GFRP bar reinforced ECC.
2. Experimental Investigation
2.1 Materials and Properties
Two concrete mixtures had been used—a Ryerson pro-duced green Engineered Cementitious Composite (ECC) and a commercial normal concrete (NC). ECC was made of polyvinyl alcohol (PVA) fibers (8 mm length, 39lm diameter, 1600 MPa tensile strength and 1300 kg/m3 den-sity), local mortar sand (instead of silica sand), Portland cement, fly ash (as 55% replacement of cement), admixtures and water to binder ratio of 0.27. ECC mixture contained 2.6% PVA fibre content by volume. Commercial NC was made of Portland cement, silica fume, air-entraining admixture, 10 mm maximum size stone and other carefully selected components.
The compressive and flexural strength of the concrete was determined from the average of ten 1009200 mm cylinder and 300950975 mm beam control specimens that were cast and cured under the same laboratory conditions as the beam specimens and tested at the time of pullout specimen testing. The strength properties of ECC and commercial NC (determined from control specimens at the age of testing (at 28 days) as per ASTM C39/C39 M (2011) and ASTM C78/ C78 M (2010) are presented in Table1. The cylinder com-pressive strengths of ECC and NC (mean values of 10 control specimens) were 57 and 63 MPa, respectively whereas beam flexural strengths of ECC and NC were 6.7 and 4.7 MPa, respectively.
The nominal bar diameter, tensile strength, tensile strain and modulus of elasticity of the GFRP bars are shown in Table2. The actual bar diameter (db) was more than the nominal bar diameter due to sand coating. The sand coating was included in calculating db since it affects the concrete surface area in contact with the bar. For each bars, the actual
bar diameter was chosen from the average of 10 diameter readings measured with a micrometer accurate to 0.01 mm.
2.2 Beam Specimen Geometry, Configuration and Casting
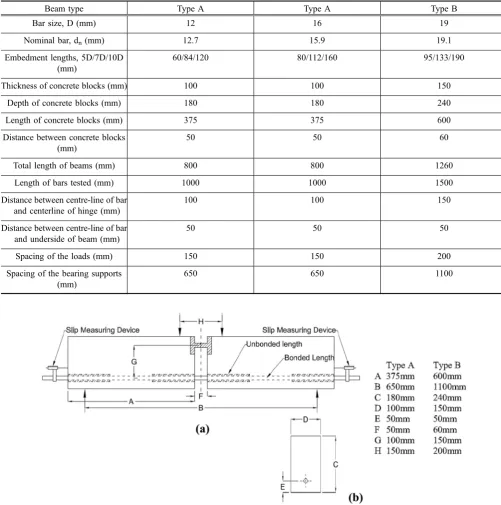
The beam geometry was based on the beam test recom-mendation established by RILEM (1994). The beam test was comprised of two parallelepiped reinforced concrete blocks, interconnected at the bottom by the rebar whose bond was to be investigated and at the top by a specially fabricated steel hinge. The dimensions of the bond test beams were depen-dant on the diameter of the rebar being investigated. In the recommendation, two beam types are given which are dependent on the diameter of the rebar: Type A and Type B. For the smaller 12.7, 15.9 mm diameter GFRP rebars, Type A beams were used, whereas Type B beam specimens were used for the larger 19.1 mm diameter GFRP bars. Table3
and Fig.1show the dimensions of the specimens for Type A and Type B. The unbonded length was created by placing foam pipe insulation around the GFRP rebar to prevent the concrete from bonding to the bar. As shown in Fig.1, the bonded portion of the GFRP rebar was located at the center of each beam block.
The auxiliary confining reinforcement for the beam spec-imens consisted of plain, mild steel bars. Details of the reinforcement are given in Figs.2 and 3 for Type A and Type B beam specimens, respectively. The longitudinal steel reinforcement was 8 mm in diameter and the transverse reinforcement was 6 mm in diameter. The stirrups at the end of the reinforcement cages were spot welded at the top and bottom to the longitudinal reinforcement such that the cage would not become distorted during casting. Cable ties were used to secure the transverse reinforcement to the
Table 1 RILEM beam bond test variable parameters, specimen details and concrete properties.
Concrete type Nominal bar diameter
(D) (mm)
Type of GFRP bar Embedment length Cover from the centre
of the bar (mm)
No. of specimens
NC, ECC 12.7*, 15.9,19.1 LM, HM 5D, 7D, 10D 50 90=54 (ECC) and 36
(NC)
Typical beam specimen designation: ECC-15.9-5D-LM or NC-15.9-5D-HM.
LMlow modulus,HMhigh modulus,ECCengineered cementitious composite,NCnormal concrete,Dbar diameter.
* 12.7 mm GFRP bars were not used for NC.
Table 2 Properties of GFRP bars.
Bar type Bar size (D) Nominal bar
diameter (dn)
(mm)
Actual bar
diameter (db)
(mm)
Modulus of elasticity (GPa)
Tensile strength (MPa)
Ultimate tensile
load (kN)a
Tensile strain (%)
LM 12 12.7 14.4 42.5±2.5 1000 127 2.35
LM 16 15.9 17.3 42.5±2.5 940 187 2.21
LM 19 19.1 20.5 42.5±2.5 940 269 2.21
HM 12 12.7 15.5 65.6±2.5 1312 166 2.00
HM 16 15.9 18.8 62.6±2.5 1184 235 1.89
HM 19 19.1 21.7 63.7±2.5 1105 317 1.73
a
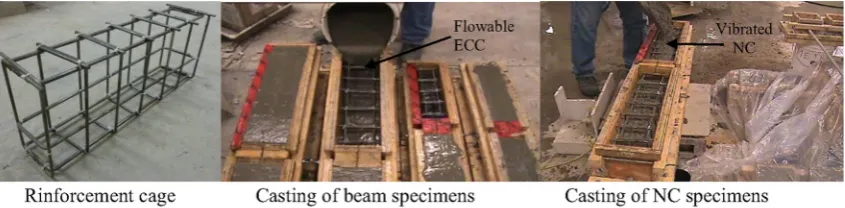
longitudinal reinforcement. Figure4shows a reinforcement cage for a Type B specimen.
2.3 Casting of Beam and Control Specimens The beam specimens were cast using 400 L capacity concrete mixer in the Structures laboratory of Ryerson University. For ECC, initially the sand, cement, and fly ash were added in the mixture machine and mixed for 2 min. Water and HRWRA were then added into the dry mixer and mixed for 2 min. Slight adjustments in the amount of the HRWRA in each mixture were made to achieve consistent and uniform matrix for better fiber distribution and
workability. Finally, PVA fiber was added and mixed for 3 min. ECC had excellent fresh and workability properties with slump flow, V-funnel time and L-box index of 900 mm, 2.1 s and 0.98, respectively. Immediately after mixing, flowable ECC was poured into the moulds of beam and control specimens without consolidation (Fig.4).
The commercial pre-packaged ready mix NC was mixed as per the guidelines provided by the Manufacturer. The slump for the mix was conducted according to ASTM C143/ C143 M (2015) was 120–180 mm. Air content values per-formed according to ASTM C231/C231 M (2011) ranged from 3 to 5%. Immediately after mixing, the NC was placed into the beam and control specimen moulds and consolidated
Table 3 Dimensions of beam specimens.
Beam type Type A Type A Type B
Bar size, D (mm) 12 16 19
Nominal bar, dn(mm) 12.7 15.9 19.1
Embedment lengths, 5D/7D/10D (mm)
60/84/120 80/112/160 95/133/190
Thickness of concrete blocks (mm) 100 100 150
Depth of concrete blocks (mm) 180 180 240
Length of concrete blocks (mm) 375 375 600
Distance between concrete blocks (mm)
50 50 60
Total length of beams (mm) 800 800 1260
Length of bars tested (mm) 1000 1000 1500
Distance between centre-line of bar and centerline of hinge (mm)
100 100 150
Distance between centre-line of bar and underside of beam (mm)
50 50 50
Spacing of the loads (mm) 150 150 200
Spacing of the bearing supports (mm)
650 650 1100
using a vibrating table according to ASTM C192/C192 M (2011). Figure4 shows casting of specimens with NC.
Control specimens in the form cylinders and beams were cast from each batch to determine compressive and flexural strengths. Beam and control specimens were covered with wet burlap for the first 24 h in order to maintain high humidity on the exposed surface of the specimens. 24 h after casting, the specimens were demoulded and left in the
laboratory (at 21±2C and 70±5% RH) without pro-viding any special curing until tested. Figure5shows casted beam and control specimens.
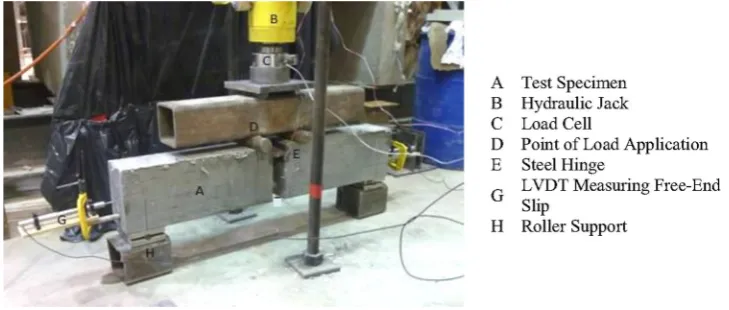
2.4 Beam Test-Setup, Testing and Failure Modes
The beam test set-up (shown in Fig.6) and testing were designed according to the recommendation by RILEM
Fig. 2 Auxiliary reinforcement for Type A specimen (dimensions in mm).
Fig. 3 Auxiliary reinforcement for Type B specimen (dimensions in mm).
(1994). The loading was applied under load control corre-sponding to stresses in the bar in increments of 80, 160, 240, 320, 400 MPa, etc. The load was increased from one increment to the next increment evenly over the span of 30 s. Once the next increment was reached, the load was kept constant for 2 min. After 2 min, the load was increased to the next increment over a span of 30 s. This process was repeated until bond failure of the specimen.
A data acquisition system was used to record data from the load cell. Two linear variable displacement transducers (LVDTs) located at each end of the beam specimen provided free end slip measurements and strain gauge installed at the centre of the GFRP bar (between the two concrete blocks) provided the strain development during the entire loading history. All beam tests exhibited sudden pullout mode of failure.
3. Results and Discussion
3.1 Failure Modes
All ECC specimens (with both LM and HM bars) showed pullout mode of failure. All NC specimens also showed pullout mode of failure with some signs splitting cracks around the bar only in LM and NC-19.1-10D-HM specimens at the beam end. From the visual inspection of the interface between the GFRP bar and the concrete, it could be seen that the sand coating had been partially sheared off of the GFRP rebar.
3.2 Bond Strength, Bond-Slip Relationship and GFRP Bar Strain from Beam Tests
Based on the geometry of the beam specimens, as well as the locations of the applied loads (F/2), supports/support reactions and hinge as shown in Fig.1, the tensile load (PA
or PB for Type A and B specimens, respectively) in the
GFRP rebar was derived as F(B-H)/4G by making sum-mation of moment about hinge equal to zero. Using the values of B, H and G for Type A and B specimens (as shown in Fig.1), the bar tensile loads (PAand PB) were derived as:
PA=1.25F; for Type A specimens; PB=1.50F; for Type
B specimens where F is the total applied load determined by the load cell.
Following the assumption of constant distribution of bond stress, the average bond stress and bond strength (s) over the embedment length (le) were determined by Eq. (1):
Bond stress¼ P
pledb ;
Bond strength;
s¼Ppeak
pledb
¼ Abfs
pledb
¼dbfs
4le
ð1Þ
where P is the bar load, Ppeakis the peak bar load (maximum value of PAor PB), dbis the actual GFRP bar diameter, Abis
the cross-sectional area of the bar and fsis the peak stress in
the bar.
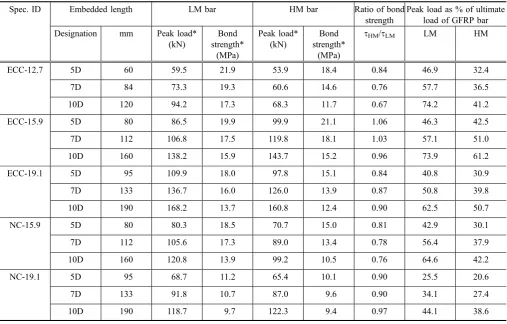
Table4 shows the test results including LM/HM GFRP bar parameters, concrete strength (fc0), bar peak load, bar
Fig. 5 Beam specimens with control cylinders.
peak load as % of ultimate GFRP bar load and calculated mean bond strength from RILEM beam tests.
3.3 Peak load development and bond stress-slip response
Peak load increased with the increase of embedment length (5D to 10D) and bar diameter (D) as indicated in Table4. The peak load ranged between 25.5% (observed on NC) and 74.2% (observed in ECC) of ultimate load for specimens with LM GFRP bars compared to the range between 20.6% (observed in NC) and 61.2% (observed in ECC) for specimens with HM GFRP bars. The highest peak load of 74.2% was recorded in a 12.7 mm bar (ECC-12.7-10D-LM beam specimen). This indicates that the maximum stress developed were well below the ultimate strength of both LM and HM bars. Thus, it can be concluded that all beam specimens failed due to bond failure and not due to rebar rupture.
Typical bond-slip curves from the beam tests are shown in Fig.7. Bond stress-slip curves exhibited similar pattern for NC and ECC specimens and the specimens exhibited pullout mode of failure with post peak slip development. Following the peak load (descending branch), the pullout load dropped quickly—indi-cating that as slip increased, the bonding decreased sharply. Bond-slip curves of both ECC and NC showed similar trend of variation, however, ECC showed lower slip at peak load and lower bond stress reduction with slip (a measure of higher
ductility) as evident from the post-peak descending branch (Fig.7). ECC showed certain improvement in bond strength with some enhanced post-peak behavior (more ductility) due to high fiber confinement. It should be noted that the use of different fiber ratios in ECC can further improve the post-peak behaviour.
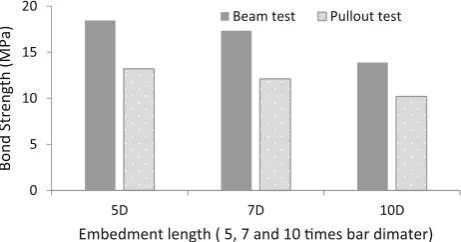
Due to the presence of transverse reinforcement as stated in the ACI 408R-03 (2003), the concrete is confined to prevent a splitting failure and thus develops higher bond stress causing bar pullout failure. As a result, bond strengths from beam test having transverse reinforcement are higher than those of pullout tests. This is evident from Fig.8which compares the bond strength of 15.9 mm LM GFRP bars embedded in NC from current beam tests with those obtained from pullout tests (having similar clear cover and concrete compressive strength) reported by Hossain et al. (2014). Beam bond strength, on average, was 1.36 times higher than those obtained from pullout test (Fig.8).
The GFRP bar embedded in ECC also showed higher bond strength and ductility (in terms of lower rate of post peak slip development) compared to NC (Fig.8) similar to that reported by Harajli et al. (2002).
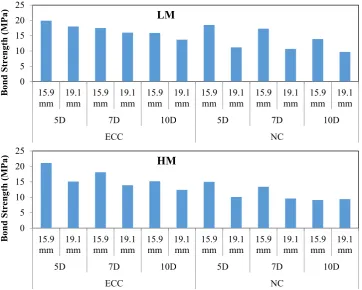
3.4 Effect of Bar Diameter, Bar Type, Embedded Length and Concrete Type
The effects of bar diameter and embedded length on bond strength are shown in Fig.9. In general, the bond strengths
Table 4 Test results—specimen details, bar peak load and bond strength.
Spec. ID Embedded length LM bar HM bar Ratio of bond
strength
Peak load as % of ultimate load of GFRP bar
Designation mm Peak load*
(kN)
Bond strength*
(MPa)
Peak load* (kN)
Bond strength*
(MPa)
sHM/sLM LM HM
ECC-12.7 5D 60 59.5 21.9 53.9 18.4 0.84 46.9 32.4
7D 84 73.3 19.3 60.6 14.6 0.76 57.7 36.5
10D 120 94.2 17.3 68.3 11.7 0.67 74.2 41.2
ECC-15.9 5D 80 86.5 19.9 99.9 21.1 1.06 46.3 42.5
7D 112 106.8 17.5 119.8 18.1 1.03 57.1 51.0
10D 160 138.2 15.9 143.7 15.2 0.96 73.9 61.2
ECC-19.1 5D 95 109.9 18.0 97.8 15.1 0.84 40.8 30.9
7D 133 136.7 16.0 126.0 13.9 0.87 50.8 39.8
10D 190 168.2 13.7 160.8 12.4 0.90 62.5 50.7
NC-15.9 5D 80 80.3 18.5 70.7 15.0 0.81 42.9 30.1
7D 112 105.6 17.3 89.0 13.4 0.78 56.4 37.9
10D 160 120.8 13.9 99.2 10.5 0.76 64.6 42.2
NC-19.1 5D 95 68.7 11.2 65.4 10.1 0.90 25.5 20.6
7D 133 91.8 10.7 87.0 9.6 0.90 34.1 27.4
10D 190 118.7 9.7 122.3 9.4 0.97 44.1 38.6
Mean cylinder compressive strength of ECC and NC—57 and 63 MPa, respectively. All specimens failed due to bar pullout.
in ECC specimens were higher than their NC counterparts for both LM and HM bars. Also, bond strengths of larger diameter bars were lower compared to their small diameter counterparts (Table4and Fig.9). In the current study, bond strengths of 12.7 mm diameter bar were higher than 15.9 mm bar ones and bond strengths of 15.9 mm diameter bar were higher than 19.1 mm diameter ones (s12.7[s15.9[s19.1). Previous studies also reported that the
bond strength of GFRP bars embedded in NC decreased with the increase of the bar diameter (Hossain et al. 2014; Hao et al.2009). Kotynia et al. (2007) also observed a 21% bond strength reduction with the increase of ribbed GFRP bar diameter from 12 to 16 mm having 10D embedment length in 35 MPa normal concrete (made of crushed sand, stone and cement) showing rib failure in RILEM beam test. This could be attributed to the greater amount of bleed water trapped beneath the larger bar diameter for NC creating voids which consequently reduces the bond strength by reducing rebar-concrete the contact area. For the case of
ECC, the amount of bleed water present in the fresh state is significantly less than the normal NC. Therefore, it is expected that the effect of bleed water should be reduced for ECC and hence, higher bond strength should be expected (Davalos et al. 2008). Another possible reason for the reduction in bond strength with the increase of the bar size is the Poisson’s ratio effect. Studies have shown that the diameter reduction increases with the bar size (indicating that the Poisson’s effect has a greater influence on the larger diameter bar) leading to a reduction in frictional and mechanical locking stresses producing lower bond strength (Hossain et al.2014; Davalos et al.2008). The better bond behavior of small diameter bars than large diameter ones for a given embedment length can be explained by fracture mechanics—if one considers debonding as propagation of tunnel crack around the rebar. In this case, the debonding force is not proportional to the rebar area and not mainly depend on the ratio of bond surface to bar area but mostly on the size effect. Since the size effect in plain smooth bars is mostly related to the localized debonding at bar-concrete interface, the balance between the energy required to increase bar debonding and that released by the concrete embedment has to be considered. The embedment length-diameter ratio plays a major role—the larger the ratio the larger the size effect (Stang et al. 1990; Bamonte et al.
2003).
On the other hand, for high strain capacity of ECC (300–500 times greater than the NC) the reduction in fric-tional and mechanical locking stresses due to the reduction in bar diameter for Poisson’s effect could be minimized by deformation in concrete. This should increase the bond strength of ECC specimens compared to their NC 0
5 10 15 20 25
3
Bond Stress
(MPa)
Slip (mm) ECC-15.9-5D-LM
0 5 10 15 20 25
0 1 2 0 1 2 3
Bond Stress
(MPa)
Slip (mm) ECC-15.9-5D-HM
0 5 10 15 20 25
0 1 2 3
Bond Stress
(MPa)
Slip (mm) NC-15.9-5D-LM
Fig. 7 Typical bond-slip curves from the beam tests.
0 5 10 15 20
5D 7D 10D
Bond Strength (MPa)
Embedment length ( 5, 7 and 10 mes bar dimater) Beam test Pullout test
counterparts. Table5 shows that the bond strength of both LM and HM bars in ECC was consistently higher (maximum 1.60 times higher for LM and 1.50 times higher for HM bars as evident from the ratio of bond strength) than their NC counterparts irrespective of embedded length and bar diameter.
Bond strength of HM bars are comparatively lower than there LM counter parts for both ECC and NC irrespective of embedded length and bar diameter. This is evident from the ratio of bond strength of HM bar (sHM) to LM bar (sLM)
ranging between 0.67 and 1.06 with a mean value of 0.87 (Table4). The lower bond strength of HM bar was attributed to the premature detachment of the sand coating from the core compared to only small area of delamination for LM bar. This could due to the higher strength and lower interface bond between sand coating and FRP core for the HM bars used in this study. This was confirmed from the higher
interface delamination of HM bars in tested beam specimens compared to their LM counterparts.
Higher bond strength in ECC specimens could also be attributed to the generation of high radial confinement due to the presence of PVA fiber and transverse reinforcement. In the beam specimens, the concrete surrounding the GFRP bar was under tension, making the beam specimens more sus-ceptible to cracking. The strain hardening and micro-crack-ing characteristics of ECC would provide more resistance to such cracking compared to NC. The fiber-bridging tends to stop the propagation of splitting cracks (initiated when the tangential bond stress exceeds the tensile strength of ECC) leading to comparatively ductile pullout failure of all ECC specimens rather than splitting. The confinement provided by the crack bridging combined with higher energy absorption for crack propagation can be attributed to the improved bond strength of ECC. Previous research studies
0 5 10 15 20 25
15.9
mm 19.1mm 15.9mm 19.1mm 15.9mm 19.1mm 15.9mm 19.1mm 15.9mm 19.1mm 15.9mm 19.1mm
5D 7D 10D 5D 7D 10D
C N C
C E
Bond Strength (MPa)
LM
0 5 10 15 20 25
15.9
mm 19.1mm 15.9mm 19.1mm 15.9mm 19.1mm 15.9mm 19.1mm 15.9mm 19.1mm 15.9mm 19.1mm
5D 7D 10D 5D 7D 10D
C N C
C E
Bond Strength (MPa)
HM
Fig. 9 Effect of bar diameter and embedded length on bond strength.
Table 5 Comparison of bond stress between ECC and NC specimens.
Bar dia (mm) Embedded length LM bar HM bar
Designation Value (mm) Ratio of bond stress
sECC/sNC
Ratio of bond stress
sECC/sNC
15.9 5D 80 1.08 1.41
7D 112 1.01 1.35
10D 160 1.14 1.45
19.1 5D 95 1.60 1.50
7D 133 1.49 1.45
also confirmed such improved bond strength in steel fiber reinforced concrete (Ezeldin and Balaguru1989; Soroushian et al. 1991; ACI 446.1R-91 (1991). For practical construc-tion point of view, the conclusions derived from the beam tests are more practical (as it simulates actual concrete-rebar interaction in structural elements) than traditional pullout test.
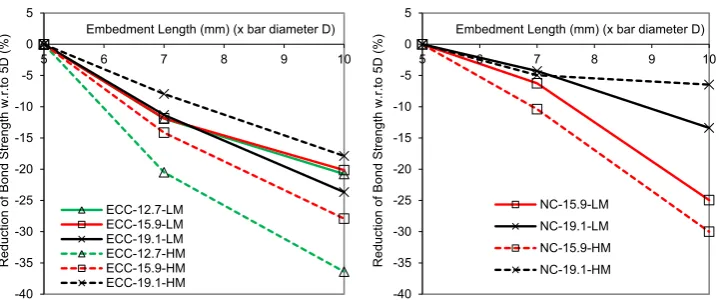
According to Table4 and Fig.9, the bond strength (LM and HM bars), in general, decreased with the increase of embedment length. This decrease was associated with the calculation of bond strength assuming constant bond stress distribution while higher non-linear distribution of bond stresses normally happened with longer embedded length in concrete. Achillides and Pilakoutas (2004) reported that as the embedment length increases, the stress is unevenly dis-tributed over a longer length leading to the decrease in average bond strength. The reduction of bond strength (with respect to 5D embedment bond strength) increased with the increase of embedment length (Fig.10) for ECC/NC or LM/ HM bar. For NC, maximum bond strength reductions of 25 and 30% were observed for LM and HM bar, respectively, while reductions of 24 and 36% for ECC were observed (Fig.10). A reduction in bond strength with the increase in embedment length was observed in fiber reinforced concrete (made of hooked steel fiber and coarse stone aggregate) for sand coated/ribbed GFRP bar in RILEM beam tests having confining reinforcement in previous research studies (Mazaheripour et al. (2013)—bond strength reductions of about 28 and 26% were observed respectively for 12 mm sand coated and ribbed bars showing pullout mode of failure when embedment length was increased from 5D to 10D.
HM bars generally produced lower bond strength com-pared to their LM counterparts. According to the Canadian Bridge Design Code (CHBDC) (CSA S6-06 2006), higher modular ratio (ratio of modulus of elasticity of FRP bar to that of steel bar, ‘Efrp/Es’) should yield higher bond strength.
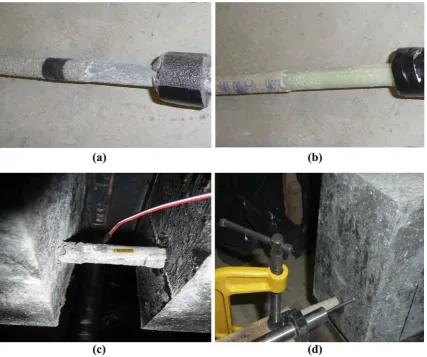
This implies that HM bar should produce higher bond strength than its LM counterpart. The lower bond strength of HM bar in this study was attributed to the premature detachment of the sand coating from the rebar core—for HM bar, the entire sand coating was delaminated compared to only small area of delamination for LM bar (Fig.11a, b). This finding can lead to the restricted use of HM bar.
However, this phenomenon was thought to be associated with particular type of HM bar used in this study. It is expected that HM bars should develop equal or higher bond strength as LM bars and more investigations should be conducted with the currently available HM bars in the market. In general, the development length of steel bar should be longer enough to guarantee the yielding of rein-forcement. This research indicates that the embedment length of GFRP bars should not be longer than the certain threshold as GFRP bars did not reach their failure load and failure was governed by pullout (as shown in Fig.11c, d) due to delamination or detachment of sand coating.
4. Code Based Bond Analyses
and Comparison
For comparative purposes, the bond strength provided by the design codes are determined based on the specimen configurations in terms of bar size, concrete strength, con-crete cover and reinforcement properties used in the RILEM beam tests. The average bond strengths calculated as per CSA S806-12 (2012), CSA S6-06 (2006) and ACI 440.1R-15 (2015) are compared with those determined from beam specimens using Eq. (1).
Bond strength as per CSA S806-12 (2012) can be deter-mined from Eq. (2):
s¼ dcs
ffiffiffiffi
f0
c p
1:15k1k2k3k4k5pdb
ð2Þ
where k1is bar location factor; k2is concrete density factor;
k3is bar size factor; k4is bar fibre factor; k5is bar surface
profile factor; dcs is the smaller of the distance from the
closest concrete surface to the centre of the bar being developed and two-thirds of the centre-to-centre spacing of the bars being developed (shall not be taken greater than 2.5 times bar diameter ‘db‘, mm); Efrp and fc0 is the concrete
compressive strength.
Bond strength as per CSA S6-06 (2006) can be derived from Eq. (3):
-40 -35 -30 -25 -20 -15 -10 -5 0 5
5 6 7 8 9 10
Reduction
of Bond Strength
w
.r.to
5D (%)
Embedment Length (mm) (x bar diameter D)
ECC-12.7-LM ECC-15.9-LM ECC-19.1-LM ECC-12.7-HM ECC-15.9-HM ECC-19.1-HM -40 -35 -30 -25 -20 -15 -10 -5 0 5
5 6 7 8 9 10
Reduction
of Bond Strength
w
.r.to
5D (%)
Embedment Length (mm) (x bar diameter D)
NC-15.9-LM
NC-19.1-LM
NC-15.9-HM
NC-19.1-HM
s¼
dcsþktrEEfrps
fcr
0:45k1k6pdb
; ktr
¼ Atrfy
10:5sn; dcsþktr
Efrp
Es
2:5db
ð3Þ
where k6is bar surface factor; Efrpand Esare the modulus of
elasticity of FRP and steel in MPa, respectively; fcris the
flexural strength of concrete in MPa (usually 0.4 ffiffiffiffif0
c p
); Atris
the area of transverse reinforcement normal to the plane through the anchored bars in mm2; fyis the yield stress of
steel in MPa; s is the spacing of transverse reinforcement in mm; n is the number of bars being developed or spliced;ktr is the transverse reinforcement index. The maximum per-missible value offc
0
. is limited to 64 MPa by CSA S806-02 and CSA S6-06.
According to ACI 440.1R-15 (2015), bond strength can be calculated from Eq. (4):
s¼ 0:33þ0:025C
db
þ8:3db
le
ffiffiffiffi
f0
c p
ð4Þ
whereleis the embedment length, C is the lesser of distance from the cover to the center of the bar, one-half of the center-on-center spacing of the bars being developed (C/dbshould
not be taken larger than 3.5).
According to Okelo and Yuan (2005) and Lee et al. (2008), the bond strength of can be calculated based on Eqs. (5) and6, respectively:
s¼14:70 ffiffiffiffi
f0
c p
db
!
ð5Þ
s¼3:3fc00:3 ð6Þ
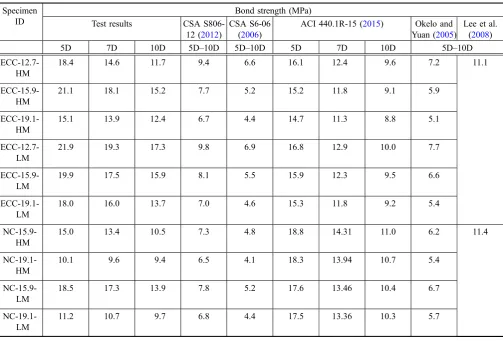
Table6compares the bond strengths obtained from beam tests with those derived from Codes and other existing equations. The concrete strength and the bar size do not influence the bond strength as per CSA-S806-12 and CSA S6-06. However, it can be noticed from the test results that the higher tensile strength and toughness (due to fiber presence and confinement) of ECC could affect the bond strength—the prediction equations should include compres-sive strength and some parameter that takes into account the influence of enhanced tensile strength and confinement. As the distance from the center of the bar to the closest concrete surface was greater than two times the bar diameter, the effect of confinement provided by the transverse reinforce-ment (taken into account by the transverse reinforcereinforce-ment index,ktr., as per CSA S6-06), was neglected.
The ratios of experimental to predicted (Code based and other existing equations) bond strength are summarized in Table7. Between 5D and 10D embedment length, CSA-S806-12 (with ratio of experimental to predicted bond strength ‘‘r’’ ranging between 1.24 and 2.74 with a mean value ranging between 2.08 and CSA S6-06 (with ‘r’ ranging between 1.77 and 4.06 with a mean value of 3.07 lead to conservative bond strength prediction of ECC spec-imens. Okelo and Yuan (2005) Eq. (5) also under predicted the bond strength of both LM/HM bars in ECC (‘r’ ranging between 1.63 and 3.58 with a mean value of 2.67—Eq. (5) reflects the influence of bar diameter and the concrete compressive strength of up to 60 MPa. ACI 440.1-15 (with ‘r’ ranging between 1.03 and 1.73 with a mean value of 1.37) provided a reasonably good bond strength prediction though conservative. It should be noted that the ACI Eq. (4) is developed based on concrete strength between 28 and 45 MPa. Equation6of Lee et al. (2008) showed compara-tively better prediction of bond strength compared to other equations except ACI Eq. (4) with ‘r’ ranging between 1.05 and 1.97 having mean value of 1.50.
For NC similar to ECC (Table7), CSA-S806-12 (with ‘‘r’’ ranging between 1.43 and 2.37 with a mean value of 1.43, CSA S6-06 (with ‘r’ ranging between 2.19 and 3.56 with a mean value of 2.66 and Eq. (5) of Okelo and Yuan (2005) (‘r’ ranging between 1.69 and 2.76 with a mean value of
2.05) under predicted the bond strength. ACI 440.1-15 (with ‘r’ ranging between 0.55 and 1.34 with a mean value of 0.91) showed slight over prediction while Eq. (6) of Lee et al. (2008) showed comparatively better prediction with ‘r’ ranging between 0.82 and 1.62 having mean value of 1.09. Overall, bond strength (for both LM and HM bars) derived from the beam tests are higher than those predicted by Code based and other existing equations. It can be concluded that these equations provide a conservative prediction of bond strength. Hence the bond strength predicted by the design Codes and other equations will be safe for both LM and HM GFRP bars embedded in ECC confinement but needs to be modified.
5. Conclusions
The bond behaviour of sand coated low/standard modulus (LM) and high modulus (HM) GFRP bars embedded in self-consolidating engineered cementitious composite (ECC) and normal vibrated concrete (NC) was investigated. Ninety beam specimens were tested to study analyze the effects of bar diameter, bar type, embedment length and concrete type on bond strength and failure modes. Based on experimental and Code based analyses, the following conclusions were drawn:
Table 6 Experimental and code predicted bond strengths for LM and HM bars.
Specimen ID
Bond strength (MPa)
Test results CSA
S806-12 (2012)
CSA S6-06
(2006)
ACI 440.1R-15 (2015) Okelo and
Yuan (2005)
Lee et al.
(2008)
5D 7D 10D 5D–10D 5D–10D 5D 7D 10D 5D–10D
ECC-12.7-HM
18.4 14.6 11.7 9.4 6.6 16.1 12.4 9.6 7.2 11.1
ECC-15.9-HM
21.1 18.1 15.2 7.7 5.2 15.2 11.8 9.1 5.9
ECC-19.1-HM
15.1 13.9 12.4 6.7 4.4 14.7 11.3 8.8 5.1
ECC-12.7-LM
21.9 19.3 17.3 9.8 6.9 16.8 12.9 10.0 7.7
ECC-15.9-LM
19.9 17.5 15.9 8.1 5.5 15.9 12.3 9.5 6.6
ECC-19.1-LM
18.0 16.0 13.7 7.0 4.6 15.3 11.8 9.2 5.4
NC-15.9-HM
15.0 13.4 10.5 7.3 4.8 18.8 14.31 11.0 6.2 11.4
NC-19.1-HM
10.1 9.6 9.4 6.5 4.1 18.3 13.94 10.7 5.4
NC-15.9-LM
18.5 17.3 13.9 7.8 5.2 17.6 13.46 10.4 6.7
NC-19.1-LM
11.2 10.7 9.7 6.8 4.4 17.5 13.36 10.3 5.7
• All specimens showed pullout mode of failure under varying embedment length, bar type, bar diameter and concrete type.
• The peak load in GFRP bar increased with the increase of the embedded length for both ECC and NC specimens. ECC specimens developed higher peak load compared to their NC counterparts. All beam specimens failed due to bond failure and not due to rebar rupture as the maximum peak load was only 74.2% of the ultimate load of the bar.
• Bond strength of both LM and HM bars in ECC was higher (maximum 1.60 and 1.50 times higher for LM and HM bars, respectively) than their NC counterparts irrespective of embedded length and bar diameter.
• Bond strengths of HM bars were consistently lower than their LM counterparts for both ECC and NC irrespective of embedded length and bar diameter—as evident from the mean ratio of bond strength of HM bar to LM bar of 0.87. This was primarily attributed to the premature detachment of the sand coating from the rebar core. This phenomenon was thought to be associated with particular type of HM bar used in this study and more investiga-tions are needed with HM bars currently available in the market.
• The bond strength, in general, decreased with the increase of embedment length from 5 to 10 time bar diameter. For NC and ECC, maximum bond strength reduction of 30 and 36%, respectively were observed.
Table 7 Ratio of experimental and code predicted bond strengths for LM and HM bars.
Spec. ID Ratio ofsex/spre(= r)
CSA S806-12 (2012) CSA S6-06 (2006) ACI 440.1R (2015) Okelo and Yuan (2005) Lee et al. (2008)
5D 7D 10D 5D 7D 10D 5D 7D 10D 5D 7D 10D 5D 7D 10D
Engineered cementitious composite (ECC) specimens
HM bar
ECC-12.7
1.96 1.55 1.24 2.79 2.21 1.77 1.14 1.18 1.22 2.56 2.03 1.63 1.66 1.32 1.05
ECC-15.9
2.74 2.35 1.97 4.06 3.48 2.92 1.39 1.53 1.67 3.58 3.07 2.58 1.90 1.63 1.37
ECC-19.1
2.25 2.07 1.85 3.43 3.16 2.82 1.03 1.23 1.41 2.96 2.73 2.43 1.36 1.25 1.12
LM bar
ECC-12.7
2.23 1.97 1.77 3.17 2.80 2.51 1.30 1.50 1.73 2.84 2.51 2.25 1.97 1.74 1.56
ECC-15.9
2.46 2.16 1.96 3.62 3.18 2.89 1.25 1.42 1.67 3.02 2.65 2.41 1.79 1.58 1.43
ECC-19.1
2.57 2.29 1.96 3.91 3.48 2.98 1.18 1.36 1.49 3.33 2.96 2.54 1.62 1.44 1.23
Max 2.74 4.06 1.73 3.58 1.97
Min 1.24 1.77 1.03 1.63 1.05
Mean 2.08 3.07 1.37 2.67 1.50
Normal concrete (NC) specimens
HM bar
NC-15.9
2.05 1.84 1.44 3.13 2.79 2.19 0.80 0.94 0.95 2.42 2.16 1.69 1.32 1.18 0.92
NC-19.1
1.55 1.48 1.45 2.46 2.34 2.29 0.55 0.69 0.88 1.87 1.78 1.74 0.89 0.84 0.82
LM bar
NC-15.9
2.37 2.22 1.78 3.56 3.33 2.67 1.05 1.29 1.34 2.76 2.58 2.07 1.62 1.52 1.22
NC-19.1
1.65 1.57 1.43 2.55 2.43 2.20 0.64 0.80 0.94 1.96 1.88 1.70 0.98 0.94 0.85
Max 2.37 3.56 1.34 2.76 1.62
Min 1.43 2.19 0.55 1.69 0.82
Mean 1.74 2.66 0.91 2.05 1.09
Overall statistics
Mean 2.18 1.95 1.68 3.27 2.92 2.52 1.03 1.19 1.33 2.73 2.43 2.10 1.51 1.34 1.16
• Bond strengths (derived from beam tests) of both LM and HM bars embedded in ECC were found to be higher than those predicted by CSA S806-12, CSA S6-06, ACI 440.1R-15 and other existing equations. ACI 440.1-15 provided a better bond strength prediction compared to other equations with ratio of predicted to experimental values ranging from 1.03 to 1.33 for NC and from 1.18 to 1.49 for ECC. It is concluded that the Code based and other existing equations provide a conservative predic-tion of bond strength and can safely be used for the bond strength prediction of GFRP bars embedded in ECC. However, the mean ratio of predicted to experimental values ranging between 1.37 and 3.07 suggests that modifications to these Codes are necessary for the prediction of bond strength of ECC.
Acknowledgement
Authors acknowledge the financial support provided by the Natural Science and Engineering Research Council (NSERC) Canada. The collaboration from V-ROD Canada is also acknowledged.
Open Access
This article is distributed under the terms of the Creative Commons Attribution 4.0 International License (http:// creativecommons.org/licenses/by/4.0/), which permits un restricted use, distribution, and reproduction in any medium, provided you give appropriate credit to the original author(s) and the source, provide a link to the Creative Commons license, and indicate if changes were made.
References
Achillides, Z., & Pilakoutas, K. (2004). Bond behavior of fiber reinforced polymer bars under direct pullout conditions.
ASCE Journal of Composites for Construction, 8,73–181.
ACI 446.1R-91. (1991). Fracture mechanics of concrete: con-cepts, models and determination of material proper-ties.
Reported by ACI Committee 446-Fracture Mechanics, (Re
approved 1999). ISBN: 9780870310782.
ACI 440.1R-15. (2015). ACI Committee 440, Guide for the design and construction of structural concrete reinforced
with FRP bars. Farmington Hills, MI: American Concrete
Institute.
ACI Committee 408. (2003).Bond and development of straight
reinforcing bars in tension, ACI 408R-03. Farmington
Hills, MI: American Concrete Institute.
ASTM C143/C143 M. (2015).Standard test method for slump
of hydraulic cement concrete. West Conshohocken, PA:
ASTM International.
ASTM C192/C192 M. (2011). Standard practice for making
and curing concrete test specimens in the laboratory. West
Conshohocken, PA: ASTM International.
ASTM C231/C231 M. (2011). Standard test method for air
content of freshly mixed concrete by the pressure method.
West Conshohocken, PA: ASTM International.
ASTM C39/C39 M. (2011). Standard test method for
com-pressive strength of cylindrical concrete specimens. West
Conshohocken, PA: ASTM International.
ASTM C78/C78 M. (2010).Standard test method for flexural
strength of concrete. Annual Book of ASTM Standard. West
Conshohocken, PA: ASTM International.
Bamonte, P., Coronelli, D., & Gambarova, P. G. (2003). Smooth anchored bars in NSC and HPC: A study on size effect.
Journal of Advanced Concrete Technology, 1(1), 42–53.
Benmokrane, B., Wang, P., Ton-That, T., Rahman, H., & Robert, J. (2002). Durability of glass fibre reinforced polymer reinforcing bars in concrete environment. ASCE
Journal of Composites for Construction, 62,143–153.
Chaallal, O., & Benmokrane, B. (1993). Bond of glass-fiber-rods embedded in concrete and grout. RILEM Journal of
Materials & Structures, 16(157), 167–175.
Chen, Y., Davalos, J. F., & Ray, I. (2006). Durability prediction for GFRP bars using short-term data of accelerated aging tests.ASCE Journal of Composites for Construction, 104,
279–286.
Choi, D.-U., Chun, S.-U., & Ha, S.-S. (2012). Bond strength of glass fibre-reinforced polymer bars in unconfined concrete.
Engineering Structures, 3,303–313.
CSA S6-06. (2006). Canadian highway bridge design code
(CHBDC), 2006. Rexdale, ON: Canadian Standards
Association.
CSA S806-12. (2012). Design and construction of building
components with fibre reinforced polymers. Rexdale, ON:
Canadian Standards Association.
Davalos, J., Chen, Y., & Ray, I. (2008). Effect of FRP bar degradation on interface bond with high strength concrete.
Cement & Concrete Composites, 30,722–730.
Ezeldin, A., & Balaguru, P. (1989). Bond behavior of normal and high-strength fiber reinforced concrete.ACI Materials
Journal, 86(5), 515–524.
Gardoni, P., Trejo, D., & Kim, Y. H. (2013). Time-variant strength capacity model for GFRP bars embedded in con-crete.ASCE Journal of Engineering Mechanics, 139(10), 1435–1445.
Gu, X., Yu, B., & Wu, M. (2016). Experimental study of the bond performance and mechanical response of GFRP reinforced concrete.Construction and Building Materials, 114,407–415.
Hao, Q., Wang, Y., He, Z., & Ou, J. (2009). Bond strength of glass fibre reinforced polymer ribbed rebars in normal strength concrete.Construction and Building Materials, 23,
865–871.
Harajli, M., Hamad, B., & Karam, K. (2002). Bond-slip response of reinforcing bars embedded in plain and fiber concrete.ASCE Journal of Materials Civil Engineering, 14,
Hossain, K. M. A., Ametrano, D., & Lachemi, M. (2014). Bond strength of standard and modulus GFRP bars in high-strength concrete. ASCE Journal of Materials Civil
Engi-neering, 26,449–456.
Hossain, K. M. A., & Anwar, M. S. (2014).Properties of green engineered cementitious composites incorporating volcanic
materials, structural faults?repair, 8th–10th July.
Lon-don, UK: Imperial College.
Hossain, K. M. A., Gahtrehsamani, S., & Anwar, M. S. (2015a). Flexural fatigue performance of ECC link slabs for bridge deck applications. In K. M. Mahmoud (Ed.), Sustainable
bridge structure, Chapter 22 (p. 247). EH Leiden: CRC
Press-Balkema, Taylor & Francis Group.
Hossain, K. M. A., Hamoda, A. A. A., Sennah, K., Shoukry, M. E. S., & Mahmoud, Z. I. (2015b). Bond strength of ribbed GFRP bars embedded in high performance fiber reinforced concrete.Journal of Multidisciplinary Engineering Science
and Technology (JMEST), 2,1260–1267.
Issani, R., & Hossain, K. M. A. (2013). High performance ECC floor slabs in coupled shear wall structures. In 3rd CSCE
Int. Spec. Conf. Material Eng. & Applied Mech, Montre´al,
May 29–June 1.
Kim, Y. H., Trejo, D., & Gardoni, P. (2012). Time-variant capacity and reliability of GFRP-reinforced bridge decks.
ASCE Journal of Composites for Construction, 16(4),
359–370.
Kotynia, R., Szczech, D., & Kaszubska, M. (2007). Bond behavior of GRFP bars to concrete in beam test.Procedia
Engineering, 193,401–408.
Lee, J.-Y., Kim, T.-Y., Kim, T.-J., Yi, C.-K., Park, J.-S., You, Y.-C., et al. (2008). Interfacial bond strength of glass fibre reinforced polymer bars in high-strength concrete.
Com-posites Part B Engineering, 39, 258–270.
Li, V. C. (2003). On engineered cementitious composites (ECC)—A review of the material and its applications.
Journal of Advanced Concrete Technology, 1(3), 215–230.
Li, V. C., & Kanda, T. (1998). Engineered cementitious com-posites for structural applications. ASCE Journal of
Mate-rials in Civil Engineering, 10(2), 66–69.
Masmoudi, R., Masmoudi, A., Ouezdou, M. B., & Daoud, A. (2011). Long-term bond performance of GFRP bars in concrete under temperature ranging from 20C to 80 & #xB0;C. Construction and Building Materials, 25,
486–493.
Mazaheripour, H., Joaquim, A. O., Barros, J. A. O., Sena-Cruz, J., & Martinelli, E. (2013). Experimental study on bond performance of GFRP bars in self-compacting steel fiber reinforced concrete. Composite Structures, 95(Jan), 202–212.
Mufti, A. A., Banthia, N., Benmokrane, B., Boulfiza, M., & Newhook, J. P. (2007). Durability of GFRP composite rods.
Concrete International, 29(2), 37–42.
Okelo, R., & Yuan, R. L. (2005). Bond strength of fiber rein-forced polymer rebars in normal strength concrete.ASCE
Journal of Composites for Construction, 9,203–213.
Ozbay, E., Karahan, O., Lachemi, M., Hossain, K. M. A., & Atis, C. D. (2012). Investigation of properties of ECC Incorporating high volumes of fly ash and metakaolin.ACI
Materials Journal, 109(5), 565–571.
Park, Y., Kim, Y. H., & Lee, S.-H. (2014). Long-term flexural behaviors of GFRP reinforced concrete beams exposed to accelerated aging exposure conditions. Polymers, 6,
1773–1793.https://doi.org/10.3390/polym6061773. Rafiei, S., Hossain, K. M. A., Lachemi, M., Behdinan, K., &
Anwar, M. (2013). FE modeling of double skin profiled composite shear wall system under in-plane loadings.
Engineering Structures, 56(Nov), 46–57.
RILEM. (1994). RC 6—Bond test for reinforcement steel. In RILEM recommendations for the testing and use of
con-structions materials. London: E & FN SPON.
Robert, M., & Benmokrane, B. (2010). Effect of aging on bond of GFRP bars embedded in concrete.Cement & Concrete
Composites, 32(6), 461–467.
Robert, M., Cousin, P., & Benmokrane, B. (2009). Durability of GFRP reinforcing bars embedded in moist concrete.ASCE
Journal of Composites for Construction, 13(2), 66–73.
S¸ahmaran, M., Lachemi, M., Hossain, K. M. A., & Li, V. C. (2009). Influence of aggregate type and size on the ductility and mechanical properties of ECC.ACI Materials Journal, 106(3), 308–316.
Sherir, M. A. A., Hossain, K. M. A., & Lachemi, M. (2015). Structural performance of polymer fiber reinforced engi-neered cementitious composites subjected to static and fatigue flexural loading.Polymers, 7,1299–1330. Sherir, M. A. A., Hossain, K. M. A., & Lachemi, M. (2017).
Development and recovery of mechanical properties of self-healing cementitious composites with MgO expansive agent. Construction and Building Materials, 148 (Septem-ber), 789–810.
Soroushian, P., Choi, K. B., Park, G. H., & Aslani, F. (1991). Bond of deformed bars to concrete: Effects of confinement and strength of concrete. ACI Materials Journal, 88(3), 227–232.
Stang, H., Li, Z., & Shah, S. P. (1990). Pull-out problem: Stress versus fracture mechanical approach. ASCE Journal of
Engineering Mechanics, 116(10), 2136–2150.
Tighiouart, B., Benmokrane, B., & Gao, D. (1998). Investiga-tion of bond in concrete member with fibre reinforced polymer (FRP) bars.Construction and Building Materials, 12(8), 453–462.
Yan, F., Lin, Z., & Yang, M. (2016). Bond mechanism and bond strength of GFRP bars to concrete: A review.Composites