INTERNATIONAL JOURNAL OF PHARMACEUTICS & DRUG ANALYSIS
VOL.4 ISSUE 2, 2016; 64 – 71 ; http://ijpda.com; ISSN: 2348-8948
64
RESEARCH ARTICLE
DEVELOPMENT,
VALIDA-TION & STRESS
DEGRA-DATION STUDIES OF
DARUNAVIR BY REVERSE
PHASE-HIGH
PERFOR-MANCE LIQUID
CHROMATOGRAPHGY
(RP-HPLC)
PVSR Mohana Rao1, Dr. Jagannadha Rao Vepa2, Tata Santosh3, Dr. K Raghu Babu1*
1Andhra University College of Engineering, Andhra Universtiy, Andhra Pradesh, India.
2Anil Neerukonda Institute of Technology & Science, Vi-sakhapatnam, Andhra Pradesh, India.
3Corpuscle Research Solutions, Andhra Pradesh, India.
Date Received: 30th January 2016; Date Accepted: 11th February
2016 Date published: 12th February 2016
Email: drraghualways@yahoo.co.in
Abstract: A simple, selective, rapid, precise and economi-cal reverse phase high pressure liquid chromatographic method has been developed for the estimation of Darunavir in pharmaceutical dosage form. The mobile phase consisted of 80:20% (v/v) of Methanol & 0.1% or-tho-phosphoric acid was used and operated on isocratic mode. The flow rate is 1.0 mL/min. Chromatographic de-termination of Darunavir was performed on Agilent Pola-ris C18 column (150 X 4.6 mm id, ODS 2,5µ m). The wave-length of detection is 265nm. The injection volume is 20µL. The retention time of Darunavir is 2.42 ± 0.01minutes. The developed method was validated in terms of accuracy, precision, linearity, limit of detection, limit of quantification and solution stability. The influence of Acid, Alkaline, Oxidative stress, Photolytic stress con-dition on Darunavir was studied. Results indicated com-pleted degradation in Alkaline medium. The proposed method has been successfully used for the estimation in
tablet dosage forms.
Key words: Darunavir; HPLC, Tablet formulation.
Introduction
Darunavir ethanolate (DRV) is an oral anti-retroviral agent which selectively inhibits the cleavage of Human
immunodeficiency virus (HIV-1) encoded
65
2. EXPERIMENTAL
2.1 Reagents and Chemicals
Methanol (HPLC grade, Merck Ltd), Milli-Q water, Darunavir ( Reference standard purchased from Sigma Aldrich, USA), 0.1% Ortho-Phosphoric acid (GR Grade, SD Fine Chem Ltd). All other chemicals are of the highest grade commercially available unless otherwise specified.
2.2 Instrumentation
The chromatographic system consisted of a Shimadzu Class VP Binary pump LC-10ATvp, SIL-10ADvp Auto sampler, CTO-10Avp Column Temperature Oven, SPD-10Avp UV-Visible detector. All the components of the system are controlled using SCL-10Avp System Control-ler. Data acquisition was done using LC solutions soft-ware.
2.3 Chromatographic Conditions
The mobile phase consisted of 80:20 % (v/v) of Methanol & 0.1% Ortho-phosphoric acid operated on isocratic mode. The flow rate is 1.0 ml/min. Chromatographic de-termination of Darunavir was performed on Agilent Pola-ris C18 column (150 X 4.6mm id, ODS 2,5µm). The wave-length of detection is 265. The injection volume is 20µL.
2.4 Preparation of standard solutions, Calibration stand-ards & Quality Control Samples
Stock solution of Darunavir (5mg/mL) was prepared sep-arately in a volumetric flask and labelled accordingly. Suitable dilutions of Darunavir were prepared using 50:50 % v/v Methanol & Milli-Q water as diluents solutions. A linear Calibration curve containing eight zero standards were prepared using diluent solution in the concentration range of 10.3-101.27µg/mL. The linear standard calibra-tion standard sample is then transferred into the auto sampler for analysis. Samples for Specificity (Sample with Drug; Blank Sample were also prepared accordingly).
For the preparation of quality control samples, a separate stock containing approximately the same concentration of the drug substance is prepared and labelled as quality control stock. From this stock, quality control samples
were prepared at three concentration levels namely LQC (23.20 µg/mL), MQC (50.64 µg/mL), HQC (73.65 µg/mL) so as to obtain low, median and high concentration quali-ty control samples. The performance of the linear calibra-tion curve is then evaluated using quality control sam-ples.
2.5. Assay
The assay of tablets containing Darunavir is done using the procedure given in Indian Pharmacopoeia for tab-lets. Briefly, twenty tablets, each containing 600 mg of Darunavir as labelled claim were weighed and finely powered; a quantity of powder equivalent to 600 mg of Darunavir was transferred to a 20mL volumetric flask. To this 10mL of methanol was initially added and vortexed thoroughly. The final volume is made up to volume with methanol. The final solution was mixed well. This mixture is then carefully filtered using 0.45µm membrane filter. The filtrate is then taken and suitably diluted and injected for analysis. The assay content was evaluated using the regression equation of linear calibration curve.
2.5 Method Validation 2.5.1 System Suitability
System suitability tests are an integral part of liquid chromatographic method in the course of optimizing the conditions of the proposed method. They are used to veri-fy that the resolution and reproducibility were adequate for the analysis performed. The parameters of these tests are column efficiency (number of theoretical plates), tail-ing factor of chromatographic peak. The system suitabil-ity was assessed by six replicate analysis of the drug at a concentration of 50.64 µg/ml. The acceptance criterion is ± 1 % for the per cent coefficient of the variation for the peak area and retention times for the drug.
2.5.2 Detection and Quantitation Limits (Sensitivity)
Limits of detection (LOD) and quantification (LOQ) ( Fig-3) were estimated from both linearity calibration curve method and signal to noise ratio method. The detection limit was defined as the lowest concentration level resulting in a peak area of three times the baseline noise. The quantification limit was defined as the lowest concentration level that provided a peak area with signal to noise ratio higher than 5, with precision (%CV) and accuracy with (±) 20%.
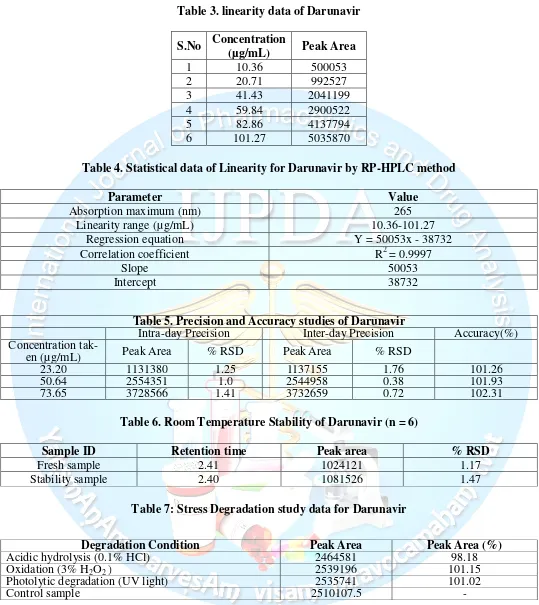
2.5.3 Linearity (Calibration curve)
Mohana Rao PVSR et al, Int J. Pharm. Drug. Anal, Vol: 4, Issue: 2, 2016; 64-71
Available online at http://ijpda.com
66 analysis, which was calculated by least square method
(Fig. 4).
2.5.4 Precision and Accuracy
Precision is the measure of closeness of the data values to each other for a number of measurements under the same analytical conditions. Precision of the assay was deter-mined by repeatability (intra-day) and intermediate pre-cision (inter-day). Repeatability refers to the use of the analytical procedure within the laboratory over the short-er pshort-eriod of the time that was evaluated by assaying the QC (Quality control) samples during the same day. Inter-mediate precision was assessed by comparing the assays on different days (3 days). Accuracy of the assay method was determined for both intra-day and inter-day varia-tions using triplicate analysis of the QC samples.
2.5.5 Specificity
Specificity of the method was determined by comparing the Blank sample with that of the sample containing Darunavir (Fig-5). A less than 20% interference of the peak area at the retention time of the drug in the blank sample is taken as acceptance criteria for the analyte. Sample Specificity is also observed in the degradation study of the drug. None of the degraded products must interfere with the quantification of the drug.
2.5.6 Stability
The stability of the drug is determined by placing the MQC samples for the short term stability by keeping at room temperature up to12 hours and then comparing the obtained peak area with that of the similarly pre-pared fresh sample. Further, auto-sampler stability for up to 24 hrs was studied and established.
2.5.7 Stress Degradation Studies
For Stress Degradation Analysis, 1 mL aliquots (in dupli-cate) of samples containing MQC level concentration are treated separately with 100 µL of 0.1N HCl (Acid stress), 0.1N NaOH (Alkaline stress), 5% v/v Hydrogen Peroxide (Oxidative Stress), for 24 Hrs. Samples for Photolytic stress are placed in a transparent glass vial & placed in a UV chamber for 24 Hrs. Samples are then injected for analysis. The results of analysis are then compared with similarly prepared fresh samples.
3. RESULTS AND DISCUSSION
3.1 Method Development and Validation
The HPLC procedure was optimized with a view to de-velop a stability indicating assay method. Functional group analysis revealed the presence of acidic character to the molecule. Therefore we evaluated the chromato-graphic behaviour at different pH values ranging from pH 3.0 to pH 6.5 using various columns like
Hypersil-BDS- C18, Symmetry C18, Ymc-pack C18, Ymc-packpro, Spherisorb C18, Phenomenex C18 have been tried with different buffer salts such ammonium Formate, ortho phosphoric acid, di- potassium hydrogen orthophos-phate, in combination with acetonitrile, methanol and tetrahydrofuran. However less tailing and high theoretical plates are obtained with Agilent Polaris ODS column C18 150 X 4.6 cm 5µm column. Mobile phase composition consisted of (80:20 v/v) of Methanol and 0.1% Ortho-phosphoric acid operated on isocratic mode. The flow rate of the method is 1.0 ml/min. Calibration standards were prepared in diluents solution containing 50:50 % v/v of methanol and Milli-Q water. The wavelength of detection is 265 nm. The column temperature is main-tained at ambient condition. At the reported flow rate, peak shape was excellent, however increasing or de-creasing the flow rate resulted in unacceptable tailing factor and poor peak shape. Hence 1.0 ml/min was op-timized flow rate decreasing the consumption of the mo-bile phase, which in turn proves to be cost effective for long term routine quality control analysis. A typical chromatogram showing the separation of the drug is giv-en in Fig-2.
3.2 Method Validation
3.2.1 System Suitability
The % RSD of the peak area and the retention time for both drug and internal standard are within the acceptable range (Table-1). The efficiency of the column was ex-pressed as the number of theoretical plates for the six replicate injections and the USP tailing factor was 4195 and 1.26 ± 0.05.
3.2.2 Determination and Quantification Limits (Sensitivity)
Limit of Detection (LOD) and Limit of Quantifica-tion(LOQ) were calculated based on calibration curves. They were expressed as LOD = (3.3× σ)/S; LOQ = (10× σ)/S (where σ is the standard deviation of the y-intercepts of the regression line and m is the mean of the slope of the calibration curve). Fig-3 represents the chromatogram of limit of detection and limit of quantification. The method is found to be sensitive which can be determined from the data obtained from the (Table-2).
3.3.3 Linearity
Mohana Rao PVSR et al, Int J. Pharm. Drug. Anal, Vol: 4, Issue: 2, 2016; 64-71
Available online at http://ijpda.com
68
Table 1. System Suitability test for Darunavir
S.No
Retention Time
Peak Area
Theoretical Plates
Tailing factor
1
2.43
2623947
4292
1.18
2
2.41
2613500
4161
1.27
3
2.42
2616504
4085
1.25
4
2.41
2623343
4066
1.27
5
2.41
2692873
4396
1.28
6
2.42
2741876
4172
1.32
Mean
2.42
2652007.17
4195.33
1.26
Std.Dev
0.01
53101.24
126.68
0.05
%CV
0.34
2.00
3.02
3.66
Table 2. Sensitivity of Darunavir by HPLC
LOQ
LOD
S.No
Retention Time
Peak Area
S.No
Retention Time
Peak Area
1
2.40
72983
1
2.41
34599
2
2.41
72863
2
2.41
34953
3
2.4
72712
3
2.41
34611
Mean
2.40
72852.67
Mean
2.41
34721
Std.Dev
0.01
135.79
Std.Dev
0.00
201.00
69
Table 3. linearity data of Darunavir
S.No
Concentration
(µg/mL)
Peak Area
1
10.36
500053
2
20.71
992527
3
41.43
2041199
4
59.84
2900522
5
82.86
4137794
6
101.27
5035870
Table 4. Statistical data of Linearity for Darunavir by RP-HPLC method
Parameter
Value
Absorption maximum (nm)
265
Linearity range (µg/mL)
10.36-101.27
Regression equation
Y = 50053x - 38732
Correlation coefficient
R
2= 0.9997
Slope
50053
Intercept
38732
Table 5. Precision and Accuracy studies of Darunavir
Intra-day Precision
Inter-day Precision
Accuracy(%)
Concentration
tak-en (µg/mL)
Peak Area
% RSD
Peak Area
% RSD
23.20
1131380
1.25
1137155
1.76
101.26
50.64
2554351
1.0
2544958
0.38
101.93
73.65
3728566
1.41
3732659
0.72
102.31
Table 6. Room Temperature Stability of Darunavir (n = 6)
Sample ID
Retention time
Peak area
% RSD
Fresh sample
2.41
1024121
1.17
Stability sample
2.40
1081526
1.47
Table 7: Stress Degradation study data for Darunavir
Degradation Condition
Peak Area
Peak Area (%)
Acidic hydrolysis (0.1% HCl)
2464581
98.18
Oxidation (3% H
2O
2)
2539196
101.15
Photolytic degradation (UV light)
2535741
101.02
Mohana Rao PVSR et al, Int J. Pharm. Drug. Anal, Vol: 4, Issue: 2, 2016; 64-71
Available online at http://ijpda.com
70
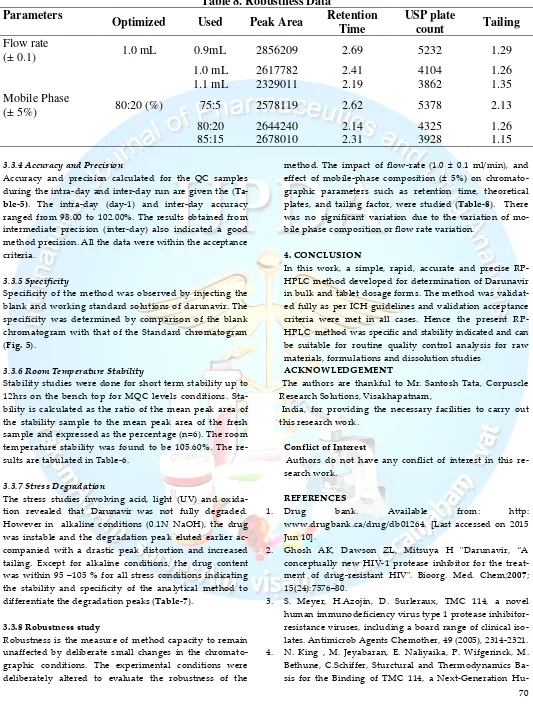
Table 8. Robustness Data
Parameters
Optimized
Used
Peak Area
Retention
Time
USP plate
count
Tailing
Flow rate
(± 0.1)
1.0 mL
0.9mL
2856209
2.69
5232
1.29
1.0 mL
2617782
2.41
4104
1.26
1.1 mL
2329011
2.19
3862
1.35
Mobile Phase
(± 5%)
80:20 (%)
75:5
2578119
2.62
5378
2.13
80:20
2644240
2.14
4325
1.26
85:15
2678010
2.31
3928
1.15
3.3.4 Accuracy and Precision
Accuracy and precision calculated for the QC samples during the intra-day and inter-day run are given the ( Ta-ble-5). The intra-day (day-1) and inter-day accuracy ranged from 98.00 to 102.00%. The results obtained from intermediate precision (inter-day) also indicated a good method precision. All the data were within the acceptance criteria.
3.3.5 Specificity
Specificity of the method was observed by injecting the blank and working standard solutions of darunavir. The specificity was determined by comparison of the blank chromatogram with that of the Standard chromatogram (Fig. 5).
3.3.6 Room Temperature Stability
Stability studies were done for short term stability up to 12hrs on the bench top for MQC levels conditions. Sta-bility is calculated as the ratio of the mean peak area of the stability sample to the mean peak area of the fresh sample and expressed as the percentage (n=6). The room temperature stability was found to be 105.60%. The re-sults are tabulated in Table-6.
3.3.7 Stress Degradation
The stress studies involving acid, light (UV) and oxida-tion revealed that Darunavir was not fully degraded. However in alkaline conditions (0.1N NaOH), the drug was instable and the degradation peak eluted earlier ac-companied with a drastic peak distortion and increased tailing. Except for alkaline conditions, the drug content was within 95 –105 % for all stress conditions indicating the stability and specificity of the analytical method to differentiate the degradation peaks (Table-7).
3.3.8 Robustness study
Robustness is the measure of method capacity to remain unaffected by deliberate small changes in the chromato-graphic conditions. The experimental conditions were deliberately altered to evaluate the robustness of the
method. The impact of flow-rate (1.0 ± 0.1 ml/min), and effect of mobile-phase composition (± 5%) on chromato-graphic parameters such as retention time, theoretical plates, and tailing factor, were studied (Table-8). There was no significant variation due to the variation of mo-bile phase composition or flow rate variation.
4. CONCLUSION
In this work, a simple, rapid, accurate and precise RP-HPLC method developed for determination of Darunavir in bulk and tablet dosage forms. The method was validat-ed fully as per ICH guidelines and validation acceptance criteria were met in all cases. Hence the present RP-HPLC method was specific and stability indicated and can be suitable for routine quality control analysis for raw materials, formulations and dissolution studies
ACKNOWLEDGEMENT
The authors are thankful to Mr. Santosh Tata, Corpuscle Research Solutions, Visakhapatnam,
India, for providing the necessary facilities to carry out this research work.
Conflict of Interest
Authors do not have any conflict of interest in this re-search work.
REFERENCES
1. Drug bank. Available from: http:
www.drugbank.ca/drug/db01264. [Last accessed on 2015 Jun 10].
2. Ghosh AK, Dawson ZL, Mitsuya H "Darunavir, “A conceptually new HIV-1 protease inhibitor for the treat-ment of drug-resistant HIV". Bioorg. Med. Chem;2007; 15(24):7576–80.
Hu-71 man Immunodeficiency Virus Type 1 Protease Inhibitor.
J.Virol, 78(2004), 12012-12021.
5. Clotet,N. Bellos, J.M. Molina, D. Cooper, J.C. Goffard, A. Lazzarin, A. Wohtmann, C. Katlama, T. Wilkin. Efficacy and safety of darunavir-ritonavir at week 48 in treatment-experienced patients with HIV-1 infection in POWER 1 and 2: a pooled subgroup analysis of data from two ran-domised trials Lancet 369 (2007) 1169-1178.
6. "Instrumental Methods of Analysis" by Galen W. Ewing , Mc Graw Hill International Edition, p.48, 378.
7. Amit Patel, Ami Patel and Ashlesha Makwana. (2013). An
ESI-LC-MS/MS method for simultaneous Estimation of Darunavir and Ritonavir in human plasma. International Journal of Research in Pharmaceutical and Biomedical science. 4(4), 1138-47.
8. Nageshwar Rao, Ram chandra, Santosh kumar. RP-HPLC
speration and characterization of unknown impurties of a novel HIV-1 protease inhibitor Darunavir by ESI-MS and 2D NMR spectroscopy. J Pharm Biomed Anal 2013; 75: 186-191.
9. Avolio, M. Siccardi, M. Sciandra, L. Baietto. HPLC-MS method for the simultaneous quantification of the new HIV protease inhibitor darunavir and other anti-retroviral agents in plasma of HIV-infected patients. J Chromatogr B. 859 (2007) 234-240.
10. Hari Babu k, Sisla Ramakrishna , Kiran kumar, Ramesh, Sita Devi. HPTLC method for determination of Darunavir in rat plasma and its application to pharma-ceutics studies. J liq Chromatogra Releated Technol 2013; 36:169-179.
11. Ana Carolina Kongana, Herida Regina. Development and
validation of infra-red spectroscopy method for determi-nation of Darunavir in tablet. Phy Chem 2013; 3:1-6.
12. G. Raveendra Babu, A. Lakshmana Rao and J.
Venkateshwara Rao.(2013). Development and validation of novel HPLC method for estimation of Darunavir in Pharmaceutical formulations. International Journal of Research in Pharmacy and chemistry.3(2), 438-443.
13. Bhavani N.Patel, B.N. Suhagia (2012). Simultaneous Determination and validaton of Darunavir Ethanolate and Ritonavir in binary mixture by Liquid chromatog-raphy. International Journal of Pharm Tech Reseach. 4(4), 1450-56.
14. Raveendra B. Ganduri, Ramprasad A.Lanka, Srinivasu Pamidi, Jayachandra R. Peddareddigari, JVLNS Rao (2011). New RP-HPLC Method for the Determination of Darunavir in Tablet dosage form. Asian j. Pharm.Res. 1(1), 10-14.
15. L. Satyanarayana, S.V. Naidu, M. Narasimha Rao, Alok kumar and K.Suresh (2011). The Estimation of Darunavir
in Tablet Dosage form by RP-HPLC. Asian
J.Res.Pharm.Sci. 1(3),74-76.
16. Manisha B. Mane, Pranali J. Gaikawad, AnujaV. Patil, Aashish S. Mogale (2013). RP-HPLC Method for Determi-nation of Darunavir in Bulk and Pharmaceutical Prepara-tions. Int.J.Pharm.Sci. 21(2), 20-23.
17. Gholve Sachin B, Asware Baburao S., Kadam Shrihari C., Bhusnure Omprakash G. and Thonte Sanjay S (2015). De-velopment and validation of a simple UV spectrophoto-metric method for the determination of Darunavir ethanolate both in bulk and marketed dosage formula-tions. World Journal of pharmaceutical research. 4(3), 1276-83.
18. S. Leonard, A. Schepdael, T. Lvanyi, I. Lazar, J. Rosier, M. Vanstockem (2005). Development of a capillary electro-phoretic method for the separation of diasteroisomers of a new human immunodeficiency virus protease inhibitor. Electrophoresis. 26;627.
19. International Conference on Harmonization (ICH),
Validation of Analytical Procedures: Text and Methodol-ogy Q2 (R1), November 2005.