RESEARCH ARTICLE
ISSN: 2348-8948 Vol: 3; Issue: 4METHOD DEVELOPMENT AND VALIDATION FOR
SIMULTANEOUS ESTIMATION OF ATORVASTATIN,
FENOFIBRATE AND FOLIC ACID IN
PHARMACEUTICAL DOSAGE FORM
K. Shivani, G.Tulja Rani٭
E-mail: [email protected]
Department Of Pharmaceutical Analysis and Quality Assurance, Malla Reddy Institute of Pharmaceutical Sciences, Maisammaguda, Secunderabad, Telangana State, India.
Date Received:
03-Apr-2015
Date of Accepted:
23-Apr-2015
Date Published:
29-Apr-2015
140
Abstract:
A simple, rapid, accurate and precise isocratic reverse phase high performance liquid chromatography (RP-HPLC) method has been developed for simultaneous estimation of atorvastatin, fenofibrate and folic acid in combined dosage form by using C18 column. Mobile phase consisting of a 40 volumes of mixed phosphate buffer (pH 6.0) : 60 volumes of acetonitrile and detection was carried out at 235 nm and the retention times of atorvastatin, fenofibrate and folic acid were found to be 4.407, 3.393and 7.450 min respectively. The developed method was validated as per ICH guideline for specificity, linearity, accuracy, and precision and system suitability. The new RP-HPLC method was successfully applied to marketed formulation without any interference from excipients.
Keywords:
RP-HPLC, Atorvastatin, Fenofibrate and Folic acid, Validation.
Introduction
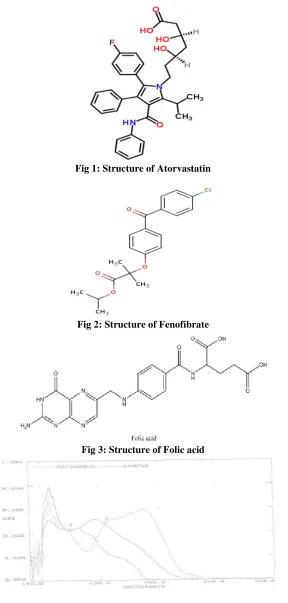
Atorvastatin is a Hydroxymethylglutaryl-CoA Reductase Inhibitors. As HMG-CoA reductase is responsible for converting HMG-CoA to mevalonate in the cholesterol biosynthesis pathway. IUPACname7- [2-(4-fluorophenyl)-3-phenyl-4-(phenylcarbamoyl)-5-(propan-2-yl)-1H-pyrrol-1-yl]-3,5 dihydroxyheptanoate (Fig.1). Its chemical formulais C33H34FN2O5with a molecular mass of 557.6319 g/mol1.
Fenofibrate is a Hypolipidemic Agents Fenofibrate exerts its mechanism of action by activation of peroxisome proliferator activated receptor a (PPARa). IUPAC name propan-2-yl 2-{4-[(4-chlorophenyl) carbonyl] phenoxy}-2-methylpropanoate (Fig.2). Its chemical formula isC20H21ClO4and molecular mass of 360.8312.
Folic acid is a Vitamin B Complex, Dietary Supplements. The folic acid congeners are transported across cells by receptor-mediated endocytosis synthesize purine and thymidylate nucleic acids. IUPAC name (2S)-2-[(4-{[(2-amino-4-oxo-1,4-dihydropteridin-6-yl)phenyl)formamido]pentanedioic acid.(Fig.3). Itschemical formula is C19H19N7O6with a molecular mass of441.3975 g/mol3.
Avalabile online at www.ijpda.com
Tulja Rani G et al; Int.J.Pharm Drug Anal Vol:3 Issue:4 Page:140-149
142
atorvastatin and fenofibrate but the aim of the present work is to develop a simple cost effective RP-HPLC method for simultaneous estimation of atorvastatin, fenofibrate and folic acid in bulk and pharmaceutical dosage form.
METHOD DEVELOPMENT: Instrument:
Separation and quantitation was carried out by Shimadzu LC 20 AT VP HPLC on Inertsil ODS 3V (250x4.6mm) column. Samples were injected by using Hamilton syringe in to 20 µl fixed volume loop and chromatograms were integrated by Spinchrome software.
Chemicals and reagent:
Acetonitrile (HPLC grade), potassium di hydrogen phosphate, di potassium hydrogen phosphate and ortho phosphoric acid used were of AR grade purchased from Merck, Mumbai. Fenofibrate, atorvastatin and folic acid pure drugs obtained as gift samples from Aurobindo Pharmaceutical Ltd., Marketed product AFF (10 mg of atorvastatin+160mg fenofibrate + 5 mg of folic acid) was procured from local pharmacy.
Preparation of mobile phase:
Preparation of mixed phosphate buffer:
1.625 gm. of potassium di hydrogen phosphate (KH2PO4) and 0.3 gm of di potassium hydrogen phosphate (KH2PO4) was weighed and dissolved in 100ml of water and volume was made up to 1000ml with water. Adjust the pH to 6.0 using ortho phosphoric acid. The buffer was filtered through 0.45µ filters to remove all fine particles and gases.
A mixture of 40 volumes of Mixed Phosphate buffer pH 6.0: 60 volumes of acetonitrile was prepared. The mobile phase was sonicated for 10 min to remove gases.
Preparation of standard stock solution:
25mg of atorvastatin, fenofibrate, folic acid was weighed separately and transferred into separate 250ml volumetric flask and dissolved in methanol and then diluted up to the mark with methanol and prepared 10 µg /ml of solution by diluting 1ml to 10ml with methanol.
Selection of detection wavelength:
The wavelength of maximum absorption (λmax) of the drug, 10 µg/ml solution of the drugs in methanol were scanned using UV-Visible spectrophotometer within the wavelength region of 200–400 nm against methanol as blank. The over laid spectrum of both the drug is given in Fig.4
Optimized chromatographic conditions:
Mobile phase : KH2PO4+K2HPO4: ACN
Ratio : 40:60v/v
Column : Inertsil ODS C18 (250×4.6mm× 5µ)
Wavelength : 235 nm
Flow rate : 1ml/min
pH : 6.0±0.05
METHOD VALIDATION:
The method was validated according to ICH guidelines with respect to linearity, specificity, precision, accuracy, system suitability.
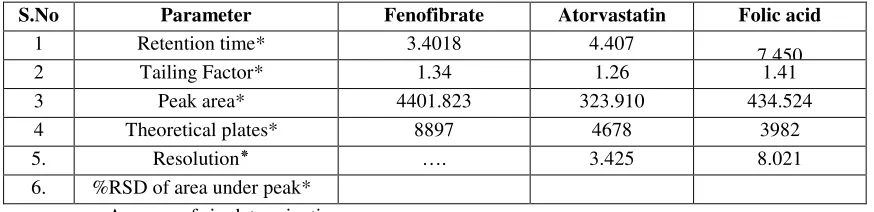
System suitability studies:
For system suitability, six replicates of standard solutions of atorvastatin, fenofibrate and folic acid were injected and studied the suitability parameters like Plate number (N), Resolution (R), Tailing, and %RSD were studied with the help of standard chromatograms. The values obtained demonstrated the suitability of the system for the analysis of this drug combinations, system suitability parameters may fall below 2% standard deviation range during routine performance of the method. System suitability parameters were presented in table 1.
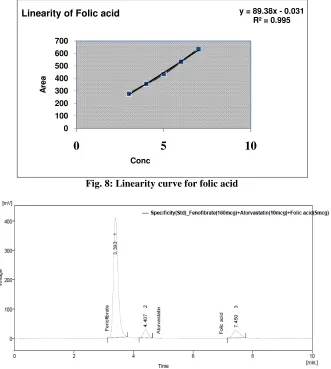
Linearity:
The linearity of the method was determined at five concentration levels. From each solution 10 µl is injected into the optimized chromatographic system. The calibration curves are constructed by plotting area against concentration of drugs (Fig.6, 7and 8). The slope and intercept value of calibration curves were y = 33.18x-16.57 for atorvastatin y=y=20.74x-165.7for fenofibrate and y=89.38x-0.031 for folic acid. Correlation coefficient was 0.996, 0.996 and 0.995 respectively. The linearity data for the drugs is presented in table 2.
Precision:
For precision the sample solution was injected for six times and measured the area for all six injections in HPLC. The %RSD for the area of six replicate injections was found to be within the specified limits and results are tabulated in table 3.
Ruggedness:
The ruggedness of the method was studied by the determining the analyst to analyst variation by performing the Assay by two different analysts. The results were tabulated in table 4.
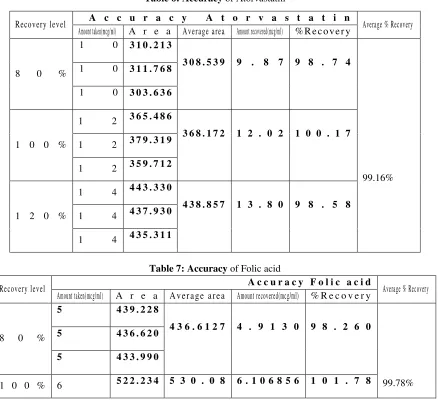
Accuracy:
Avalabile online at www.ijpda.com
Tulja Rani G et al; Int.J.Pharm Drug Anal Vol:3 Issue:4 Page:140-149
143
LOD and LOQ:Limit of quantification and detection were predicted by plotting linearity curve for different nominal concentrations of fenofibrate, atorvastatin and folic acid. Relative standard deviation (σ) method was applied, the LOQ and LOD values were predicted using following formulas (a) and (b).
(a) LOQ = 10 σ / S (b) LOD = 3.3 σ / S
Where σ = residual standard deviation of response S = slope of the calibration curve
The LOD for this method was found to be 6.11µg/ml for fenofibrate and 0.31µg/ml and for atorvastatin,
0.06µg/ml for folic acid.
The LOQ for this method was found to be 18.51 µg/ml for fenofibrate , 0.95 µg/ml for atorvastatin, and 0.18µg/ml for folic acid.
Specificity:
Specificity is the ability to assess unequivocally the analyte in the presence of components which may be expected to be present. Typically these might include impurities, degradants, matrix, etc. The chromatogram was taken by appropriate dilutions and the amount of each drug present in the sample mixture was determined and it was found that there is no interference with the analyte peak Fig.9 and 10.
Preparation of samples for Assay:
Preparation of Standard solution
Mixed standard stock solution (microgram/ml) was prepared by dissolving 160 mg of fenofibrate, 5 mg of folic acid and 10 mg of atorvastatin in sufficient mobile phase and diluted to 50 ml with mobile phase (stock). After that the solution was filtered by using 0.45-micron syringe filter and sonicated for 5 min. Further dilutions was made by adding 1 ml of stock solution to 10 ml of mobile phase to get 160 µg/mL of fenofibrate , 5 µg/mL of folic acid and 10µg/mL of atorvastatin. Standard solution was injected into the column and areas of each drug was recorded to calculate the amount of drug in the tablet.
Preparation of Sample solution
20 Tablets (each tablet contains fenofibrate-160 mg, atorvastatin-10 mg and folic acid-5 mg) were weighed and taken into a mortar crushed and uniformly mixed. Test stock solutions of 160µg/mL of fenofibrate, 5µg/mL of folic acid and 10 µg/mL of atorvastatin were prepared by dissolving required tablet powder in sufficient mobile phase. After that the solution was filtered using 0.45-micron syringe filter and sonicated for 5 min and diluted to 100ml with mobile phase. Further dilutions are
prepared in 5 replicates of 160µg/mL of fenofibrate, 5µg/mL of folic acid and 10 µg/mL of atorvastatin was made by adding 1 ml of stock solution to 10 ml of mobile phase. Sample solution was injected into the optimized chromatographic system (n=5) and average area of each drug was recorded and substituted in the formula.
Calculation
The amount of the fenofibrate, folic acid and atorvastatin present in the formulation by using the formula given below, and results shown in table 7.
Where,
AS: Average peak area due to standard preparation DT: Dilution of assay preparation
AT: Peak area due to assay preparation WT: Weight of sample in assay preparation
WS: Weight of fenofibrate, folic acid and atorvastatinin mg
RESULTS AND DISCUSSION:
Tulja Rani G et al
Fig4: Over laid spectrum of atorvastatin, fenofibrate and folic acid
Avalabile online at www.ijpda.com
et al; Int.J.Pharm Drug Anal Vol:3 Issue:4 Page:140-149
Fig 1: Structure of Atorvastatin
Fig 2: Structure of Fenofibrate
Fig 3: Structure of Folic acid
Fig4: Over laid spectrum of atorvastatin, fenofibrate and folic acid
Tulja Rani G et al
Fig 5: Typical Chromatogram of
Fig.6: Linearity curve for atorvastatin
Fig. 7: Linearity curve for fenofibrate
0
100
200
300
400
500
0
A
re
a
Linearity of Atorvastatin
0 1000 2000 3000 4000 5000
0
A
r
e
a
Avalabile online at www.ijpda.com
et al; Int.J.Pharm Drug Anal Vol:3 Issue:4 Page:140-149
Fig 5: Typical Chromatogram of fenofibrate, folic acid and atorvastatin
Fig.6: Linearity curve for atorvastatin
Fig. 7: Linearity curve for fenofibrate
y = 33.18x - 16.57 R² = 0.997
5
10
15
Conc µg/ml
Linearity of Atorvastatin
y = 20.74x - 165.7 R² = 0.996
50 100 150 200 250
Conc. µg/ml
145
atorvastatinAvalabile online at www.ijpda.com
Tulja Rani G et al; Int.J.Pharm Drug Anal Vol:3 Issue:4 Page:140-149
146
Fig. 8: Linearity curve for folic acid
Fig 9: Standard chromatogram for atorvastatin , fenofibrate and folic acid
Fig 10: Sample chromatogram for atorvastatin , fenofibrate and folic acid
y = 89.38x - 0.031 R² = 0.995
0 100 200 300 400 500 600 700
0
5
10
A
re
a
Conc
Avalabile online at www.ijpda.com
Tulja Rani G et al; Int.J.Pharm Drug Anal Vol:3 Issue:4 Page:140-149
147
Table 1: System suitability parameters of the proposed methodS.No Parameter Fenofibrate Atorvastatin Folic acid
1 Retention time* 3.4018 4.407
7.450
2 Tailing Factor* 1.34 1.26 1.41
3 Peak area* 4401.823 323.910 434.524
4 Theoretical plates* 8897 4678 3982
5. Resolution٭ …. 3.425 8.021
6. %RSD of area under peak* Average of six determinations
Table 2: Linearity data of the proposed method
S.NO Fenofibrate Atorvastatin Folic acid Fenofibrate Atorvastatin Folic acid
1 96 6 3 1863.27 186.327 276.682
2 128 8 4 2499.69 249.969 355.477
3 160 10 5 3062.79 306.279 434.004
4 192 12 6 3815.98 381.598 533.759
5 224 14 7 4524.01 452.401 634.446
Correlation coefficient 0.9974 0.9964 0.9959
Table3:Results for Method precision of Fenofibrate,Atorvastatinand Folic acid
Table 4:Results for Ruggedness
Fenofibrate %Assay Atorvastatin %Assay Folic acid %Assay
Analyst 01 97.73 Analyst 01 98.71 Analyst 01 97.66
Analyst 02 99.76 Analyst 02 100.83 Analyst 02 96.22
%RSD 1.45 %RSD 1.50 %RSD 1.05
S.NO Retention time (min) Area
Fenofibrate Atorvastatin Folic acid Fenofibrate Atorvastatin Folic acid
1
3.393 4.407 7.450 4399.321 321.017 435.059
2 3.397 4.400 7.457 4411.932 327.285 431.134
3 3.407 4.403 7.450 4401.157 324.678 432.436
4 3.410 4.397 7.437 4446.486 321.628 437.173
5 3.407 4.403 7.450 4406.215 320.385 438.475
6 3.397 4.400 7.457 4345.829 328.465 432.844
Avg. 3.4018 4.402 7.450 4401.823 323.910 434.524
Std.dev 0.0070 0.003 0.007 32.429 342.7 2.888
Avalabile online at www.ijpda.com
Tulja Rani G et al; Int.J.Pharm Drug Anal Vol:3 Issue:4 Page:140-149
148
Table5: Accuracy of FenofibrateTable 6: Accuracy of Atorvastatin
Table 7: Accuracy of Folic acid
Recovery level A c c u r a c y F e n o f i b r a t e Average % Recovery Amount taken(mcg/ml) A r e a Average area Amount recovered(mcg/ml) % R e c o v e r y
8 0 %
1 6 0 4 5 3 9 . 8 2 2
4 4 9 7 . 8 1 7 1 5 7 . 6 3 9 8 . 5 2
99.47% 1 6 0 4 5 3 2 . 3 0 7
1 6 0 4 4 2 1 . 3 2 1
1 0 0 %
1 9 2 5 2 0 2 . 1 5 6
5 2 9 6 . 4 6 5 1 9 4 . 5 9 1 0 1 . 3 5
1 9 2 5 2 6 0 . 4 1 1
1 9 2 5 4 2 6 . 8 2 7
1 2 0 %
2 2 4 6 2 4 9 . 8 0 6
6 1 6 7 . 0 9 5 2 2 0 . 7 5 9 8 . 5 5
2 2 4 6 0 2 4 . 2 0 8
2 2 4 6 2 2 7 . 2 7 0
Recovery level A c c u r a c y A t o r v a s t a t i n Average % Recovery Amount taken(mcg/ml) A r e a Average area Amount recovered(mcg/ml) % R e c o v e r y
8 0 %
1 0 3 1 0 . 2 1 3
3 0 8 . 5 3 9 9 . 8 7 9 8 . 7 4
99.16% 1 0 3 1 1 . 7 6 8
1 0 3 0 3 . 6 3 6
1 0 0 %
1 2 3 6 5 . 4 8 6
3 6 8 . 1 7 2 1 2 . 0 2 1 0 0 . 1 7
1 2 3 7 9 . 3 1 9
1 2 3 5 9 . 7 1 2
1 2 0 %
1 4 4 4 3 . 3 3 0
4 3 8 . 8 5 7 1 3 . 8 0 9 8 . 5 8
1 4 4 3 7 . 9 3 0
1 4 4 3 5 . 3 1 1
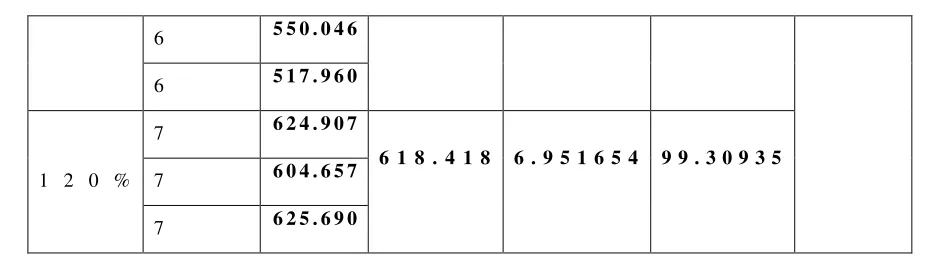
Recovery level A c c u r a c y F o l i c a c i d Average % Recovery Amount taken(mcg/ml) A r e a A v e r a g e a r e a Amount recovered(mcg/ml) % R e c o v e r y
8 0 %
5 4 3 9 . 2 2 8
4 3 6 . 6 1 2 7 4 . 9 1 3 0 9 8 . 2 6 0
99.78%
5 4 3 6 . 6 2 0
5 4 3 3 . 9 9 0
Avalabile online at www.ijpda.com
Tulja Rani G et al; Int.J.Pharm Drug Anal Vol:3 Issue:4 Page:140-149
149
Table 7: Assay results
D r u g L a b e l c l a i m ( m g ) A m o u n t o b t a i n e d ( m g ) % R e c o v e r y
F e n o f i b r a t e 1 6 0 1 5 9 . 9 8 9 9 . 9 8
F o l i c a c i d 5 5 . 0 1 1 0 0 . 2
A t o r v a s t a t i n 1 0 9 . 9 9 9 9 . 9 0
6 5 5 0 . 0 4 6
6 5 1 7 . 9 6 0
1 2 0 %
7 6 2 4 . 9 0 7
6 1 8 . 4 1 8 6 . 9 5 1 6 5 4 9 9 . 3 0 9 3 5
7 6 0 4 . 6 5 7
7 6 2 5 . 6 9 0
CONCLUSION:
The proposed RP-HPLC method is found to be simple, precise, accurate and sensitive for the simultaneous estimation of atorvastatin, fenofibrate and folic acid in pharmaceutical dosage forms. Hence, this method can easily and conveniently adopt for routine quality control analysis ofatorvastatin, fenofibrate and folic acid and in its pharmaceutical dosage form.
REFERENCES:
1.
http://www.drugbank.ca/drugs/DB01076.2.
http://www.drugbank.ca/drugs/db01039.3.
http://www.drugbank.ca/drugs/DB00158.4.
R.A. Mhaske,S. Sahasrabudhe, A.A. Mhaske and D. J. Garole. RP_HPLC method for simultataneous determination of atorvastatin calcium, olmesartan medoxomil, candesartan, hydrochlorothiazide and chlorthalidone – Application To Commercially Available Drug Products. IJPSR, 2012; 3(3): 793-8015.
Nikita N. Patel, Parag R. Patel, Falguni A. Tandel,Charmy S. Kothari, Shailesh A. Shah.Ratio derivative spectrophotometric method for simultaneous estimation of olmesartan medoxomil and atorvastatin calcium in their combined tablet dosage form. International Journal of Pharmacy and Pharmaceutical Sciences 2012 ; 4(5):222-226.
6.
M.S.Kondawar, K.G.Kamble, K.H.Maharshi,M.M.Khandare.UV spectrophotometric estimation of ezetimibe and fenofibrate in bulk drug and dosage form using simultaneous equation method. Int.J. ChemTech Res 2011;3(2): 749-754.
10.
Kamble Reema , Vaidya Itishree , Nangude Shantaram and Gaikwad Jagdish. Method development and validation for the simultaneous estimation of b-group vitamins and atorvastatin in pharmaceutical solid dosage form by RP-HPLC. IJCPBS 2013; 3(2); 330-335.11.
N. Jain, R. Raghuwanshi, and Deeti Jain. Development and validation of RP-HPLC method for simultaneous estimation of atorvastatin calcium and fenofibrate in tablet dosage forms.Indian J pharm SCi 2008; 70(2): 263-265.Azmi NH, Bashir I, Humaimi SH, Ghafri NS.
Quantitative analysis of cefixime via complexation with palladium (II) in pharmaceutical formulations by spectrophotometry. Journal of Pharmaceutical Analysis 2013; 3(4):248-256.
Avalabile online at www.ijpda.com
Tulja Rani G et al; Int.J.Pharm Drug Anal Vol:3 Issue:4 Page:140-149