Abstract
Gross Enrolment Ratio in higher education in India is very low compared to emerging economies. Private colleges are charging heavily for professional courses. Indian families are facing financial inadequacy to meet higher education expenses. To help the poor people banks are asked to give educational loan on priority basis on liberal terms. Still people prefer to go for hand loan with high interest rates for educational purpose rather than banks. This may be due to lack of awareness. This study attempts to find out the sources preferred by the people to get information about educational loan. Primary data is collected from 300 educational loan borrowers in Union Territory of Pondicherry. From the analysis it is found that RBI should conduct awareness programmes to spread popularity of education loan is the top most source preferred for creating awareness. The canonical correlation analysis reveals that the sources of preferred is influenced by their earlier education, portion of repayment completed and perception about awareness level of educational loan.
Keywords: Education loan, sources for creating awareness, Priority sector lending, Borrowers perception, Education loan in Pondicherry.
Introduction
Education loan is a priority sector loan given by banks to help the poor people to pursue higher education. RBI has assigned specific target for education loan to banks. The banks are not meeting the targets given to them. Instead of going to banks for educational loan people are going to private people to get loan at higher interest. The reason may be due to poor awareness. This study attempts to find out ways by which awareness may be created. After having discussion with bank officials nine ways are identified. The borrowers are asked to rate those nine sources based on the preference.
* Research Scholar, Department of Management Studies, Pondicherry University, Kalapet, Pondicherry-605 014. Email : [email protected]
** Associate Professor, Department of Management Studies, Pondicherry University, Kalapet, Pondicherry-605 014. Email : [email protected]
A Study on the Sources for Creating Awareness
of Education Loan
– N. Panjali*
Review of Literature
Ram (2000) observed that the Students Loan Programme was quite successful in Singapore. He noticed in this regard that full employment, continuous demand for skills, labor shortages and higher economic returns to educational investment all tantamount to a degree of economic development in case of Singapore, where the concept of loans for education becomes acceptable with little persuasion and public debate. Actually, agrees with the school of thought (few researchers) which opines that a country could afford to introduce student loans only at a given level of development.
Graham Fowler (2000) plans to increase the number of students entering higher education are welcomed; although it is argued that student loans do not fit in with this policy and that in reality education requires extra funding. The way to expand higher education requires extra funding. The way to expand higher education is seen as through a high-status vocational route. This is contrasted with current forms of vocational schooling. A good general education for students up to the age of 16 is proposed, with subsequent quality vocational training which encourages access to higher education. The increased status of the vocational route will follow and, in return, high quality vocational education will offer motivation for schools, a higher proportion of graduates and more highly qualified staff.
Andrew Austin (2008), in his "Guaranteed Student Loans and Subsidies: who Captures the Rents" analyzes effects of borrowers interest rates and students lender subsidies on federally guaranteed student loan volumes from 1988 to 1994 and from 1996 to 2006. In present and past policy debates, some have contended that lender subsidy cuts would cause some lenders to reduce loan supply or to leave the student loan market. A simple model of the student's loan market suggests that if lenders receive economic rents due to over generous subsidies, small changes in subsidy levels should not affect loan supply. The empirical results based on a variety of GMM panel estimators find evidence in a link between higher SAP margins and higher loan volumes is weak or inconclusive for both the 1988-1994 and 1996-2006 periods. This suggests that subsidy reductions had no discernable effect on student loan volumes. Results also suggest that higher real borrower interest rates reduce student loan volumes for public colleges and universities.
R Srinivasan (2011) concluded that a student is more likely to get education loan if he approaches a public sector bank. Additionally if the student has a higher family income and plans to pursue postgraduate professional study from a government owned / approved institution the chances of getting educational loan is phenomenally higher. Manoj (2013) many of the Educational loan borrowers are landing up in foreign employment and they too lag their repayment but nevertheless make one time settlement. Therefore, the concept of NPA in their case should be reconsidered. The best way to tackle the issue is to constitute the Credit Guarantee fund to periodically give relief to the scheduled banks with respect to the NPAs. At the same time A Debts Recovery Cell can be constituted at the state level which can take over NPA or educational loan issued to students without mortgage. The issue of the loan is now vitiated by arbitrary decisions of some of the officers of the bank branches. A national level eligibility test for the issue of educational loans should be introduced. The educational loan is a powerful tool for the development of the human resource for a developing economy like India.
Objectives of the Study
To investigate the borrower's opinion on sources for creating awareness of educational loan scheme and procedures.
Methodology
For the purpose of this study primary data is collected by using a well-structured questionnaire comprising of statements with a five point Likert scale wherein 1= strongly disagree to 5= strongly agree. The questionnaire was administered to 300 borrowers who have availed educational loans in the UT of Puducherry. Multistage random sampling was used to select respondents, at first 55 bank branches were selected at random. Then respondents were selected at random from the list collected from branches. Several statistical techniques such as the factor analysis, cluster analysis, correspondent analysis, discriminate analysis, ANOVA, chi-square, and canonical correlation were used to augment the borrower's response on the reasons for the non-repayment of educational loans.
Sources for Creating Awareness about Educational Loan
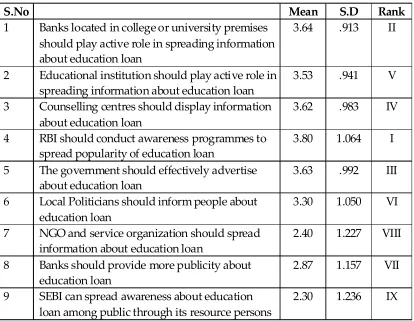
Table 1: Sources of Awareness of Various Institutions
S.No Mean S.D Rank
1 Banks located in college or university premises should play active role in spreading information about education loan
3.64 .913 II
2 Educational institution should play active role in spreading information about education loan
3.53 .941 V
3 Counselling centres should display information about education loan
3.62 .983 IV
4 RBI should conduct awareness programmes to spread popularity of education loan
3.80 1.064 I
5 The government should effectively advertise about education loan
3.63 .992 III
6 Local Politicians should inform people about education loan
3.30 1.050 VI
7 NGO and service organization should spread information about education loan
2.40 1.227 VIII
8 Banks should provide more publicity about education loan
2.87 1.157 VII
9 SEBI can spread awareness about education loan among public through its resource persons
2.30 1.236 IX
Factorization of Sources for Creating Awareness of Educational Loan
The main purpose of factor analysis is to reduce the number of variables into a minimum number of factors based on the relationship among the statements. In order to proceed with the factor analysis, it is necessary to examine the KMO and Bartlett's Test of Sphericity. The KMO test proves the sample adequacy of the data analysed thereby indicating the statistical precision of the factor analysis results.
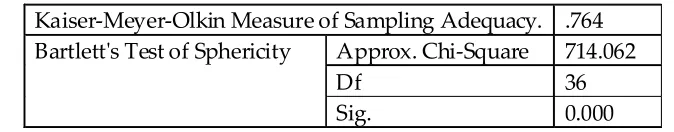
Table 2: KMO and Bartlett's Test
Kaiser-Meyer-Olkin Measure of Sampling Adequacy. .764 Bartlett's Test of Sphericity Approx. Chi-Square 714.062
Df 36
Sig. 0.000
The table 2 shows the KMO value as 0.710, which is more than that of the threshold value of 0.50. This means that the above data satisfy the conditions for factor analysis.
Table 3: Variance Explained by Factors
Component Eigen values % of Variance Cumulative %
1 3.144 25.262 25.262
2 1.690 21.574 46.836
3 0.910 16.986 63.822
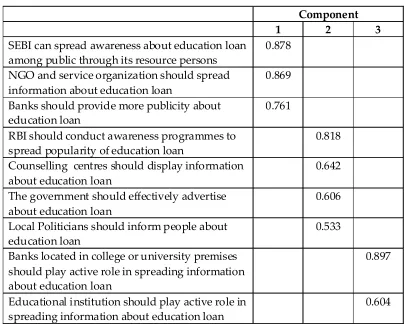
should display information about education loan, the government should effectively advertise about education loan, local Politicians should inform people about education loan. So this factor is named as 'Government' because contains four sub-factors that related to government institutions which are predominantly focusing on the development of education loan. The third factor comprises two sub-factors such as banks located in college or university premises should play active role in spreading information about education loan and educational institution should play active role in spreading information about education loan, this factor named as 'Educational institutions'.
Table 4: Rotated Component Matrix
Component
1 2 3
SEBI can spread awareness about education loan among public through its resource persons
0.878 NGO and service organization should spread
information about education loan
0.869 Banks should provide more publicity about
education loan
0.761 RBI should conduct awareness programmes to
spread popularity of education loan
0.818 Counselling centres should display information
about education loan
0.642 The government should effectively advertise
about education loan
0.606 Local Politicians should inform people about
education loan
0.533 Banks located in college or university premises
should play active role in spreading information about education loan
0.897
Educational institution should play active role in spreading information about education loan
0.604
Segmentation of Educational Loans Borrowers
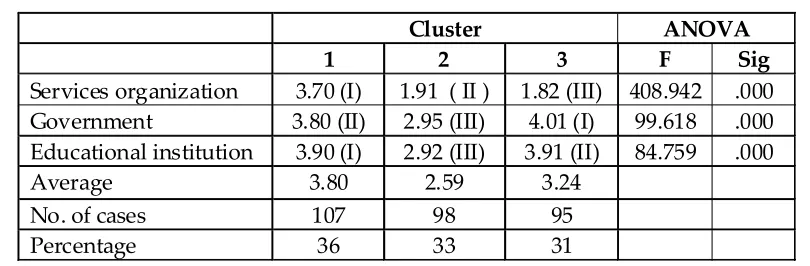
Table 5: Final Cluster Centres and ANOVA
Cluster ANOVA
1 2 3 F Sig
Services organization 3.70 (I) 1.91 ( II ) 1.82 (III) 408.942 .000 Government 3.80 (II) 2.95 (III) 4.01 (I) 99.618 .000 Educational institution 3.90 (I) 2.92 (III) 3.91 (II) 84.759 .000
Average 3.80 2.59 3.24
No. of cases 107 98 95
Percentage 36 33 31
The table 5 presents the mean scores of the level of awareness among educational loan borrowers about various institutions. The first cluster is named as 'Services organization' because this cluster is having high mean scores and ranks for service organisations. The second cluster is named as 'no opinion' because this cluster is having low means scores for all three factors. In the third cluster, borrowers has given more importance to educational institutions and Government therefore, this cluster is named as 'educational institution'. The table also indicates that majority of educational loam borrowers (36 percent) belong first cluster namely services organization cluster, followed by 33 percent of borrowers are included in no opinion cluster and 31 percent of the borrowers are belong to 'educational institutions' cluster. Further, the observation of F value reveals that the services organizations have highest F value followed by government. This indicates that the services organizations are the most popular institutions among educational loan borrowers offering educational loan awareness. This can be attributed to the simple reason that the services organization are the ones that caters to a large section of people by having huge number of institutions, which might have contributed to high awareness among borrowers in the study. However, it is important to note that all three factors are found to be significant at 0.000. This means that the educational loan borrowers are also giving importance educational institution to create awareness.
Reliability of Segmentation
Table 6: Eigen values and Wilks' Lambda
Function Eigen value
Canonical Correlation
Wilks' Lambda
Chi-square Df Sig.
1 3.100a .870 .119 629.229 6 .000
2 1.044a .715 .489 211.561 2 .000
The table 6 depicts the discriminant analysis results. All the two functions have satisfactory Eigen value of more than one that represents the maximum spread of the group means. This implies that there is a good difference among the clusters on the factors. The canonical correlation helps to measure the association between the functions and factors, and found that function one has high canonical correlation.
Table 7: Structure Matrix
Function
1 2
Services organization .994* .003
Government .151 .797*
Educational institution .214 .681*
Table 7 is the structure matrix which gives standardized beta values. It can be inferred that two functions can be formed from the three clusters. These two domain functions can be used separately, to describe the characteristics of population. The two domain functions are
Z1=0.994*Services organization
Z2=0.797*Government+0.681*Educational institutions
The diagram 1 shows the groups centroids of all the three clusters examined in this study. They have different centroids and different mean values. The cluster members are also aligned separately from each other. This shows that there is no error in the segmentation of the three clusters.
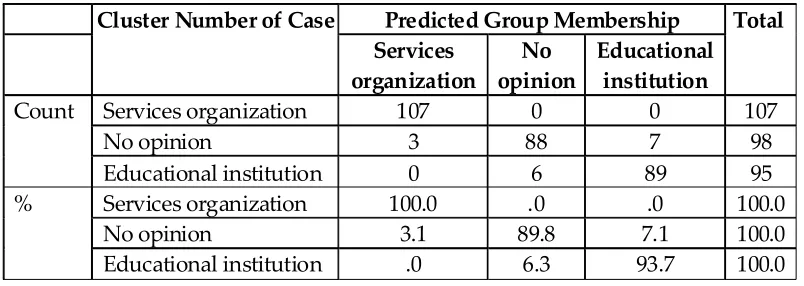
Table 8: Correctness of Classification
Cluster Number of Case Predicted Group Membership Total
Services organization
No opinion
Educational institution
Count Services organization 107 0 0 107
No opinion 3 88 7 98
Educational institution 0 6 89 95
% Services organization 100.0 .0 .0 100.0
No opinion 3.1 89.8 7.1 100.0
Educational institution .0 6.3 93.7 100.0 *94.7% of original grouped cases correctly classified.
Table 8 presents the extent of success of the classification on the basis of sources of awareness of educational loan. It can be inferred that 100 percent that is all 107 cases are correctly classified in services organization segment. Furthermore, 89 percent of no opinion segment is correctly classified and only three cases included in services organization and seven cases are included in educational institutions segment. In the case of educational institution segment, 95 cases accounting for 93 percent are correctly classified and only 6 cases are included into no opinion segment. Therefore, it can be inferred that the segmentation of educational loan borrowers based on the sources for creating awareness about educational loan is correctly carried out.
Relationship between Profile Variable and Sorces of Creating Awareness of
Educational Loan
Table 9: Relationship between Personal Factors and Awareness of Educational loan
S.No. Particulars Chi-square value D.F Sig
1 Gender .480 2 .786
2 Age 1.015 2 .602
3 Social class 14.698 6 .017*
4 Education 6.332 6 .387
5 Percentage of mark 12.968 8 .113
6 Nature of institute 6.690 2 .035*
7 Type of institute 26.241 10 .006*
8 Place of Institute 2.823 4 .588
9 Course studied 13.589 8 .093
10 Duration of Course 5.435 4 .245
11 Hostetler 3.225 2 .190
12 Present status 5.641 4 .228
13 Parent Education 9.153 8 .330
14 Occupation of Parent 5.746 8 .676
15 Family Income 14.404 8 .072
16 Sources of family Income 9.029 8 .340
The table 9 reveals the chi-square results with chi-square value and level of significance. If the value of significance is less than 0.05, then the variables are associated. Among the 16 demographic variables, only three variables (social class, nature of institute and type of institute) have significant association with sources of creating awareness of educational loan. This means that the social class, nature of institute and place of institute of the educational loan borrowers are significantly associated with their awareness of educational loan.
The diagram represents the correspondence analysis explaining the association between the educational status and the awareness about educational loan. From the diagram it is clear that the general social class loan borrowers do not have any specific opinion about sources by which awareness can be created. OBC and MBC people prefer service organization to spread awareness about educational loan. SC category people prefer Educational institution to spread information about educational loan.
Fig 3: Correspondence diagram for Type of institution and Awareness of Educational loan
The correspondence diagram depicts the association between the sources of creating awareness of educational loan and type of Institute. This diagram clears that people who have studied from Government College, Government aided college and private college prefer educational institution to spread information about educational institution. People who study in central university prefer services organisation.
Table 10: Relationship between Profile variables and Sources of Awareness about Educational loan borrowers (ANOVA)
S.
No. Particulars
Services organization
No opinion
Educational institution
1 Social class 4.584 9(.004)* .457 (.712) 2.523 (.063) 2 Education 4.224 (.006)* 1.215 (.304) 2.894 (.077) 3 Percentage of mark 1.594 (.176) 2.100 (.081) 4.950 (.001)* 4 Type of institute 3.507 (.004)* 2.885 (.015)* 1.290 (.268) 5 Place of Institute .567 (.568) .633 (.532) 1.674 (.189) 6 Course studied 2.255 (.063) 1.503 (.201) 1.003 (.406) 7 Duration of Course 1.523 (.220) 1.543 (215) 1.768 (.172) 8 Present status 2.457 (.087) 1.356 (.259) .001 (.999) 9 Parent Education 1.688 (.153) .929 (.447) 1.655 (.160) 10 Occupation of Parent 1.371 (.244) .963 (.428) 1.124 (.345) 11 Family Income .888 (.471) 1.110 (.352) 1.030 (.392) 12 Sources of family Income 1.215 (.304) 2.111 (.079) 1.559 (.185)
Table 11: Duncan table for social class and Education
Social Status Services organization (Mean )
Education Services organization (Mean)
SC 2.23(I) 12th 2.34(I)
General 2.43 (I) 10th 2.50 (I)
OBC 2.73 (I) UG 2.64 (I)
MBC 2.77 (II) PG 3.66 (II)
In comparison to other social status MBC class borrowers and borrowers with PG education qualification prefer services organization to create awareness about educational loan.
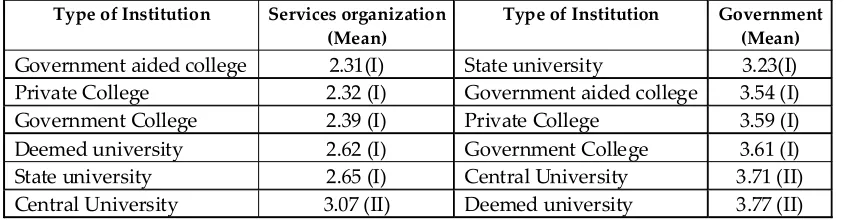
Table 12: Duncan table for Type of institutions
Type of Institution Services organization (Mean)
Type of Institution Government (Mean)
Table 12 shows the post-hoc Duncan analysis results examining the relationship between types of institutions and sources of creating awareness. From the results it is observed that Central University student prefer service organization to create awareness about educational loan. However, borrowers in the central university and Deemed University also prefer Govt. to create awareness about educational loan.
Table 13: Relationship between Profile Variables and Sources of awareness of educational loan (Independent T-test)
S.No Particulars Services
organization
No opinion Educational
institution
1 Gender .287 (.774) .640 (.523) 1.720 (.086) 2 Age 1.046 (.296) 1.827 (.067) .210 (.834) 3 Hostel 1.947 (.052)* .793 (.429) .644 (.520) Sources of awareness of educational loan (Independent T-test)
The table 13 shows the independent sample t-test result which confirms the significant relationship between hostel students and sources for creating awareness of educational loan.
Relationship Between Loan Variable and Sorces of Creating Awareness of
Educational Loan
This study analyse the relationship between loan variables and sources of awareness of educational loan. For this purpose chi-square, analysis of variance and independent sample t-test is used.
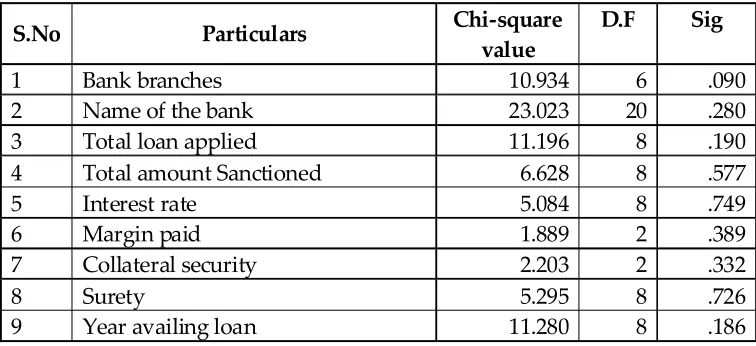
Table 14: Relationship between Loan variables and Sources of Awareness about Educational loan borrowers
S.No Particulars Chi-square
value
D.F Sig
1 Bank branches 10.934 6 .090
2 Name of the bank 23.023 20 .280
3 Total loan applied 11.196 8 .190
4 Total amount Sanctioned 6.628 8 .577
5 Interest rate 5.084 8 .749
6 Margin paid 1.889 2 .389
7 Collateral security 2.203 2 .332
8 Surety 5.295 8 .726
S.No Particulars Chi-square value
D.F Sig
10 Recommendation 11.962 2 .032
11 Getting the total amount 5.100 2 .078
12 Education expenditure 12.234 2 .001*
13 Sanctioning time 9.428 4 .061
14 Disbursement time 19.866 4 .000*
15 Eligible for scholarship 6.521 2 .023*
16 Repayment started period 15.280 6 .004*
17 Portion of repayment completed 35.318 16 .001*
18 Repayment person 5.960 6 .428
19 Level of satisfaction 7.806 8 .453
20 Perception about awareness level 19.719 8 .044* Table 14 shows the chi-square test results which indicate the association between loan variables such as recommendation, education expenditure, disbursement time, eligible for scholarship, repayment started period, portion of repayment completed and overall perception on awareness of educational loan and sources of creating awareness at 5 percent level of significance. This indicates that the loan variables also influence the educational loan borrowers' awareness.
The correspondence diagram explains the association between loan sanctioning time and sources of creating awareness of educational loan among borrowers. People who got loan sanctioned within 1 month is associated with services organization for creating awareness. Furthermore borrowers who got loan sanctioned within 1-2 month sanctioning time are associated with educational institutions and more than two month respondents are associated with no opinion cluster.
Fig. 4b : Correspondence diagram for Disbursement time and Sources of Awareness of Educational loan
The correspondence diagram explains association between the borrowers disbursement time with sources of creating awareness. Borrowers who got loan disbursed after two month are closely associated with services organizations. People who got loan disbursed within 1-2 month are associated with educational institutions to spread awareness of educational loan.
Diagram 4 explains that those borrowers who have repaid 30-50%, 100% and 50-70% are closely associated with educational institution. Similarly, those borrowers who have completed 20-30% and 70-90% of loans are associated with no specific opinion cluster and people who have completed less than 10% and 10-20% of loan are associated with services organization.
Fig 5: Correspondence diagram for Level of awareness and Sources of Awareness
Diagram 5 explains that those borrowers with barely acceptable level of awareness about educational loans are closely associated with the no opinion cluster. Similarly, borrowers with good and very good awareness prefer educational institution to spread information and people who have poor and very poor level of awareness are associated with services organization.
Table No 15: Relationship between Loan variables and Sources of Awareness of Educational loan
S.
No Particulars
Services organization
No opinion Educational
institution
1 Bank branches 2.933 (.064) 2.925 (.064) .017 (.997) 2 Name of the bank 2.749 (.073) .545 (.858) .836 (.595) 2 Total loan applied 1.583 (.176) 2.222 (.067) 2.002 (.094) 3 Amount Sanctioned 1.545 (.189) 2.320 (.077) 1.210 (.307) 4 Interest rate .388 (.817) .340 (.851) 2.737 (.089)
5 Surety 1.033 (.390) .784 (.537) .132 (.971)
6 Year availing loan 1.846 (.120) .886 (.473) 1.155 (.331) 7 Sanctioning time 3.484 (.032)* 2.669 (.071) 5.091 (.007)* 8 Disbursement time 6.800 (.001)* 5.916 (.003)* 2.815 (.061) 9 Repayment period 2.212 (.087) 1.107 (.346) .652 (.582) 10 Portion completed 3.229 (.002)* 2.783 (.006)* 3.084 (.002)* 11 Repayment person 1.954 (.121) .189 (.904) .229 (.876) 12 Level of satisfaction 2.395 (.061) .829 (.508) 1.324 (.261) 13 Perception about awareness 4.775 (.001)* 2.601 (.036)* 5.612 (.000)*
Table 16: Duncan table for Loan sanctioning time
Sanctioning time Services
organization (Mean) Sanctioning time
Educational institution (Mean )
1-2 month 2.37(I) Less than 1 month 2.32 (I)
More than 2 month 2.61 (I) 1-2 month 2.42 (I)
Less than 1 month 2.77 (II) More than 2 month 2.52 (II) Table 16 shows the post-hoc Duncan analysis results examining the relationship between educational loan sanctioning time and sources of creating awareness about educational loan. From the results it is observed that borrowers who got loan sanctioned within one month prefer services organization. However, borrowers who got sanctioned after 2 month preferred educational institutions.
Table 17: Duncan table for Loan Portion of repayment completed Portion of completed repayment loan Services organization (Mean) Portion of completed repayment loan Government (Mean ) Portion of completed repayment loan Educational institution
30-50% 2.01 (I) 70-90% 3.12 (I) 70-90% 2.08 (I)
20-30% 2.20 (I) 20-30% 3.25 (I) 20-30% 2.10 (I)
70-90% 2.29 (I) 10-20% 3.46 (I) 90-99% 2.16 (I)
100% 2.34 (I) 30-50% 3.53 (I) 30-50% 2.22 (I)
50-70% 2.56 (I) Nil 3.54 (I) 10-20% 2.40 (I)
Nil 2.65 (I) Less than 10% 3.63 (I) 50-70% 2.42 (I)
90-99% 2.66 (I) 100% 3.75 (II) Nil 2.45 (I)
Less than 10% 2.92 (II) 50-70% 3.81 (II) Less than 10% 2.49 (II)
10-20% 2.94 (II) 90-99% 4.12 (II) 100% 2.53 (II)
Table 18: Duncan table for Perception about level of awareness
Perception about level of awareness
Services organization
(Mean)
Perception about level of awareness
Government (Mean )
Perception about level of awareness
Educational institution
Very good 2.26 (I) Good 3.51 (I) Very good 2.05 (I)
Barely acceptable 2.40 (I) Barely acceptable 3.52 (I) Good 2.36 (I)
Good 2.42 (I) Very good 3.58 (I) Barely acceptable 2.39 (I)
Poor 2.92 (I) Very poor 3.76 (I) Poor 2.51 (I)
Very poor 3.30 (II) Poor 3.87 (II) Very poor 2.76 (II)
Table 18 shows Duncan results which reveal that borrowers with poor awareness prefer services organization, government and educational institutions to spread information about educational loan.
Table 19: Relationship between Loan Variables and Sources of awareness educational loan (Independent T-test)
S.
No Particulars
Services organization
No opinion Educational
institution
1 Margin paid .699 (.485) .866 (.387) .264 (.792) 2 Collateral security -.154 (.878) 1.080 (.281) .043 (.966) 3 Recommendation 1.832 (.068) 1.681 (.094) -.173 (.863) 4 Getting total amount .762 (.446) 1.158 (.248) .136 (.892) 5 Education expenditure -.660 (510) 3.989 (.000)* 2.347 (.020)* 6 Scholarship .791 (.429) 1.826 (.069) 1.000 (.318)
loan variable such as education expenditure is significantly associated with the sources of creating awareness at 5 percent level of significance.
Table 20: Canonical Correlation of Sources of Awareness of Educational loan
Conclusion
From the analysis it is found that RBI should conduct awareness programmes to spread popularity of education loan is the top most source preferred for creating awareness. The nine sources are categorised into three factors such as service organisations, Govt. and educational institutions. These three are distinctive sources which can be used to spread information about educational loan. Among the 16 demographic variables, only three variables such as social class, nature of institute and type of institute from where they have studied have significant association with sources through which awareness can be created. Chi-square test shows that there is a association between loan variables such as recommendation, education expenditure, disbursement time, eligible for scholarship repayment stared period, portion of complete repayment and overall perception with sources for creating awareness of educational loan at 5 percent significance. The canonical correlation analysis reveals that the sources of preferred is influenced by their earlier education, portion of repayment completed and perception about awareness level of educational loan.
References
1. Austin, (2008), Economics of Guaranteed Student Loans, Congressional Research Service,50, (3) 1-48.
2. Graham Fowler, (2000), The Student loan bubble how the loan crisis can inform the bankruptcy courts. The Visual Arts, Edmonton Journal, 6 (2) 181-223.
3. Harsh Gandhar, (2010), Educational Loan Scheme of Scheduled Commercial Banks In India: An Assessment, Sri Krishna International Research & Educational Consortium, 1,(1) 65-95.
4. Manoj, (2013), Educational loans And Non-Performing Assets-An empirical Study, Indian Journal of Research, 2, (2)184-186.
5. Ram, (2000), Funding Higher Education the Contribute of economic thing to debate and policy development. Journal of social policy, 34, (4) 509-540.