Temporal Analysis of Basal Stem Rot Disease in Oil Palm Plantations:
An Analysis on Peat Soil
Azahar T. M., Jawahir Che Mustapha, Mazliham S., and Patrice Boursier
Abstract
The analysis of plant disease, especially in spatial and temporal terms is very complex process but with the advancement in computer technology, the task has been simplified to large extent. Furthermore, the application of GIS in plant disease analysis is becoming more popular, precise and advanced day by day. GIS helps plant disease analysis in many ways. The primary use is to understand where disease is occurring and based on that preventive measure can be taken. Various analyses can be performed in GIS environment and maps can be derived to benefit a farmer for an effective and comprehensive management of plant disease. For this study, Basal Stem Rot (BSR) disease in oil palm plantation was analyzed. BSR, one of the lethal diseases of oil palm is caused by ganoderma boninense. The disease can kill up to 80% of the stand by the time when the palms are halfway through their normal economic life span. In the present study, the choropleth map, then the interpolated density approach followed by statistical technique shows the various steps to move from overall scenario of disease to pin pointing the disease incident location or hotspot analysis. The study resolves that the hotspots generated by choropleth and density map can be refined and more precisely located with the help of spatial statistical approach. The data acquired from these hotspots can be utilized for the study of advanced analysis such as disease distribution pattern.
Key Words:
Basal Stem Rot (BSR), temporal, hotspots analysis, GIS.1. Introduction
Oil palm has become an important crop in Malaysia. The country is the world’s largest exporter of palm oil and become the world’s leading palm oil producer, with 14.9 million tons of oil palm per year respectively [5]. However, a basidiomycetefungus, species of Ganoderma, which cause basal stem rot disease in oil palm [8], devastate thousands of hectares of plantings in Southeast Asia especially in Malaysia and Indonesia [2]. The disease has been found to infect oil palms as early as 12 to 24 months after planting, with increased incidence on 4 to 5 years old palms, particularly in replanted areas [7], or areas under planted with coconut palm trees [1]. The disease is presently the most prevalent and devastating disease in oil palm cultivation, especially in mature palm
areas in Malaysia [3]. BSR can kill up to 80% of the stand by the time when the palms are halfway through their normal economic life span [8]. The effects of Ganoderma infection on productivity decline in palm crops have been of considerable concern ever since replanting of oil palm land began in South-East Asia, especially in Malaysia and Indonesia [15]. Recently, the International Workshop on Awareness, Detection and Control of Oil Palm Devastating Diseases in Kuala Lumpur, Malaysia has identified BSR disease as a single major devastating disease constraint to oil palm production in the region [11].
Little is known about the spatial and temporal pattern of BSR disease in oil palm plantations. Such information is needed for fully understand disease dynamics, develop more accurate sampling plants better assesses crop loss in relation in relation to disease intensity and design and analyze experiments more efficiently. Until today, limited studies has been done to investigate the spatial patterns of BSR and how BSR is distributed through out the area of plantation.
The growing demand for spatial and temporal pattern analyses over large regions has prompted the application of the Geographical Information System (GIS) that can be used to analyze and manage plant disease information data. GIS is capable of assembling, storing, manipulating and displaying data referenced by geographical coordinates [14]. GIS has been used most extensively for mapping distributions of disease or specific genotypes of plant pathogen [13]. Spatial and temporal pattern analyses have been applied in the field of plant pathology on a variety of scales, from single plots to agricultural regions, to analyze the interactions between pathogens, hosts and the environment in relation to plant disease epidemics.
2. Materials and Methodology
In this enquiry, the temporal distribution of basal stem rot (BSR) disease in oil palm plantation is evaluated. The study was conducted on three different planting densities, in order to compare the effect of planting density to the distribution of BSR in oil palm plantation.
Geographical information system: The database includes several data layers like Perak Map, Regional Map, MPOB map, plantation map, road map and Palm Tree Map. The map is layered using the ArcMap of ArcGIS software.
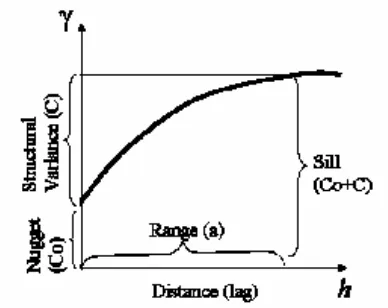
provides a description of how data are correlated with distance or in other word it is a measure of the degree of spatial dependence between samples. The magnitude of the semi-variance between points depends on the distance between them. A smaller distance yields a smaller semi-variance and a larger distance results in larger one [6]. The semivariogram function (Figure 1), γ(h), is defined as half the average squared difference between points separated by a distance h [9] and is described as:
) (
2
)
(
|
)
(
|
2
1
)
(
h N
j i
Z
Z
h
N
h
(1)where N(h) is the number of sample pairs at each distance interval
h
, andz
i andz
j are data values at spatial locations i and j, respectively. The letter h represents a distance measure with magnitude only but when direction also considered, it becomes a vectorh
[9].The graph of γ(h) versus the corresponding values of
h
, called a semivariogram, is a function of the distanceh
and therefore, depends on distance magnitude and direction. A mathematical equation of the semivariogram is used to express the spatial dependence among samples to allow estimation of values for unsampled location. For properties that are spatially dependent, the increment)
(
Z
i
Z
j is expected to increase with distance, up tosome distance beyond which it stabilizes at a sill value
(
C
0
C
)
, and is numerically almost equal to the variance of the data. This distance is called the range (a) and represents the radius of a circle within which the observations are correlated. The intercept to γ(h) axis is called nugget effect(
C
0)
, and represents the variabilityat distances smaller than the minimum sampling distance.
In practice, the direction effect was considered by computing experimental variograms according to different directions of the
h
vector. The resulting graphs were compared, and no significant differences indicate that the field plot may be considered isotropic. In this study only isotropic models were considered. The spatial structure of the data is determined by fitting a mathematical model to the experimental semivariogram.Hotspots analysis: One may be interested in going beyond modeling the spatial structure, such as values for unsampled locations must be estimated to build a detailed, precise map of the variable under study. In this case, it is necessary to interpolate between the sampled points. In this study, kriging is used as an interpolating method based on spatial structure produced by semivariogram. Field maps are produced by ordinary block kriging.
The semivariogram analysis was performed using Geostatictical Analyst tool of ArcGIS. Models were fit to semivariogram and then were kriged, based on these models, to determine spatially related patches of data.
3. Study Area
The plantation is situated at Teluk Intan (3.49oN, 101.06oS) and is managed by MPOB (Malaysian Palm Oil Board). The total experiment area is about 10.88 ha. The palms were planted in August 1985 using a hole-in-hole planting method. Previously the area was covered by jungle. The study area is flat, receives a moderately high and uniformly distributed rainfall and has a high soil water table. The annual rainfall at the site varied from 1696 to 2404 mm with the driest month being July and the wettest, November [8].
The soil is characterized a very deep (above 3 metres) peat, comprised of heterogeneous mixture of more or less decomposed plant (humus) material that has accumulated in a water-saturated environment and in the absence of oxygen [8].
Fig.1. Schema of semivariogram used for analysis of spatial structure
Among the important inherent characteristics of the Malaysia peat land is the presence of a dense mass of woody materials, usually water-logged in its natural state, shrinkage and subsidence upon drainage, irreversible drying if excessively drained, extreme acidity and low fertility status [1]. Its structure ranges from more or less decomposed plant remains to a fine amorphic, colloidal mass [12]. The peat medium is a structureless material that has a very low bulk density, low in nutrients and low in pH level [10]. The site was previously a secondary peat forest.
4. Field Data Collection
Information on BSR disease incidences was obtained from Malaysia Palm Oil Board (MPOB) who is conducting a comprehensive monitoring program since the palms was planted in August 1985. In this study, BSR disease incidences from 1993 until 2005 were studied. The trial was laid out on block 4A2 of MPOB Research Station area.
5. Experimental Results and Discussion
Three main plots of palm oil densities were created, Planting density A (160 palms/ha), Planting density B (120 palms/ha) and Planting density C (200 palms/ha) (Figure 3). The three palm oil densities represent a reasonable range that could be used commercially. The palms were arranged in an equi-triangular planting. Planting density A, and C were split into 28 sub-plots while planting density B was split into 23 sub-plots. Each sub-plot contained 19 to 25 oil palms. Planting density A, B and C were planted with a distance of 8.5 m x 8.5 m x 8.5 m, 9.8 m x 9.8 m x 9.8 m and 7.6 m x 7.6 m x 7.6 m for each tree respectively.
The studied data was collected over a thirteen years period, from 1993 to 2005. Census was carried out in August during each year where oil palms were visually
recorded into two categories with BSR or without BSR disease (healthy). The distribution of the BSR disease on block 4A2 (Figure 3) then was mapped using ArcMap of ArcGIS 9.2 (ESRI).
Geographic locations of each palm are collected using GPS receiver. The GPS is a highly accurate satellite based radio navigation system providing three-dimensional positioning, velocity, and time information.
5. Experimental Result and Discussion
A. Summary of Census
Figure 4 shows a summary of BSR incidences in planting density A, B and C. After four years of observation, in planting density A 41.12% of oil palms were affected by BSR disease, and 35.53% of oil palms were affected by BSR in planting density B.
A total of 439 palms were infected by BSR disease in planting density C in 2005 (76.35%). Planting density C was infected greatly by BSR disease due to the plantation was being planted very near to each other. Unlike plantation A and B which had a moderate distance that reduced the probability of BSR disease. From the observations of the three planting densities, the distance between each palm trees was significant as one of the main factors contributing to BSR disease infection.
B. Spatial Autocorrelation
In order to evaluate the spatial dependence, three classes of spatial dependence for BSR diseases were calculated based on the ratio of nugget (C0) to the sill (C0+C) [4]. If the spatial class ratio was < 25% the variable was considered strongly spatially dependent; if the ratio was > 25% and < 75%, the variable was considered moderately spatially dependent; and if the ratio was >75%, the variable was considered weakly spatially dependent [4]. All the result presented corresponds to the isotropic variogram.
In this study, each palm tree is coded either 1 or 0 to indicate the presence or absence of BSR disease (healthy) status then z can only be 1 or 0 and the change of z from one tree to its neighboring tree is either 0 if both trees are the same or 1 if the trees differ with respect to their BSR Fig. 3. BSR incidences
0 10 20 30 40 50 60 70 80 90
1993 1997 2001 2005
Year
BS
R In
cid
e
n
ces (
%
)
Planting Density A Planting Density B Planting Density C
disease status. For planting density A (160 palms/Ha), the semi variance will be calculated for all trees that are 9.8 m apart (smallest lag) after that for all trees that are 19.6 m apart and so on. While for planting density B (120 palms/Ha), the semi variance will be calculated from the smallest lag of 8.5 m, then 17 m and so on. Meanwhile for planting density C (200 palms/Ha), the semivariogram will be calculated from the smallest lag of 7.6 m, then 15.2 m and so on.
Yea
r Model
Nugge t (C0) SV (C) C0/(C0+C ) (%) Range (m) 1993 1997 2001 2005 Spherica l Spherica l Spherica l Exponen 0.26 7.82 16.89 21.22 0.17 0.01 0.34 1.73 60.5 99.9 98.2 92.5 206.0 198.1 74.5 31.8
Planting density A
Yea
r Model
Nugge t (C0) SV (C) C0/(C0+C ) (%) Rang e (m) 1993 1997 2001 2005 Spherica l Spherica l Spherica l Spherica l 0.30 6.45 17.21 18.82 0.16 1.92 0.78 5.98 65.2 77.1 95.7 75.89 182.1 182.1 182.1 32.0
Planting density B
Yea
r Model
Nugge t (C0) SV (C) C0/(C0+C ) (%) Range (m) 1993 1997 2001 2005 Spherica l Spherica l Spherica l Spherica l 0.51 14.05 24.61 17.75 0.54 0.01 0.43 0.62 48.6 99.9 98.3 96.6 181.6 173.9 88.2 181.6
Planting density C
Table 1. Summary of semivariogram for planting density A, B and C
Table 1 presents summaries of variogram for planting density A, B and C. All the semivariograms were fitted to the spherical model and revealed the average ranges of 33 m, 65 m and 181.56 m for Plantation A, B, and C respectively (Figure 5). There was a strong indication that
the BSR disease in planting density A, B, and C were initially randomly distributed throughout the plantation.
The parameters of semivariograms were fitted according to the model that gave the best coefficient of determination (R2). These model were then validate through the relation
C
0/(
C
0
C
)
, in which we can see that for this BSR disease, this index varied from 60.5% to 99.9%, 65.2% to 95.7%, and 48.6% to 99.9% for planting density A, B and respectively (Table 2). From the result, the spatial autocorrelation found to be relatively weak for all plantation densities. The result shows that the(a) Planting density A
(b) Planting density B
(c) Planting density C
phenomenon being studied is tending towards randomness, with no relation between samples.
C. Kriging
Based on spatial structure produced by semivariogram (Figure 5), kriging or interpolation method was used to maps the temporal distribution of BSR incidences in oil palm plantation (Figure 6).
The Figure 6 showed that dark brown color represents high risk areas and light yellow color represents low risk area of the disease. In year 1997 (12 years after planting), spreading of BSR disease start with 42 palms or 8.1% infected in planting density A, 47 palms or 8.6% infected in planting density B and 97 palms or 16.9% infected in planting density C. Four years later, in 2001 (16 years after planting), percentage of the infected palm was increased to 23.2%, 22.2% and 46.1% respectively. In year 2005 (20 years after planting), infected palm was increase to 41.1%, 35.5% and 76.3% respectively with more hotspots appeared and covered almost all the
plantation especially in planting density C. The result showed that, after the first infection in 1993 (12 years after planting), the spread of BSR were completely random. In 2001 (16 years after planting), root contact of infection was began. Until 2005 (20 years after planting), the infection mostly happened through root contact although the random spreads continuously happen in minimum cases.
Overall distribution of BSR disease incidence in planting density A, B, and C was initially random in 2002 and remained as it was until 2005. This means that all palm trees had a same probability of developing the BSR disease. In planting density C, the increase in BSR incidence was very rapid compared to planting density A, or B, and it was almost completely diseased in only a period of four years (Figure 6). Although the finding shows that the distribution of BSR was random but the result indicates that in higher density plantation, the probability of developing the BSR disease was higher compare to lower density plantation.
1993 1997
2001 2005
6. Conclusion
To summarize, the BSR disease distribution was random throughout the four years of observation in planting density A, B and C. Therefore, based on this preliminary analysis we concluded that the distribution of BSR disease was not associated with oil palm density condition. This study also shows that the distribution of the BSR disease incidence is far higher for the plantation field with a higher density of palm trees compared to palm trees that were in lower density plantation. The occurrence of BSR disease is not a function of an infection from tree to tree, but a function of the disease pressure in the area.
The ability to develop good temporal modeling and prediction of BSR disease will allow a better planning for actions required to eliminate factors that may cause the development of basal stem rot disease.
The knowledge of spatial temporal pattern of BSR disease is useful for making management decisions, especially for application of site-specific management as in precision agriculture. If a section of the field where the pathogen survives is identified and the pathogen density is quantified, there is no need to apply pesticide on the entire field.
Acknowledgement
The authors would like to express their sincere thanks to Universiti Kuala Lumpur for providing the financial support of this research work. They also would like to thank the Malaysian Palm Oil Board (MPOB) agency for providing the data that have been used in this study.
References
1. Ambak, K., and Melling, L., 1999.
Management practices for sustainable cultivation of crop plants on tropical peatland. in Proceedings of the International Symposium on TROPICAL PEATLANDS, Bogor, Indonesia, 22-23 november 1999.
2. Anderson, R.M., and May, R. M. , 1979.
Population biology of infectious diseases. Part I, Nature, 280: p. 361-367.
3. Ariffin, D., Idris, A. S. and Marzuki, A., 1996.
Spread of Ganoderma boninense and
vegetative compatibility studies of a single field palm isolates. Proceedings of the 1996
PORIM International Palm Oil Congress (Agriculture), September 1996, (Palm Oil
Research Institute of Malaysia, Bangi, Selangor, Malaysia): p. 132-141.
4. Cambardella, C.A., Moorman, T. B., Novak, J. M., Parkin, T. B. Karalan, D. L., Turco, R. F. and Konopka, A. E., 1994. Field scale variability of soil properties in central Iowa soils. Soil Science Soc. Am., 58: p. 1501-1511. 5. Carlsson, U., Elmqvist, T., Wennstrom, A., and Ericson, L., 1990. Infection by pathogens and population age of host plants. Journal Ecology, 78: p. 1094-1105.
6. Dorsel, D.a.L.B., T., 1997. Environmental
Sampling and Monitoring Primer, Kriging.
(Available on line at
http://www.ce.vt.edu/program_areas/environm ental/teach/suprimer/kriging/kriging.html#The oryEgns) (Verified October, 2002).
7. Henson, I.E., and Mohd Tayed, D., 2003.
Physiological analysis of an oil palm density trial on a peat soil. Journal of Oil Palm Research 15 No. 2, December 2003: p. 1-27. 8. Idris, A.S., Ismail, S., Ariffin, D., and Ahmad,
H., 2003. Control of Ganoderma-infected palm-development of pressure injection and field applications. MPOB Information Series No. 131.
9. Kaluzny, S.P., Vega, S. C., Cardoso, T. P. and Shelly, A. A., 1998. S+Spatial Stats-Users
Manual for Windows and Unix.
Springer-Verlag New York, Inc., New York: p. 321.
10. Khairudin, H., 1990. Basal stem rot of oil
palm: incidence, etiology and control. Master of Agriculture Science thesis, Universiti Pertanian Malaysia, Selangor, Malaysia.
11. Kushairi, A., Idris, A. S., and Norman, K.,
2010. Proceeding of the International Workshop on Awareness, Detection and Control of Oil Palm Devastating diseases KLCC, Kuala Lumpur, Malaysia.
12. Navaratnam, S.J., 1964. Basal stem rot of oil palm on ex-coconut states. The Planter, 40: p. 256-259.
13. Nelson, M.R., Felix-Gastelum, R., Orum, T.
V., Stowell, L. J., and Myers, D. E., 1994. Geographical information systems and geostatistics in the design and validation of regional plant virus management programs. Phytopathology, 84: p. 898 - 905.
14. Star, J., and Estes, J., 1990, Geographical
Information Systems: An Introduction, ed. P. Hall. Englewood Cliffs, NJ.