An Experimental Study on Problematic Soil
using Admixtures
B. Venkata Lakshmi S. Srinadh Baba
PG Student Assistant Professor
Department of Civil Engineering Department of Civil Engineering Sri Sivani College of Engineering, India Sri Sivani College of Engineering, India
Abstract
The economy concern and depletion of good quality soil resources has forced the pavement engineers to use the locally available soils to achieve economic feasibility. Due to the weak soil properties, it requires replacement of soil in its sub-grade, sub-base and base courses respectively in road construction which affects the major cost of the project. Hence, it may be economical to use the locally available soil as it cuts down cost and sometimes the time of construction. The solutions available for these problems can be:
1) Partial replacement of problematic soil with stabilized soil.
2) Modification of strength of the available soil using, densification techniques.
The present study is carried out to check the improvements in the properties of the locally available red and black cotton soils when blended with admixtures like cement, fly ash and rice husk ash in varying percentages. These results are compared with those of the conventional soil. Stone powder, Fly ash and wood ash are mixed in proportions of 5%, 10% and 15% to the dry weight of soil individually. Index properties including Grain size distribution, Specific gravity and Atterberg’s limits; Engineering properties such as Optimum Moisture Content (OMC), Maximum Dry Density (MDD), CBR, Cohesion (C) and Angle of internal friction (Φ) are being studied for stabilized and natural soils.
Keywords: Red soil, Granite Powder (By Product in Granite Industry), Fly Ash and Wood Ash
________________________________________________________________________________________________________
I. INTRODUCTION
General:
For centuries mankind was wondering at the instability of earth materials. One day they are dry and hard, and the next day wet and soft. Swelling soil always create problem for civil engineering structures, by consolidating under load and by changing volumetrically along with seasonal moisture variation. As a result the superstructures usually counter excessive settlement and differential movements, resulting in damage to foundation systems, structural elements and architectural features. In a significant number of cases the structure becomes unstable or uninhabitable. Even when efforts are made to improve properties of soil, the lack of appropriate technology sometimes results in behavioural change that is responsible for billion dollars damage each year. It is due to this that the present work is taken up. The purpose was to check the scope of improving engineering properties by adding additives. There are number of additives for soil modification like ordinary Portland cement, fly ash, rice husk ash, etc.
Objectives:
This project work entitled, “AN EXPERIMENTAL STUDY ON PROBLEMATIC SOIL USING ADMIUXTURES” mainly deals with the various stabilization techniques used for improving the pavement subgrade properties of different soils. The primary objective of our project is to improve the engineering properties of red and black cotton soils using cement, fly
ash and rice husk ash as admixtures.
The secondary objective is to utilize the by-products generated by Thermal Power Plants and Rice Mills in the stabilization of soils.
II. LITERATURE REVIEW
Brief History:
The necessity of improving the engineering properties of soil has been recognized for as long as construction has existed. Many ancient cultures, including the Chinese, Romans, and Incas, utilized various techniques to improve soil stability, some of which were so effective that many of the buildings and roadways they constructed still exist today. Some are still in use.
In India, the modern era of soil stabilization began during when general shortages of aggregates and petroleum resources forced engineers to consider alternatives to the conventional technique of replacing poor soils at building sites with shipped-in aggregates that possessed more favorable engineering characteristics. Soil stabilization then fell out of favor, mainly due to faulty application techniques and misunderstanding. More recently, soil stabilization has once again become a popular trend as global demand for raw materials, fuel, and infrastructure has increased. This time, however, soil stabilization is benefiting from better research, materials and equipment.
Factors to Be Considered For Selection of an Improvement Technique:
The factors to be considered in the selection of a suitable technique in any case may include: 1) Soil type- Gravel, Silt, Clay etc.
2) Area and depth of treatment required 3) Type of structure and load distribution.
4) Soil Properties- strength, compressibility, permeability etc. 5) Material availability-stone, water, admixture, stabilizer etc. 6) Availability of the equipment
7) Environmental conditions- disposal of waste, erosion, water pollution etc. 8) Economy.
Purpose and Applications:
Traditionally, stable sub-grades, sub-bases and/or bases have been constructed by using selected, well-graded aggregates, making it fairly easy to predict the load-bearing capacity of the constructed layers. By using a selected material, the engineer knows that the foundation will be able to support the design loading.
Essentially, soil stabilization allows engineers to distribute a larger load with less material over a longer life cycle. There are many advantages to soil stabilization which include the following:
Stabilized soil functions as a working platform for the project. Stabilization waterproofs the soil.
Stabilization improves soil strength.
Stabilization helps reduce soil volume change due to temperature or moisture. Stabilization improves soil workability.
Stabilization reduces dust in work environment. Stabilization upgrades weak materials.
Stabilization improves durability. Stabilization dries wet soils.
Stabilization conserves aggregate materials. Stabilization reduces cost.
Soil stabilization is used in many sectors of the construction industry. Roads, parking lots, airport runways, building sites, landfills, and soil remediation all use some form of soil stabilization. Other applications include waterway management, mining, and agriculture.
Work Carried Out By Researchers:
“PROTECTION OF ENVIRONMENT BY THE USE OF FLY ASH IN ROAD CONSTRUCTION” by ESKIOGLOU, Department of Forestry and Natural Environment, and OIKONOMOU, Department of Civil Engineering, Aristotle University of Thessaloniki published in Global NEST Journal, Vol 10, No 1, pp 108- 113, 2008.
The mixture of fly ash with the fine grained soil material, has improved its mechanical properties that are expressed with the Atterberg limits. It resulted in reduction of the moisture content and of the plasticity indicator, up to 34% and 50% respectively (case of CH2 soil), resulting in the soil maintaining stability while increasing the moisture content. When sand-gravels are stabilized, they present a minor increase in relation to curing period, but besides from the 10% of ash, the strength is not considerably increased. Besides this percentage, stabilization is a non-economical operation and has nothing more to offer. “EFFECT OF STONE POWDER AND LIME ON STRENGTH, COMPACTION AND CBR PROPERTIES OF FINE
SOILS” by NABIL AL- JOULANI, Jordan Journal of Civil Engineering, Volume 6, No. 1, 2012- 1 -Palestine Polytechnic University, College of Engineering and Technology.
tests were conducted directly without curing or soaking of the specimens. The results revealed that the addition of 30% stone powder has increased the angle of internal friction (φ) by about 50% and reduced cohesion by about 64%. The addition of 30% of lime has decreased the friction angle and cohesion by 57% and 28%, respectively. The maximum dry density and optimum moisture content decreased lightly by addition of 30% stone powder, however, the addition of 30% lime decreased the maximum dry density and optimum moisture content by 19% and 13.5%, respectively. The CBR values have increased from5.2 to 16 and 18 by the addition of 30% stone powder and lime, respectively.
“STABILIZATION OF EXPANSIVE SOILS USING FLYASH” by S. Bhuvaneshwari, Research Scholar, R. G. Robinson, Assistant Professor and S. R. Gandhi, Professor, Indian Institute of Technology Madras published in Fly Ash India 2005, New Delhi under the programme, Fly Ash Utilization Programme (FAUP), TIFAC, DST, New Delhi.
It concludes that, as the locally available borrow soil has generally high plasticity (LL>50) it was difficult to use it directly for construction. The tests carried out with different proportion of FA indicated that the workability is maximum with 25% FA. Also the dry density observed is maximum for 25% FA. The natural soil used for construction shall be dried with moisture content below 7%. If soil has more moisture it is difficult to mix with FA. Such soil shall be spread on surface and allowed to dry before construction.
“STABILIZATION OF CLAYEY SAND USING FLY ASH MIXED WITH SMALL AMOUNTS OF LIME”, T. Jirathanathaworn ,Ministry of University affairs of Thailand
From his works observed that for both soaked and unsoaked samples, strength significantly increases as stabilizer content increases. Rapid development of strength of improved soil was observed at early curing period perhaps due to hydration reaction among fly ash, lime and water. For long-term strength, it was attributed that pozzolanic reaction occurs which develops the strength continuously.
Dr. K. Subba Rao, Defense Science Organization, Ministry of Defense, New Delhi (Wikipedia), from his studies, “Soil Stabisations”, came to a conclusion that compaction increases the cohesion and internal friction along with the general increase in the dry density of partially saturated soils. Compaction is usually adopted in densifying the subgrades of roads, runways, embankments and is affected by rollers and rammers. For obtaining high density, the soil should be compacted in thin layers. “FLY ASH SOIL STABILIZATION FOR NON-UNIFORM SUB GRADE SOILS” by Research assistant ZACH THOMAS, department of civil engineering, iowa state university,center for transportation research and education, Missouri in Kansas city
From his observations involved an industrial road under lain by clay soils with L.L of 65%, P.I of 43%, and a low CBR value of 3.5.the initial pavement design included 12 inches of full depth asphalt. Howerver, reducing the pavement thickness by improving the sub grade was desired. Laboratory testing using a fly ash content of 15% from haw thorne power station showed decreases in the L.L and P.I to 45% and 18% respectively.
III. EXPERIMENTAL STUDY
This study includes three steps in the course of project include which are as follows:
MATERIALS USED
DETAILED METHODOLOGY
TEST PROCEDURES
Materials Used:
The materials used in the course of project include one type of soil and three different admixtures which are as follows: Red soil, Granite powder (By product in Granite Industry), Fly Ash and Wood Ash
Red Soil
The soil sample used for this study is collected from near lolugu, ponduru mandal, Srikakulam district using the method of disturbed sampling. The preliminary tests for identification of the red soil and the tests for determination of the geotechnical properties of the red soil were carried out. The various properties of red soil are listed
INDEX PROPERTIES coefficient of uniformity, Cu 6.306
Coefficient of curvature, Cc 0.837 Specific gravity 2.55 Field moisture content (%) 20.7 Liquid limit (%) 30.17 Plastic limit(%) 21.4 Plasticity index(%) 8.77 ENGINEERING PROPERTIES Optimum moisture content (%) 12
Maximum dry density (gm/cc) 1.59 CBR- un soaked (%) 0.43
Stone Powder
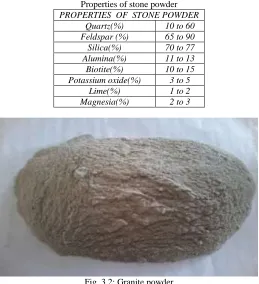
Stone powder, is obtained from a light coloured coarse grained igneous rock consisting mostly of quartz, orthoclase feldspar, mica and sodium – rich plagioclase feldspar. It is formed by the slow and underground cooling of magma. The stone powder is collected from stone crushing plant near narasannapeta.
Table - 3.2 Properties of stone powder PROPERTIES OF STONE POWDER
Quartz(%) 10 to 60
Feldspar (%) 65 to 90
Silica(%) 70 to 77
Alumina(%) 11 to 13
Biotite(%) 10 to 15
Potassium oxide(%) 3 to 5
Lime(%) 1 to 2
Magnesia(%) 2 to 3
Fig. 3.2: Granite powder Fly Ash
Fly ash, a chemical additive consisting mainly of silicon and aluminium compounds, is a by-product of the combustion of coal. Fly ash can be used solely or can be mixed with lime and water to stabilize granular materials with few fines, producing a hard cement-like mass. Its role in the stabilization process is to act as a pozzolan and/or as a filler product to reduce air voids. Because it is essentially a waste product, it can be obtained rather inexpensively. The fly ash used in the project is obtained from the National Thermal Power Corporation, Visakhapatnam
PROPERTIES OF FLY ASH Specific Gravity 2.23
SiO2 (%) 1.91
Al2O3 (%) 55.4
Fe2O3 (%) Nil
CaO (%) 0.31
MgO (%) 0.23
Loss on Ignition (%) 2.3
Wood Ash
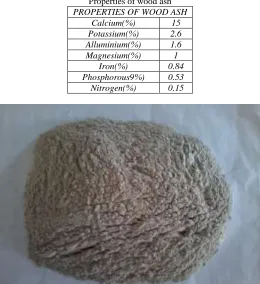
Wood ash, is the organic and in organic residue remaining after combustion of wood. Hard woods generally produce more ash than soft woods. on an average the burning of wood results in 6to 10% of ash. In wood ash calcium is the most abundant element. The composition of wood ash may vary depending up on the geological conditions and industrial processes.
Table - 3.4: Properties of wood ash PROPERTIES OF WOOD ASH
Calcium(%) 15
Potassium(%) 2.6
Alluminium(%) 1.6
Magnesium(%) 1
Iron(%) 0.84
Phosphorous9%) 0.53
Nitrogen(%) 0.15
Fig. 3.4: wood ash
Detailed Methodology
The present study is carried out to check the improvements in the properties of locally available red soil when blende with admixtures like stone powder, fly ash, wood ash in varying percentages.These admixtures are mixed in proportions of 5%,10%,15% to the dry weight of soil individually.
First and foremost, the soils are collected from the areas mentioned earlier by the process of disturbed sampling. The soils are dried for 3-4 days and then grinding is done with the help of a roller.th grinded soils are sieved and laboratory tests are performed to determine the index and engineering properties of conventional soil. Now, the soils is mixed with varying percentages of admixtures to their weights in dry condition thoroughly and uniformly until the colour of the mixtures is uniform and they ar e mixed with in the required water, thereafter tests are performed.
Index properties including grain size distribution, specific gravity, and atterberg limits; engineering properties such as optimum moisture content(OMC), maximum dry density(MDD),CBR, Cohesion and angle of internal friction are studied for stabilized and natural soil. The results obtained for the conventional soil to check the improvements in index and engineering properties.
Test Procedures
Laboratory tests are conducted on unmodified soil and modified soil mixtures. The test procedures include determination of enhancement in characteristics of unmodified soil with reference to the following:
1) Index properties 2) Engineering properties
Determination of Index Properties
a) Determination of Grain Size Distribution
The test is conducted on sandy clay soil. Oven dried soil is taken for conducting the test. 1) Mechanical Sieve Analysis:
Mechanical sieve analysis is conducted according to IS 2720 (part-4)-1985. The test procedure is carried out on oven dried soil. 2) Apparatus:
3) Procedure:
The set of sieves (aperture size of 4.75mm, 2.36mm, 1.18mm, 600µ, 300µ, 150 µ, 75 µ) are arranged in descending order by size of mesh such that the coarse soil at the top and fine at the bottom. Pan is placed at the bottom. Soil sample of weight 1000gm is taken. The soil is poured on to the top sieve and covered with lid. The set of sieves are placed in a sieve shaker and shaked for 15 minutes. The weight of soil retained on each sieve is measured.
4) Calculations:
From the weight retained on each sieve, percentage weight retained, cumulative percentage weight retained and percent finer were calculated.
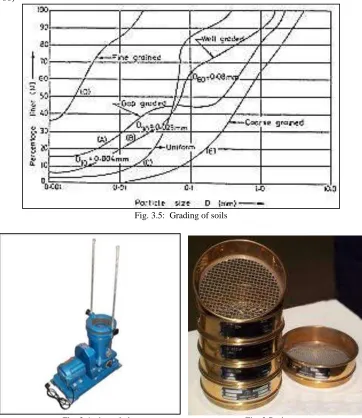
5) Gradation Curve:
A graph with sieve size on X-axis and percentage finer on Y-axis was plotted on the semi log graph sheet. The graph represents gradation curve with D10, D30, and D60 values from which Cu, Cc can be calculated.
Cu= (D60/D30) Cc= (D30²/D10 x D60)
Fig. 3.5: Grading of soils
Fig. 3.6: sieve shaker Fig. 3.7: sieves
Determination of Atterberg’s Limits a) Determination of Liquid Limit:
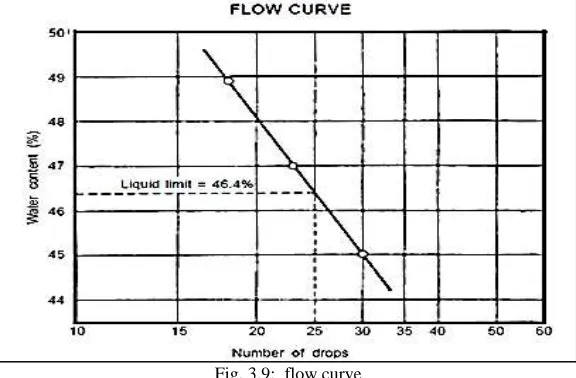
The liquid limit of a soil is the water content at which the soil behaves practically like a liquid, but has a small shear strength.it flows to close(over a distance of about 13mm) the groove (2mm wide) when the cup drops 25 times from a height of 10mm on a hard rubber base in casagrande’s liquid limit device.
As it is difficult to get exactly 25 blows in a test, 3to 4 tests are conducted and the number of blows(N)required in each test is determined. a semi log plot is then drawn between log N and the water content (W).the liquid limit is the water content corresponding to N=25,as obtained from the graph.
Casagrande’s apparatus, B.S-Grooving tool, 425 microns sieve, measuring jar, spatula, weighing balance up to 0.01gm, porcelain mixing bowl, wash bottle, thermostatically controlled oven with temperature range of 0-110ºc.
2) Procedure:
1) An air-dried sample passing through 425microns is collected.
2) 250 grams of the sample soil is taken in a porcelain dish, and water is added approximately to make a paste. 3) The height of fall of the Casagrande’s device cup is adjusted for 10mm using gauge block.
4) The paste is placed in the cup of Casagrande’s apparatus and top surface is smoothened with spatula.
5) A groove using B.S-Grooving tool is made approximately through the center of soil paste in cup. The blow counter is set to zero.
6) Rotating the handle at a rate of two rotations per minute blow is given to the cup until the groove come closer for a length of 13mm.
7) The number of blows are noted from counter and recorded.
8) A sample soil from the cup is kept in the oven for water content determination.
9) Another fresh sample of 100gm passing through the 425 microns is taken and the test is conducted by the addition of higher water content.
10) The sample test is repeated such that the blows were obtained in the range of 10 to 40.
11) Draw the flow curve between log N and W, and determine the liquid limit corresponding to N=25. 3) Graph:
A graph is plotted between the number of blows as abscissa on a logarithmic scale and corresponding water content as ordinate. From the water content corresponding to 25 blows was noted and reported as a liquid limit of soil.
Fig. 3.9: flow curve
b) Plastic Limit Test
The plastic limit of a soil is the water content of the soil below which it ceases to be plastic. It begins to crumble when rolled in to threads of 3mm diameter.
1) Apparatus:
Porcelain evaporating dish about 120mm diameter or a glass plate 450 mm square and 10mm thick, ground glass plate about 200mm×150mm,metallic rod of 3mm diameter and 100 mm length, oven, spatula or plate knife, moisture content can.
2) Procedure:
1) Take about 30 gms of air dried soil from a thoroughly mixed sample of the soil passing 425µm sieve.
2) Mix the soil with distilled water in a evaporating dish or on a glass plate to make it plastic enough to shape in to a small ball. 3) Take about 8g of the plastic soil, and role it with fingers on a glass plate. The rate of rolling should be about 80-90 strokes per minute to form a thread of 3mm diameter counting one stroke when the hand moves forward and backward to the starting point.
4) If the diameter of the thread becomes less than 3mm without cracks, it shows that the water content is more than plastic limit. 5) Knead the soil to reduce the water content and roll it again into thread.
6) Repeat the process of alternate rolling and kneading until the thread crumbles and the soil can no longer be rolled into thread. 7) Collect the pieces of the crumbled soil thread in a moisture content container.
8) Repeat the procedure at least twice more with a fresh sample of plastic soil each time. c) Specific Gravity of Solids by Pycnometer Method
The pycnometer method can be used for determination of the specific gravity of solid particles of both fine grained and coarse grained soils. The specific gravity of solids is determined using the relation:
G= [M2-M1/(M2-M1)-(M3-M4)]
M2= mass of pycnometer with dry soil M3= mass of pycnometer and soil and water M4= mass of pycnometer filled with water only G=specific gravity of solids
1) Apparatus:
Pycnometer of about 1 litre capacity. Weighing balance with an accuracy of 1g and glass rod 2) Procedure:
1) Clean and dry the pycnometer. Tightly screw its cap.
2) Take its mass (M1)to the nearest of 1g. mark the cap and pycnometer with a vertical line parallel to the axis of the pycnometer to ensure that the cap is screwed to the same mark each time.
3) Unscrew the cap and place about 200 g of oven dried soil in the pycnometer. Screw the cap. determine the mass (M2).un screw the cap and add sufficient amount of de-aired water to the pycnometer so as to cover the soil.
4) Screw on the cap. Shake well the contents. Fill the pycnometer with water,about three-fourth full. 5) fll the pycnometer with water completely up to the mark. Take its mass (M3).
6) record the temperature of contents. Empty the pycnometer. Clean it and wipe it dry.
7) fill the pycnometer with water only.screw on the cap up to the mark. wipe it dry. Take its mass (M4)
Fig. 3.11: pycnometer with soil sample
Determination of Engineering Properties
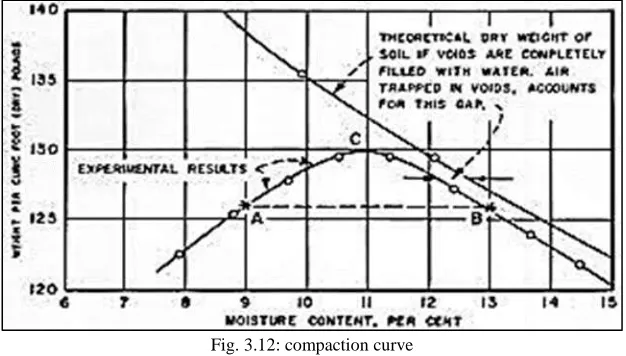
a) Compaction of Soil- Standard Proctor’s Test
Compaction is the process of densification of soil by reducing air voids. The degree of compaction of a given soil is measured in terms of its dry density. The dry density is maximum at the optimum water content. a curve is drawn between the water content and the dry density to obtain the maximum dry density and the optimum water content.
Dry density= M/V(1+W) Where, M= total mass of the soil
V=volume of soil W= water content 1) Apparatus:
Light Compaction Mold of capacity 1000ml, Light Weight Hammer (weight 2.5kg, height of fall 310mm), oven, Digital Weighing Balance, Mixing pans, Trowels, and steel containers, graduated jar, spatula, large mixing tray, collar of 60mm height, IS sieve 4.75mm,desiccators.
2) Procedure:
1) Weight (W1) of empty mould is measured and its volume (V) calculated. The mould is firmly fixed to its base plate and collar is fixed at top of mould.
2) A thin layer of oil applied to inner surface and base plate of the mould.
3) 2kg air dried soil mixture sample passing through 4.75mm sieve is taken. Water of 8% by weight of air dried soil is added and mixed thoroughly.
4) The wet soil is then made in to three parts. The mould is filled in three layers.
5) For the first layer a part of the soil is put in the mould to fill one-third the height of the mould and compacted evenly by ramming it twenty five times with a light weight hammer.
7) The remaining soil is placed in the mould and compacted evenly by ramming it twenty five times with a light weight rammer. 8) The collar is carefully removed; excess soil is trimmed exactly to the top level of the mould.
9) The weight (W2) of mould with soil is taken. A representative soil sample from mould is kept in oven for moisture content determination.
10) A fresh soil of 2kg is taken again and water is added at higher percentage and the process is repeated.
11) The procedure is repeated till a reduction in weight of mould with compacted soil observed for two consecutive trials. Graph: 1) Graph
Graph is plotted with dry density as ordinate and moisture content as abscissa. From the curve optimum moisture content and maximum dry density are reported.
Fig. 3.12: compaction curve
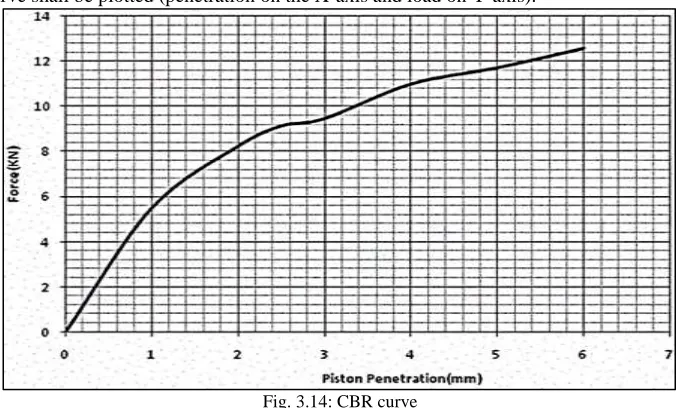
The maximum dry density (MDD) and optimum moisture content (OMC) are determined from the plot. b) California Bearing Ratio Test (CBR)
To determine the California Bearing Ratio Value for the given soil.
It is the ratio of the force per unit area required to penetrate a soil mass with a standard circular piston of 1875mm2, cross sectional area at the rate of 1.25mm/min to that required sample of compacted stone which is defined as having a CBR of 100%. The standard load (PS) corresponding to 2.5mm penetration of the plunger into the standard sample is reported to be 1370 kg a nd for 5mm penetration it was found to be 2055 kg. California Bearing Ratio values are useful in estimating the thickness of flexible pavements. Based on the CBR values of sub-grade and on the traffic volume expected on the road, one can design the thickness of flexible pavement.
1) Apparatus:
CBR machine, cylindrical moulds,-150mm diameter and 175mm height provided with a collar of about 50mm length and detachable perforated base, compaction rammer, surcharge weights-annular weights each of each 2.5kg and 147mm diameter, Is sieve 4.75 mm, coarse filter paper, balance, etc.
2) Procedure:
1) The laboratory CBR apparatus consists of a mould 150 mm diameter with a base plate and a collar, a loading frame and dial gauges for measuring the penetration values and the expansion on soaking.
2) The specimen in the mould is soaked in water for four days and the swelling and water absorption values are noted. The surcharge weight is placed on the top of the specimen in the mould and the assembly is placed under the plunger of the loading frame.
3) Load is applied on the sample by a standard plunger with diameter of 50 mm at the rate of 1.25 mm/min. A load penetration curve is drawn. The load values on standard crushed stones are 1370 kg and 2055 kg at 2.5 mm and 5.0 mm penetrations respectively.
4) CBR value is expressed as a percentage of the actual load causing the penetrations of 2.5 mm or 5.0 mm to the standard loads mentioned above. Therefore
5) Two values of CBR will be obtained. If the value of 2.5 mm is greater than that of 5.0 mm penetration, the former is adopted. 6) If the CBR value obtained from test at 5.0 mm penetration is higher than that 2.5 mm, then the test is to be repeated for
checking.
Fig. 3.13: CBR test
3) Graph:
A load-penetration curve shall be plotted (penetration on the X-axis and load on Y-axis).
Fig. 3.14: CBR curve
c) Un Confined Compressive Strength Test:
This test is used to determine the unconfined compressive strength of the given cohesive soil sample. This is a quick test and the soil specimen is assumed to have no angle of internal friction. There is no change in the water content and volume of the specimen also.
1) Apparatus:
Strain controlled unconfined compression machine, base and a pedestal to mount the specimen, dial gauge for measuring the deformation.
2) Moulded sample
For the desired water content and the dry density, calculate the weight of the dry soil Ws, required for preparing a specimen of 3.8 cm diameter and 7.5 cm long. Add required quantity of water Ww to this soil.
Mix the soil thoroughly with water. Place the wet soil in a tight thick polythene bag in a humidity chamber and place the soil in a constant volume mould, having an internal height of 7.6 cm and internal diameter of 3.8 cm. Place the lubricated moulded with plungers in position in the load frame.
3) Test Procedure
Adjust the center line of the specimen such that the proving ring and the steel ball are in the same line. Fix a dial gauge to measure the vertical compression of the specimen. Adjust the gear position on the load frame to give suitable vertical displacement. Start applying the load and record the readings of the proving ring dial and compression dial for every 5 mm compression. Continue loading till failure is complete. Draw a graph between the vertical compressive stress (on the Y axis) and % axial strain (on the X axis) and obtain the peak point or the stress corresponding to 20% strain whichever occurs first.
4) Calculations:
Determine the undrained cohesion, Cu, from the expression Cu=qu/2, where qu is the unconfined compressive strength of the specimen.
5) Graph:
Fig. 3.15: UCS curve
d) Direct Shear Test:
Shear strength of soil is its maximum resistance to shearing stresses. The shear strength is expressed as S = ć + σ͞ tanφ́
Where ć = effective cohesion σ͞ = effective stress
φ́ = effective angle of shearing resistance
The shear tests can be conducted under three different drainage conditions. The direct shear test is generally conducted on sandy soils as a consolidated drained test.
1) Apparatus:
Shear box, divided in to two halves by a horizontal plane, and fitted with locking and spacing screws; box container to hold the shear box; base plate having cross grooves on its top surface 2 perforated grid plates: loading pad, loading frame, loading yoke, proving ring of capacity 2KN; 2 dial gauges; static or compaction devices; spatula.
2) Procedure:
1) Measure the internal dimensions of the shear box. also determine the average thickness of the grid plates. 2) Fix the upper part of the box to the lower part using the locking screws. Attach the base pate to the lower plate. 3) Place the grid plate in the shear box keeping the serrations of the grid at right angles to the direction of shear. 4) Weigh the shear box with base plate, grid plate and porous stone.
5) Place the soil specimen in the box. Tamp it directly in the shear box at the required density. When the soil in the top half of the shear box is filled up to 10 to 15 mm depth, level the soil surface.
6) Weigh the box with soil specimen.
7) Weigh the box inside the box contained and fix the loading pad on the box. Mount the box contained on the loading frame. 8) Bring the upper half of the box in contact with the proving ring .check the contact by giving a slight movement.
9) Fill the container with water if the soil is to be saturated, otherwise omit this step. 10) Mount loading yoke on the ball paced on the loading pad.
11) Mount the dial gauge on the loading yoke to record the vertical displacement and another dail gauge on the container to record the horizontal displacement.
12) Place the weights on the loading yoke to apply a normal stress of 0.5 kg/cm².allow the sample to consolidate under the applied normal stress. Note the vertical displacement of the dial gauge.
13) Remove the locking screws. Using the spacing screws, raise the upper part slightly above the lower part such that gap is slightly larger than the maximum particle sie.remove the spacing screws.
16) Record the reading of the proving ring, the vertical displacement dial gauge at regular time intervals. Take the first few readings at closer intervals.
17) Continue the test till the specimen fails or till a strain of 20% is reached.
18) At the end of the test, remove the specimen from the box and take a representative sample for water content determination. 19) Repeat the test on identical specimens under a normal stresses of 1 and 1.5 kg/cm²
2) Graph:
Plot the graph between the normal stress as abscissa and shear stress at failure as ordinate.
Fig. 3.17: Direct Shear Curve
IV. RESULTS AND DISCUSSIONS
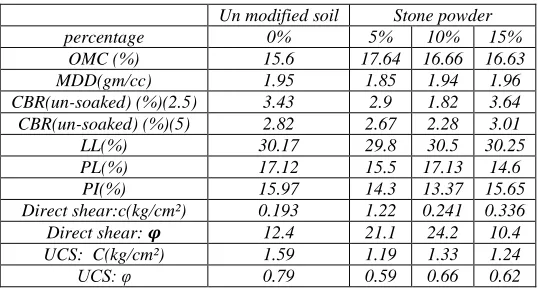
Presentation of Results for Unmodified and Modified Red Soil with Stone Powder:
Table - 5.1
Index and Engineering properties of red soil blended with granite powder
Un modified soil Stone powder
percentage 0% 5% 10% 15%
OMC (%) 15.6 17.64 16.66 16.63
MDD(gm/cc) 1.95 1.85 1.94 1.96
CBR(un-soaked) (%)(2.5) 3.43 2.9 1.82 3.64
CBR(un-soaked) (%)(5) 2.82 2.67 2.28 3.01
LL(%) 30.17 29.8 30.5 30.25
PL(%) 17.12 15.5 17.13 14.6
PI(%) 15.97 14.3 13.37 15.65
Direct shear:c(kg/cm²) 0.193 1.22 0.241 0.336
Direct shear: 𝝋 12.4 21.1 24.2 10.4
UCS: C(kg/cm²) 1.59 1.19 1.33 1.24
UCS: φ 0.79 0.59 0.66 0.62
Presentation of Results for Unmodified and Modified Red Soil with Fly Ash:
Table - 5.2
Index and Engineering properties of red soil blended with fly ash. Un modified soil Fly Ash
Percentage 0% 5% 10% 15%
OMC (%) 15.6 15.5 16.9 17.43
MDD(gm/cc) 1.95 1.93 1.85 1.94
CBR(un-soaked) (%)(2.5) 3.43 3.73 2.7 2.33
CBR(un-soaked) (%)(5) 2.82 4.98 2.9 2.23
LL(%) 30.17 39.5 42 37.5
PL(%) 17.12 15.3 17.6 19
PI(%) 15.97 14.2 24.4 18.5
Direct shear:c(kg/cm²) 0.193 0.296 0.202 0.052
Direct shear: 𝝋(ᵒ) 12.4 11.9 14.9 13.9
UCS: C(kg/cm²) 1.59 1.5 1.72 1.35
Presentation of Results for Unmodified Red Soil and Modified Soil with Wood Ash:
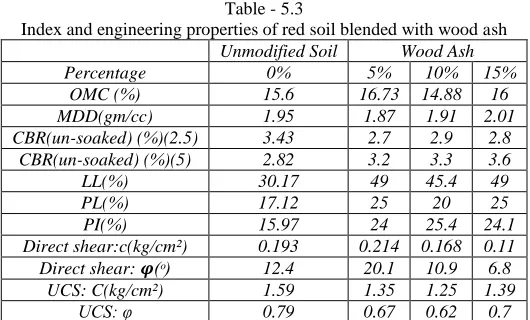
Table - 5.3
Index and engineering properties of red soil blended with wood ash Unmodified Soil Wood Ash
Percentage 0% 5% 10% 15%
OMC (%) 15.6 16.73 14.88 16
MDD(gm/cc) 1.95 1.87 1.91 2.01
CBR(un-soaked) (%)(2.5) 3.43 2.7 2.9 2.8
CBR(un-soaked) (%)(5) 2.82 3.2 3.3 3.6
LL(%) 30.17 49 45.4 49
PL(%) 17.12 25 20 25
PI(%) 15.97 24 25.4 24.1
Direct shear:c(kg/cm²) 0.193 0.214 0.168 0.11
Direct shear: 𝝋(ᵒ) 12.4 20.1 10.9 6.8
UCS: C(kg/cm²) 1.59 1.35 1.25 1.39
UCS: φ 0.79 0.67 0.62 0.7
Naturally available poorly graded red soil is mixed with admixture stone powder at varying percentages to the dry weights of the soil. Experiments are conducted on the samples blended with these admixtures to determine the index and engineering properties of the modified soils.
The variation in the properties of modified soil with stone powder for the red soil are presented as below:
Index Properties:
Grain Size Distribution:
From the results obtained in the sieve analysis of conventional red soil sample, it is concluded that the soil is poorly graded as the Cu and Cc values do not satisfy the criteria for well graded soil. The grain size distribution is presented in figure 4.1
Cu=6.3(Cu> 6 for well graded sand) Cc= 0.84(1<Cc<3 for well graded sand)
Atterberg’s Limits:
The liquid limit and plasticity index of the conventional soil shows that the soil is a clay with intermediate plasticity as per the plasticity chart given in IS: 2720(Pat-5)-1985. The liquid limit graph is presented in figure 4.2
Liquid limit=30.17% Plastic limit=17.2% Plasticity index=15.97%
It is observed that the liquid limit is gradually decreases and then increases in the percentages of granite powder. In fly ash and wood ash the liquid limit is increases in the percentages.
The plastic limit in the granite powder and fly ash is gradually decreases and then increases and in wood ash the plastic limit is gradually increases.
Engineering Properties:
Moisture Density Relationship:
The OMC is gradually increase and then decreases for granite powder and wood ash in the varying percentages. And in fly ash gradually decreases and then increases.
The MDD is for all the three admixtures is gradually decrease and increases later after increases its percentage. CBR Test Results:
The CBR values are decreases gradually and later increases for granite powder and the CBR value obtained is 3.64% for 15% granite powder.
The CBR values are gradually decreases for wood ash and for fly ash first increases and later it will be decreases. Strength Parameters from Direct Shear Test:
The strength parameter cohesion (c) is increased initially and later decreases with increasing percentages of granite powder, fly ash, wood ash.
Another parameter angle of internal friction (φ) is gradually increases for granite powder and wood ash. And for fly ash initially decreases and then increases.
Strength Parameters from UCS:
There is a constant decrease in the values of unconfined compressive strength.(qu) is gradually decreases for granite powder and wood ash. And for fly decreases up to 5% and then increases and later decreases.
Grain Size Analysis (As per IS 2720 (part IV)-1985
Fig. 5.1: Grain Size Distribution curve for Unmodified Red Soil
Test Results for Atterberg’s Limits
(As per IS: 2720(PART V)-1985)
Fig. 5.2: Liquid Limit for Unmodified Red Soil
Fig. 5.4: Liquid Limit for Red Soi l+ 10% granite powder
Fig. 5.5: Liquid Limit for red soil +15% Stone Powder
Fig. 5.7: Liquid Limit for Red Soil + 10% Fly Ash
Fig. 5.8: Liquid Limit for Red Soil + 15% Fly Ash
V. CONCLUSIONS
Conclusions that are drawn from the course of study are the following:
The OMC is increases initially and then decreases later for varying percentages of wood ash and granite powder. The OMC at 15% 0f granite powder is the maximum OMC (16.5%)
The MDD is gradually decrease and then laterally increases for granite powder and wood ash. And gradually decreases for wood ash. The maximum MDD is at 1.96g/cc at 15% granite powder.
The CBR values are optimum for 5% replacement of soil with fly ash i,e C value at 2.5 is 3.73% and c value at 5mm is 4.98. The liquid limit is decreases gradually and then increases for granite powder and gradually increases for fly ash and wood
ash.and maximum value obtained at 15% of wood ash.
The plasticity is initially decreases for granite powder and fly ash and later increases and for wood ash the plasticity is gradually increases and maximum value obtained at 5% replacement of soil with wood ash.
The plasticity index decrease for granite powder and increases for fly ash and wood ash. Maximum value is 25.4% obtained at 10% of replacement of soil with wood ash.
The unsoaked CBR values are decreases for granite powder and wood ash and increases for fly ash. And optimum values are 3.73 and 4.98 for 2.5mm and 5mm penitration obtained at 5% of flyash.
The UCS values for qu is decreases for granite powder and wood ash and gradually decrease and later increases for fly ash. The optimum value is 1.72 obtained at 10% flyash.
The c value is decreases for granite powder and wood ash and gradually decreases and then increases and later increases. The optimum value is o.86 kg/cm² for 10% fly ash.
REFERENCES
[1] “Use of Oils and Phosphates in Soil Stabilization”, Praveen Kumar & Gaurav Pandey (Indian Highways, May 2009)
[2] Gidigasu M. D., (1976), “Laterite Soil Engineering Pedogenesis and Engineering Principles”, Elsevier Scientific Publication Company, Amsterdam, pp. 444 – 482, 1976.
[3] Osula D. O. A.(1984), “Cement stabilization using hydrated lime as an admixture”,Thesis Civil Engineering Department Ahmadu Bello University Zaria, 1984.
[4] Joel, M (2006): “Response of Igumale Shale to chemical Stabilization for Road Work”. (PhD Thesis, Civil Eng Dept., UNN, Enugu State). [5] Manning, D. (2004). “Exploitation and Use of granite powder”. Manchester: Mineral Solutions. Report No. 087/MIST2/DACM/01. [6] Rockliff, D. (1996). “Low-grade quarry products, reclaimed aggregates and inert wastes.
[7] D.I. Boardman, S. Glendinning, and C.D.F. Rogers, “Development of Stabilization and Solidification in Lime-Clay Mixes”, Geotechnique, pp. 533-544, 2001.