ISSN (Online): 2320-9364, ISSN (Print): 2320-9356
www.ijres.org Volume 6 Issue 8 Ver. II ǁ 2018 ǁ PP. 36-44
Production Of Biomethane From Landfills
Udeh Sunday,
Nwangwu Florence C.
Department Of Chemical Engineering Institute of Management & Technology Enugu, Nigeria. Department Of Chemical Engineering Institute of Management & Technology Enugu, Nigeria
Corresponding Author: Udeh Sunday
ABSTRACT: Studies were carried out on the production of Biogas from organic by- products or organic wastes, in particular cow dung and poultry droppings for domestic and lighting at household level. The laboratory work was done at the energy centre of the University of Nigeria, Nsukka. As contained on tables 3.1 and 3.2(A-C), the materials used has high energy values of 18.303kJ/KJ and 15,214KJ/KJ for the pig dung and poultry droppings respectively. The total solids were less than 20%, hence the choice of the wet digestion process. Daily production results given on table 3.3A showed that the microbial activities were at their picks at
between 35-40OC and within a pH range of 5.7-7.9, at these values the biogas production were high as
presented on table 3.3 (B-E). The biogas produced showed a high percentage of methane-99.998% and 96% for pig dung (sample A) and poultry droppings (sample B) respectively. The gas biogas/biomethane burns with clean, smoke-free blue flame, it has no odour and it is colourless
KEYWORDS: bioconversion, sustainability, global-warming, deforestation, biomass.
--- --- Date of Submission:05-11-2018 Date of acceptance:19-11-2018 --- ---
I.
INTRODUCTIONBiomethane/Biogas or Landfill gas or Biogenic methane (Biomethane) is one of the hydrocarbon gases being allowed into the atmosphere consciously and unconsciously. Landfills according to Statistics constitute the third largest source of human-related methane emissions in the United State according to American Fire protection agency).[1] In the third world, this figure is expected to be higher.
Biomethane/Biogas is a product of decomposing organic matter, such as sewage, animal byproducts, and agricultural, industrial and municipal wastes. These wastes as they may be seen or called are the necessary raw materials for this work. These byproducts/wastes are in uncontrollable quantities in our environment today, in particular in the third world countries, developing nations and of course in developed countries.
In the rural communities and urban areas in Nigeria today, these byproducts are becoming very unhealthy and gulps huge sums of the Government budget for their collection and disposal. This project has the intension of making use of these wastes/byproducts in the production of Biomethane-cleaned and upgraded to standard, compressed and dispensed for domestic heating and lighting purposes.
On a work by eminent scholars on organic fertilizer from Agricultural wastes/Byproducts it was noted that one of the side attractions in the project was the large amount of gas released which if not properly handled goes to contribute to ozone layer depletion[2]. One therefore notes that the greatest side attraction of this project is the huge quantities of organic solids left which can be modified to give an efficient organic fertilizer required to replace the artificial/inorganic fertilizers in present use which has caused and is still causing irreversible damages to the soil and a major source of water pollution.
Today many nations boast of quantities of crude oil and natural gas reserves; these reserves cannot last infinitum; hence many states among the developing and the developed nations have gone some steps further in harnessing this alternative energy source-Biogas, not only for domestic heating and lighting but also to generate electricity and used as automobile fuels.
According to Natural Gas Vehicle Agency (NGVA), about 60% of the gas used in Sweden’s 38,000 natural gas vehicles is renewable natural gas (RNG). In Germany, 25% of the public compressed natural gas stations dispense 100% RNG. In USA, Biomethane vehicles, even though still in small scale is fast growing[3].
For some time now, there has been international outcry on global warming arising from Ozone layer depletion due to greenhouse gases (from industrial and domestic activities) being allowed into the atmosphere. The level of effect of global warming on sea level, and weather deserves everybody’s attention and interest. The success of this research work will also significantly reduce, the level of greenhouse gases being emitted from our environment into the atmosphere.
air and rain. Under this condition, mixtures of different gases result from the action of natural microbial flora on the biomass. Landfill gas is about sixty percent (60%) methane; with Carbon IV oxide-CO2 and trace amounts
of water Vapour (less than one percent) constituting the remainder [4,17]
Landfills to energy [Biogas] are a win-win exercise, as a sustainable waste management system, it produces energy that can be sold for economic gains for the producer, it also provides green jobs. Most cities in Africa use landfill waste disposal system but the problems inherent is that the wastes were never sorted; with proper education and enlightenment, the general public could be made to sort wastes at household levels for better utility.
High interest in anaerobic digestion was sparked off by the energy crises in the 1970s and hence anaerobic digesters are now commonly found alongside farms to reduce nitrogen run-off from manure, waste water treatment facilities and to reduce sludge disposal cost [6].Many scholars have worked on the extraction of methane from cow dung, plants byproducts, poultry droppings, goat and sheep dung, and waste water [7,8,9].
History had it that biogas production and use started in Assyria since 10th Century BC in NEPAL, the first Biogas digester was in 1955[11] by Father BR Saubolle and by 1975 the attention of NEPAL government into Biogas technology started, which saw the launching of the first Biogas promotion by a government agency and in 1992 the government of Nether lands initiated the Biogas Support Programme (BSP)
In 1920s, several designs of Biogas plants for sewage water fermentation started and in 1938 the first biogas plant for solid waste fermentation was developed by Issman and Duseller in Algeria [11]
Appropriate Rural Technology Institute ARTI- developed the ARTI compact biogas plant in 2003 for the treatment of organic waste at household level. The plant is sufficiently compact to be used in urban and rural households; about 2000 of such plants are presently in use in India applying wet digestion process. [13]
1.1 Prospects Of Waste-To- Energy In Africa
Production of energy from landfill requires certain technical skill which can only be acquired through training (formal or informal) and by experience, Methane is a potent heat-trapping gas, more than twenty (20) times stronger than carbon IV oxide and has a short atmospheric life [5],therefore reducing methane emission from municipal solid wastes through landfill gas project is one of the sustainable means to reduce the human impact on global climate change.
Waste management in Africa is critical issue which must be tackled by the government at all levels. The mountains of these dumps in our urban cities as a result of increased activities caused by urban migration is causing a great concern to issue of health due to mosquitoes breading, emission of obnoxious odours, landfill gas and flooding due to blocked water ways. One is right to say that waste management is a complex issue that must involve contributions from a number of stakeholders from local communities to policy makers including industries and households; for success to be achieved policy framework on agro processing level at farm stead is a choice in reducing mountains of refuse in our cities.
1.2 Anaerobic digestion processes:
The conventional digesters apply wet digestion process with total solid of less than 20% (Ts<20) this process has the advantages of: Providing good fluidity of the slurries and optimal contact of the micro-organisms and the waste.
- The new technology apply dry digestion with total solid more than twenty percent (Ts>20%) this process allows high yields using small space [13].
In all, mesophilic digestion is more stable even though its yields are low comparatively. Thermophilic processes produce more biogas at shorter time but require input energy and bear the risk of production of toxic ammonia [13].
Digestion process:
The digestion process of organic waste substances involve four steps, these includes:
Step 1:Hydrolysis: here large-molecule organic compounds with complex structure typically found in waste, including protein, carbohydrate and fat compounds will be decomposed into simpler molecules with structure that is soluble in water. The catalyst used in this process of decomposition is acid-forming bacteria
Step 2:The small-molecule organic compound obtained in the first stage is further digested into yet smaller molecules by the process of Acidogensis. Small-molecule organic acids such as Volatile Fatty Acids (VFA), Ethanol, Hydrogen, Propanoic acid, carbon IV oxide, Ammonia and hydrogen sulphide, are the products of this process.
Step 4:The Acetic acid, CO2 and Hydrogen from Acetogensis is acted upon by methane-forming bacteria. These
molecules are converted to methane through the process of Methanogensis. Here, two forms of methane formation processed are involved: first, the acetic acid is converted into methane, accounting to over seventy percent of methane generation in methanogensis and secondly the carbon IV oxide and hydrogen reacts to form methane [10]
CH3COOH methanogensis CH4 + CO2
Acetic acid methane carbon IV oxide
CO2 + H2 methanogensis CH4 + H20
Carbon IV oxide Hydrogen methane water vapour
In all, 1m3 of Biogas comprising 60% of methane, with heating value of approximately 21megjoules ≡ 0.5litres of diesel oil ≡ 0.57 litre
Of gasoline ≡ 55litre of fuel oil ≡ 1.2KW.H of
Electricity ≡ 0.45kg of LPG ≡ 1.5kg of firewood [10] is produced.
1.3 Characterization Of Biogas
Biogas analysis is based on the determination of biogas quality as the variation of methane, carbon IV oxide and contamination components compositions measured using an optical gas analyzer or wet method.
The composition of biogas is typically 40-60 percent methane, 40-50 percent carbon IV oxide, and the remainder being water vapour, hydrogen sulphide and other impurities depending on the type and source of waste, what the biogas is being purified for [14].Effective measurement of biogas composition is a critical step to ensure a high quality product and to reduce the risk of corrosion and dangerous toxic gas leak. The gas chromatograph in an important analyzer in biogas processing.
1.4 Objectives And Scope
The technology profile of the Nigerian economy is characterized by over dependency on oil and gas (petroleum and liquid natural gas (LNG); with oil and gas accounting for more than 90% of foreign earnings, one stops to wonder what happens to our national revenue if there is a downward trend in the quantities and cost of the products in the international market as presently being experienced, (from about $120/barrel to less than #50/barrel as at 15/12/2016).
This project will definitely help our government to diversify her economic base, cut public spending in refuse collection and disposal and channel her resources to other areas of need.
By the time the nation starts making use of refuse of all forms in particular biodegradables; thus agricultural byproducts, domestic and industrial wastes, waste-water and sewage for purposes of generating Biogas; a good environmental impact will be created, as the aesthesy of our cities and villages will be more friendly and healthier; carbon emissions from these wastes/byproducts will be a thing of the past.
Definitely, this work will produce a cheap/affordable and sustainable energy for heating and lighting; and possibly upgraded as far as our lean resources could carry.
As part of the mission of this project; jobs will be made available for our teaming unemployed graduates, emission of greenhouse gases will be significantly reduced and hence reduction in global warming.
II.
EXPERIMENTAL (MATERIALS AND METHOD)Pig dung and poultry droppings collected from a farm in Nsukka, Enugu State, Nigeria were used.The experiment was performed at the Energy Centre, University of Nigerian Nsukka (UNN);Each of the wastes were charged into 32 litre capacity locally fabricated digesters respectively; the digesters were charged up to 75% level in the ratio of 25% waste to 50% water (1:2) leaving the remaining 25% as gas space. The digesters were charged with 12litres of water and the wastes used to top them up to 24litres respectively. The materials were thoroughly mixed and the initial pH and ambient, and slurry temperatures recorded.
The pH, pressure, temperatures changes and the volume of gas generated were taken at regular intervals from each of the digesters to follow up the gas generation processes. It should be noted from the onset that only the native microbial flora were used through the period of the experiment.
The following analysis was carried out to follow up the process of microbial activities during the bioconversion period: total volatile solids-Tvs, Biochemical oxygen demand-BOD, chemical oxygen demand COD, and Total Viable Count-TVC. The raw materials used were analysed for energy values, crude protein, moisture and ash contents, crude fat, crude fibre and carbon content.
Pressurized water washing/scrubbing (PWS) were used for the biogas upgrading process.
III.
RESULTS AND DISCUSSIONtemperature changes with time were also monitored (see table 3.4). it should be noted that through the period the work lasted, the bioconversion were conducted under ambient temperature conditions with resultant variation in hydrogen-ion-index as a result of the activities of native microbial flora, and slurry temperatures recorded (table 3.4).
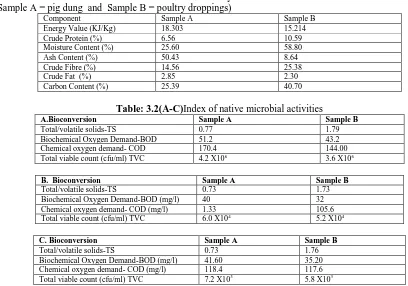
Table 3.1 Raw Material Analysis before Bioconversion (Sample A = pig dung and Sample B = poultry droppings)
Component Sample A Sample B
Energy Value (KJ/Kg) 18.303 15.214
Crude Protein (%) 6.56 10.59
Moisture Content (%) 25.60 58.80
Ash Content (%) 50.43 8.64
Crude Fibre (%) 14.56 25.38
Crude Fat (%) 2.85 2.30
Carbon Content (%) 25.39 40.70
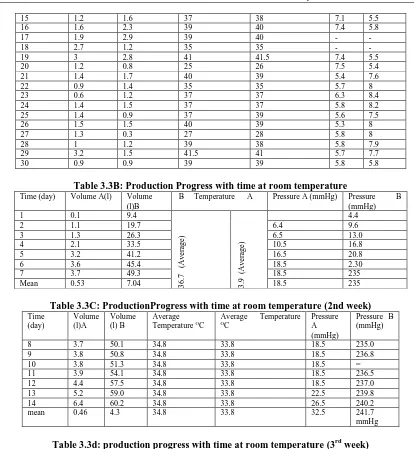
Table: 3.2(A-C)Index of native microbial activities
A.Bioconversion Sample A Sample B
Total/volatile solids-TS 0.77 1.79
Biochemical Oxygen Demand-BOD 51.2 43.2
Chemical oxygen demand- COD 170.4 144.00
Total viable count (cfu/ml) TVC 4.2 X10⁶ 3.6 X10⁶
B. Bioconversion Sample A Sample B
Total/volatile solids-TS 0.73 1.73
Biochemical Oxygen Demand-BOD (mg/l) 40 32
Chemical oxygen demand- COD (mg/l) 1.33 105.6
Total viable count (cfu/ml) TVC 6.0 X10⁴ 5.2 X10⁴
C. Bioconversion Sample A Sample B
Total/volatile solids-TS 0.73 1.76
Biochemical Oxygen Demand-BOD (mg/l) 41.60 35.20
Chemical oxygen demand- COD (mg/l) 118.4 117.6
Total viable count (cfu/ml) TVC 7.2 X10³ 5.8 X10³
3.1 Raw Materials and Product Analysis
The raw materials used (pig dung and poultry droppings) were analyzed/ characterized with the following indices- total volatile solids-Ts, Biochemical oxygen demand, chemical oxygen demand, Total Viable Count (TVC) (tables 3.2A-C) these indices were used to monitor the activities of the microorganism through the bioconversion period. The energy values, ash, moisture and carbon contents, crude fat and crude fibre were also evaluated at the start of the bioconversion process (Table 3.1). These indices were necessary when making choice of the bio-digestion method to be employed, the volume of the biogas per unit time expected and the viability, or otherwise of the microbes used.
The overall record of bioconversion result were as contained on table 3.3A- (Daily production of Biogas at Temperature and pH). The results were divided into four approximately equal parts (four weeks) tables 3.3 (B-E) and the cumulative volume for each week was evaluated at the given conditions of temperatures and pH.
Table 3.3A: Daily production of biogas at varying weather condition. Time (Days) Volume A Volume B Temperature
A
Temperature B pHA pHB
1 0.1 9.4 37 36.5 6.9 6.2
2 1 10.3 40 41 6.3 6.2
3 0.2 6.6 36 36 - -
4 0.8 7.2 41 42 - -
5 1.1 7.7 41.5 41.5 7.6 6.4
6 0.4 4.2 35 35 7.8 5.5
7 0.1 3.9 27 41 7.9 5.7
8 0 0.8 31 31 7.3 5.4
9 0.1 0.7 35 35 7.7 5.4
10 0 0.5 28 29 - -
11 0 2.7 37 38 - -
12 0.1 0.4 33 33 6.6 5.4
13 0.5 1.5 37 37 6.5 5.5
15 1.2 1.6 37 38 7.1 5.5
16 1.6 2.3 39 40 7.4 5.8
17 1.9 2.9 39 40 - -
18 2.7 1.2 35 35 - -
19 3 2.8 41 41.5 7.4 5.5
20 1.2 0.8 25 26 7.5 5.4
21 1.4 1.7 40 39 5.4 7.6
22 0.9 1.4 35 35 5.7 8
23 0.6 1.2 37 37 6.3 8.4
24 1.4 1.5 37 37 5.8 8.2
25 1.4 0.9 37 39 5.6 7.5
26 1.5 1.5 40 39 5.3 8
27 1.3 0.3 27 28 5.8 8
28 1 1.2 39 38 5.8 7.9
29 3.2 1.5 41.5 41 5.7 7.7
30 0.9 0.9 39 39 5.8 5.8
Table 3.3B: Production Progress with time at room temperature
Time (day) Volume A(l) Volume
(l)B
B Temperature A Pressure A (mmHg) Pressure B
(mmHg)
1 0.1 9.4
3 6 .7 ( A v er ag e) 3 .9 (A v er ag e) 4.4
2 1.1 19.7 6.4 9.6
3 1.3 26.3 6.5 13.0
4 2.1 33.5 10.5 16.8
5 3.2 41.2 16.5 20.8
6 3.6 45.4 18.5 2.30
7 3.7 49.3 18.5 235
Mean 0.53 7.04 18.5 235
Table 3.3C: ProductionProgress with time at room temperature (2nd week)
Time (day) Volume (l)A Volume (l) B Average Temperature OC
Average Temperature
OC
Pressure A (mmHg)
Pressure B (mmHg)
8 3.7 50.1 34.8 33.8 18.5 235.0
9 3.8 50.8 34.8 33.8 18.5 236.8
10 3.8 51.3 34.8 33.8 18.5 =
11 3.9 54.1 34.8 33.8 18.5 236.5
12 4.4 57.5 34.8 33.8 18.5 237.0
13 5.2 59.0 34.8 33.8 22.5 239.8
14 6.4 60.2 34.8 33.8 26.5 240.2
mean 0.46 4.3 34.8 33.8 32.5 241.7
mmHg
Table 3.3d: production progress with time at room temperature (3rd week)
Time (day) Volume A(l) Volume (l)B
Temperature OC A B
Pressure A
(mmHg)
Pressure B
(mmHg)
15 6.4 61.8
3 6 .6 ( av er ag e) 3 6 .8 ( av er ag e)
37.5 243.3
16 8.0 64.1 47.5 245.6
17 9.9 67.0 61.5 248.5
18 12.6 68.2 77.5 249.7
19 15.6 71.0 86.5 252.5
20 16.8 71.8 96.5 253.3
21 18.2 73.5 102.5 255.0
mean 0.87 3.5 102.5 255.0
Table 3.3E: Progress of Production with Time at Room Temperature (4th week)
Time (day) Volume A(l) Volume (l)B Temperature OC
A B
Pressure A
(mmHg)
Pressure B
(mmHg)
22 19.1 74.9
3 7 .1 ( A v er ag e) 3 6 .8 (A v er ag e)
43.5 265.5
23 19.6 76.1 47.5 271.5
24 21 77.6 57.5 281.5
25 22.4 78.5 67.5 283.5
26 23.9 80 - 291.5
27 25.1 80.3 - 301.5
28 26.1 81.5 77.5 306.5
29 29.3 83 85.5 -
30 30.2 83.9 92.5 -
3.2 The Progress of Production with Time at Room Temperature and pH
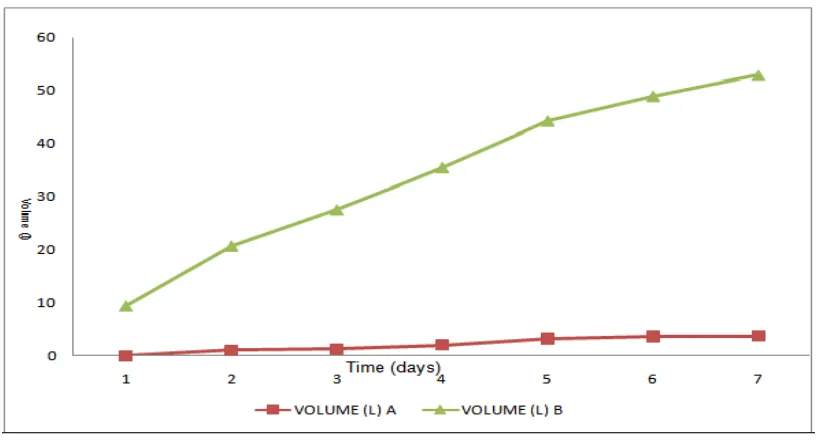
The progress of production was measured by the daily report of volume produced over a period of thirty (30) days (table 3.3A). The first seven days gave an encouraging harvest of biogas as shown in the cumulative volume report on table 3.3B. The progress of biodigestion was monitored by the variation of volume with time at the slurry temperature and pH as shown in Figure 3.1. The result of this figure show a rapid volume increase of biogas report for this batch (first seven days) in particular, the biogas from poultry droppings which gave an average daily production of 7.04litres as against that of pig dung with average daily production of 0.53litres within the same period. (Figure 3.1 and table 3.3B)
Figure 3.1:Variation of Product Volume - Cumulative with Time at Room Temperature and Atmospheric Pressure (First Week)
Figure 3.2:Variation of Production Volume – Cumulative with Time at Room Temperature and Atmospheric Pressure (2nd Week)
Table 3.3C Presents the progress of biogas production in the second batch (second week) in the same biodigestion process. The result here gave an average volume of biogas produced from the pig dung and poultry droppings as 0.46litres and 4.3litres respectively. This shows a drop in production volume by about 13.2% and 38.9% for pig dung and poultry droppings respectively.
Figure 3.2 still presented a sluggish biodigestion results with pig dung and even marginal decline in production level with poultry droppings.
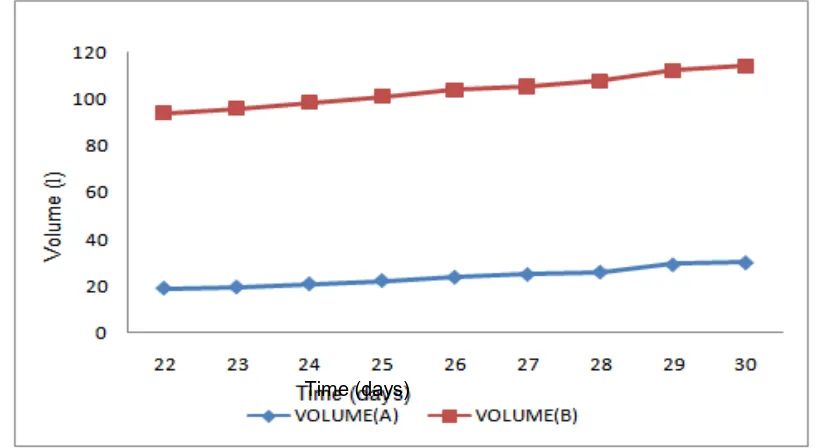
In the third and fourth weeks of laboratory work, there were changes in the production profile as shown on table 3.3C with the pig dung given an average biogas of 0.87 litres/day and the poultry droppings 3.5 litres/day these present an increase by 89% of average biogas/day for the pig dung while the poultry droppings continued to decline in volume produced, by 18.6% in the third week and further decreased by 20% in the final week of laboratory work. The pig dung, even though with low daily production rate shows consistency in daily average increases while the biogas production from poultry droppings declined all through the production period. The facts were presented in tables 3.3(D-E) and figures (3.3 and 3.4)
Figure 3.3:Variation Of Production Volume – Cumulative with Time at Room Temperature and Atmospheric Pressure (3rdWeek).
Figure 3.4:Variation of Production Volume - Cumulativewith Time at Room Temperature and Atmospheric Pressure (4th Week).
Table 3.4:A Gas Analysis Before And After Upgrading Before Upgrading
Component Sample A (%) Sample B (%)
CO 0.001 0.0025
CO2 17 17
H2O (vapour) = =
Biomethane 83 83
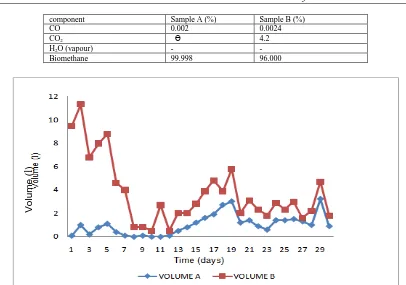
component Sample A (%) Sample B (%)
CO 0.002 0.0024
CO2 ϴ 4.2
H2O (vapour) - -
Biomethane 99.998 96.000
Figure 3.5: Daily production variation at varying weather condition through the period.
3.3 Effect of Weather Conditions onthe Observed Result
Figure 3.5 and table 3.3A give an overview of the effect of weather conditions, in particular temperature variation within the period of process evaluation.From figure 3.5, the peaks of biogas production in both samples seem to have been within the temperature ranges of 35-41OC this is in consonance with the work of some eminent scholars who stated that the temperature range of (29-41)OCfavours rapid production of biogas from biomass but for stable and continues production, the range 32-35OC becomes more favourable [16]. Also the enhanced production witnessed in the third and fourth weeks for biogas from cow dung may be attributed to the temperature ranges of (25-39)OC which was prominent within these periods (figure 3.5 and table 3.3A). The picture is made clearer with the analyses shown in tables 3.3D and 3.3E where the mean/average daily production rose by 89% and 16% for cow dung in the third and fourth weeks of the laboratory study.
3.4 Effect of Biomass Composition on Biogas Production Volume
Table 3.1 presents the biomass characterization in terms of Energy value, moisture, ash and carbon contents. The energy values of the two samples are notably high but the gap between the initial moisture contents of the two samples might have contributed to the rapid production of gas by sample B (poultry droppings) because one could reason that because of the high moisture content of this sample, most of the native microbes were alive and active from the onset comparatively.
The BOD and COD levels decreased with biodigestion, these characterized the effluent organics and the level of biodegradation, as the biodegradable fractions of the COD were converted to methane.
3.5 Variation of pH With Time
One observed from table 3.3A, that the pH range through the biodigestion period were in the range of 5.7-7.9. These variations as noted were probably due to microbial activities during the period. Within the last week of conversion process, the pH range was 5.7-5.8 which means that methanogenic bacteria inhibition has set in (at pH<6.2) [16] as a result the observed decreased biodigestion (table 3.3E & figure 3.4) result was expected.
3.6 Biogas Analysis
Tables 3.4 (A&B) present the composition of the Biogas before and after upgrading. Table 3.4A shows that one can obtain straight run biogas up to 83% before upgrading-against theoretical prediction of about sixty percent (60%) [4, 17]. This is not unexpected, because this value can be influenced by some factors including source of raw materials, the clony of methanogens and other microbial flora and their growth during the bioconversion process, some climatic conditions including temperature and pressure and the pH of the raw
V
ol
um
e (
l
materials might have played some role on the end quality of biogas. One may not rule out the influence of the equipment used for the analysis, but the conviction of the result was that the gas burns with a good blue flame even before the upgrade. The results after scrubbing were well over ninety percent methane content as presented on the table 3.4B. Bacharach-PCAS analyzer was used for the analysis.
IV.
CONCLUSION AND RECOMMENDATIONThe results of the research work confirmed that the process of bioconversion of organic waste to biogas is simple, cheap, affordable and assessable. The rural community can find it a fun using their agricultural by products, which before now were seen as waste and harmful, to produce biogas for use to heat, cook and light their homes and more so use the slurry by product to enhance their soil fertility.
By the time this project is encouraged by the government at all levels; the economy of such a state will definitely change for better, instead of such government paying for waste collection and disposal, she now employs people to use such wastes and generate money. The generated household and farm wastes now generate energy, improves economy of the people and that of the government, keeps our homes, communities and cities clean, healthier and lively.
The government is advised to channel her resources along this line to generate more wealth and help her citizenry. This project work also advices that the people should be educated in the area of waste sorting and management to assist any venturing into biogas production. This is another area, our government can diversify her economic base to avert the type of trauma the nation undergoes with a downward trend in the prices of petroleum and petroleum products in the international market. The crude oil reserve is exhaustible and there can be a blackout in the petroleum industry but wastes are inexhaustible and hence can give energy through biogas which is not only cheap and affordable but also sustainable.
The government is advised to equip our research centres and institutes with the needed equipment and materials to enhance the progress of research work and results that are feasible and acceptable globally.
Future works on this project will be centered on the effect of variables on the biogas production with a view to establish process conditions and variables that could enhance not only household production of biogas but also to assist any who wishes to commercially venture into the project.
COURTESY: TEDFUND NIGERIA
REFERENCE
[1]. American Fire Technologies AFT.net (www.AFT.net).
[2]. Udeh, S. and Prof. Ekumankama E.O.(2018).Effects of Process Condition on the Bio-Digestion of Cow Dung for Organic Fertilizer
Production. American journal of Chemical Engineering. Vol. 6, No. 5, pp. 99-106. doi: 10.11648/j.ajche.20180605.14
[3]. Natural gas vehicles - Wikipedia (en.m.wikipedia.org)
[4]. En.wikipedia.org/wiki/biogas
[5]. Waste Management/African cities, Ghana.
[6]. Klinkner, B.A. (2014) Anaerobic digestin as a renewable energy source and waste management technology (Umass Law review 9,
79).
[7]. Balogh, E. (1978) “Review of alternative technologies of the future fuels from biomass” Pro of Nigeria Institute of Management
and Technology 2,106-115.
[8]. Adeniran, A.K; Ahaneku I.E, Ilodo J.N and Rohjy, H.A. “Relative effectiveness of biogas production using poultry waste and cow
dung. Eng. Int. CIGR Journal 16(1) 126-132.
[9]. Jha, A.K. Barri Q, Zhang; Zhao B (2012) “ADry anaerobic digestion of cow dung for methane production: effect of mixing, Pak J
Boil Sc, 15(23)111-118.
[10]. Dept. of alternative energy, Development and Efficiency DEDE (2010) origin of biogas Bangkok, Thailand.
[11]. Bond, T. (2011) “History and future of domestic biogas in the developing world”. (www.sciencedirect.com).
[12]. History of biogas technologies (www.fluid.biogas.com)
[13]. Anaerobic digestion of organic waste www.sswm.info.
[14]. Roubik, H. (2018) “Biogas quality acroee small-scale Biogas plants” (www.mdpi.com).
[15]. Planet Natural Resource Center. “Carbon to Nitrogen ratio www.planetnatural.com.
[16]. Bakei, et. al. (2004). “Empirical study of factors affecting biogas production” college of engineering science and technology; Fiji
National University.
[17]. Weben.dede.gr.ch (2012). “Origin of biogas, department of alternative energy development efficiency”.