e- ISSN: 2278-067X, p-ISSN: 2278-800X, www.ijerd.com
Volume 15, Issue 1 (January 2019), PP.87-91
A Comparative Study of Dimension-Reduction Based on Data
Distribution
Yahui Ma
1, Cuixia Miao
1,#, Lu Tan
21School of Mathematical Sciences, Qufu Normal University, Qufu, Shandong,
273165, P.R China
2Dept of Statistics and Mathematics of Shandong University of finance, Jinan, Shandong,
250014 P.R China, Corresponding Author:Cuixia Miao
ABSTRACT: We propose the notions of explanation-radius and the local-comparability based on thedata distribution. The former measures the injective degree and the latter depicts the difference between the original data and the reduction data. Thereafter, through the experiments, the linear and nonlinear dimension-reduction are analyzed, included PCA (Principal Component Analysis), PP (Projection Pursuit) and LLE (Locally Linear Embedding), Laplacion Eigenmap. The experiments show the effectiveness and advantages of the researches.
---
Date of Submission: 02-04-2019 Date of acceptance: 18-04-2019
---I.
INTRODUCTION
High-dimensional data, such as aerospace remote sensing data, biological data, network dataand financial market transaction data, etc, the dealing with of which are faced with two problems: one is the problem of dimension disasterDonoho et al. (2000) (curses of dimension), and dimensional expansion brings great challenges to pattern recognition and rule discovery in high-dimensional data. Second, the growth of dimension brings "dimension gospelDonoho et al. (2000)", and the new information in high-dimensional data can create new possibilities for solving problems. How to represent high-dimensional data in low-dimensional space, and thus discover its internal structure is one of the key issues in high-dimensional information processing research. The dimension reduction method has been widely used as an effective means to overcome the "dimensional disaster", and the corresponding research has been discussed in the literature .
The existing dimension- reduction methods include the linear and nonlinear. The linear dimension- reduction method includes Principal Component Analysis (PCA) Tsuhan, et al.(2002), the Projection Pursuit (PP) Huber(1985) and so on, the main principle is to consider how to design the eigenvectors of linear models in high dimensional data spaceHe et al. (2002), but these methods don't work well for data with nonlinear structures. For the nonlinear characteristics of high-dimensional data sets, some nonlinear dimension- reduction methods such as Laplacian EigenmapBelkinet al. (2001), Locally Linear EmbeddingRoweiset al. (2000) have been developed in recent years.
Although a lot of results have been achieved for specific problems in practice, such as classification, search, pattern recognition, etc., but it is still difficult to analyze intuitively the goodness of the dimension- reduction map and the quantitative relationship between the high-dimensional data of the observation space and the low-dimensional data after the dimension- reduction. On the one hand, this is not conducive to the in-depth exploration of the inherent laws of data, on the other hand, it is not conducive to the visual comparison of the dimension-reduction effects of different methods.
In this paper, we propose the notions of explanation-radius and the local-comparability. The former measures the injective degree and the latter depicts the difference between the original data and the reduction data. And we analysis the common nonlinear dimension-reduction method such as Locally Linear Embedding, LaplacionEigenmap and linear dimension-reduction method such as Principal Component Analysis, Projection Pursuit by combining with examples. Furthermore, some experiments results in several fields show the effectiveness and advantages of our research.
II.
EXPLANATION RADIUS AND LOCAL COMPARABILITY
If
X
1,
X
2,
,
X
N
R
Dare independent and distributed in functionf
m(
x
)
,wheref
m(
x
)
is the distribution density inm
-dimensional manifold,that is, there exists one smooth mappingh
such thatx
h
(
y
)
, mR
If
f
m(
x
)
is approximate constant in a tiny neighborhoodV
(
x
i,
(
x
i))
of pointx
i, then the following formula is correct Levina and Bickel (2005):N
x
m
Volume
x
f
m(
i)
(
)
m(
i)
1
,where
)
1
2
(
)
(
2 /
m
m
Volume
m
denotes the volume of the unit sphere in
R
m,2
)
,
(
min
)
(
i ji j i
x
x
x
,the corresponding distance is the euclidean distance in
R
D.Definition1:Define
)
(
)
(
)
,
(
(1)) 2 (
x
f
y
f
Var
Y
X
C
mm *the
m
dimensional local similarity of the original dataX
and thedimensionality reduction data
Y
.Obviously, the value of
C
(
X
,
Y
)
tends to be small, which indicates that the distribution difference between the dimensionality reduction data point and the original data point tends to be small, and thus, the local similarity tends to be strong. Asa result obtained by the effective dimensionality reduction method should be localized. The value of similarity tends to be small.We know that the superiority of dimensionality reduction mapping
g
is closely related to the ability ofdimensionality reduction data to the original data, and the size of the original data set
g
1(
y
)
corresponding to the dimensionality reduction data pointy
indicates the explanation ability to the original data, and describes thedegree of unity of the dimensionality reduction mapping. If
g
1(
y
)
tends to be small, then the degree of homosexuality tends to be strong, as a result, the reversibility of the dimensionality reduction map tends to be stronger, that is to say, the explanation of the dimensionality reduction data to the original data is more accurate. On the contrary, if the reversibility of the dimensionality reduction mapping is weak, and the dimensionalityreduction capability is stronger. But, it is impossible to address the quantitative analysis of the size of
g
1(
y
)
. In the following, we will conduct the indirect analysis by using its distribution.We have that them i m i m i
m
V
x
f
y
P
1/) 1 (
)
(
)
(
)
(
reflects the size ofg
1(
y
)
in some extent since
mi i m i i i
m
y
P
y
V
y
P
x
g
y
f
x
Volume
m
P
(
)
(
,
)
1(
)
(1)(
)
(
)
.If the explanation-radius defined in the following definition 2 is smaller, the explanation is more accurate and better , otherwise, the result is more worse.
Definition 2:Define
m i m i m i
m
V
x
f
y
P
J
/ 1 ) 1 ()
(
)
(
)
(
the explanation-radius ofm
dimensionality reductionmapping about the date
x
i.Definition 3:Define
J
median
J
i , the explanation-radius ofm
dimensionality reduction mapping about the date setX
, wheremedian
J
i is the median of dates.Here
m
is actually the intrinsicdimension of the original data set, that is, the smallest number of explanatory variables. There are many ready-made methods for taking theintrinsic dimensionality, the authors could read Levina and Bickel (2005),K´egl (2002), Bruske and Sommer (1997). The focus is on the comparison of different methods in this paper, we consider the case ofm
2
in the following experimental for using the uniform standards.III.
EXPERIMENTAL RESULT
In this section, we analyze several methods of dimensionality reduction by using explanation-radius and the local-comparability. Two of linear dimension-reductionPCA、PPand two of nonlinear dimension-reduction LLE、Laplacian Eigenmapare analyzed.
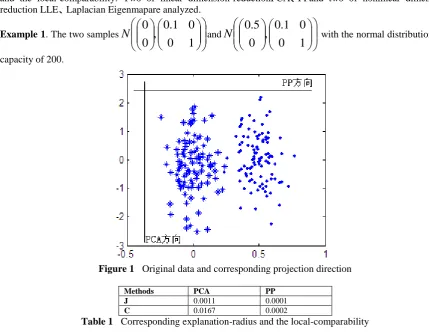
Example 1. The two samples
1
0
0
1
.
0
,
0
0
N
and
1
0
0
1
.
0
,
0
5
.
0
N
with the normal distribution andcapacity of 200.
Figure 1 Original data and corresponding projection direction
Methods PCA PP
J 0.0011 0.0001
C 0.0167 0.0002
Table 1 Corresponding explanation-radius and the local-comparability
From Table 1, We have that the method PP is more optimal than PCA about whether the explanation-radius or the local-comparability, and the results of Figure 1 also further verified this conclusion.
Example 2. An example of the number of 481 figures*. Each figure(120×128)is rotated in the same background, so the intrinsic dimensionalityis 1. But for convenience, we let
m
2
.Figure 2 Dates of original figures
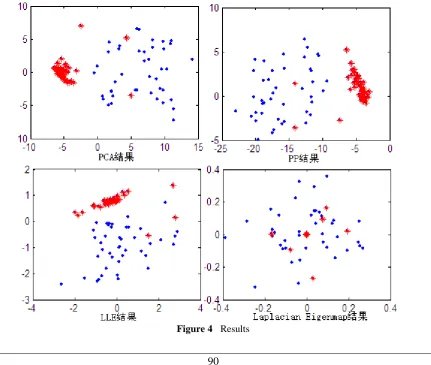
Figure 3 Results of nonlinear dimensionality reduction(15 areas)
Method LLE Laplacian
Eigenmap
J 2.3324 93.3590
C 0.0003 0.2036
Table 2 Corresponding explanation-radius and the local-comparability
From Table 2, We have that the method LLE is more optimal than Laplacian Eigenmap about whether the explanation-radius or the local-comparability, and the results of Figure 3 also further verified this conclusion.
Example 3 .(Data of breast cancerwww.ics.uci.edu/~mlearn/NLRepository.html ]*Each group of data consists o f 9 attribute values, describing a case of breast cancer. There are 98 groups in all cases. This is a sample data of 9-dimensional space, divided into two categories (negative with “●”, positive with “*”).
Method PCA PP LLE Laplacian Eigenmap
J 0.5204 0.5540 0.0023 0.0994
C 0.4772 0.5310 0.0024 0.0466
Table 3 Corresponding explanation-radius and the local-comparability
The results of Tables 1, 2, and 3 show that, in general, the PP method is superior to the PCA method an d LLE method is superior to the Laplacian Eigenmap method, whether it is continuous data (Such as images and normal distribution sampling)or for discrete data(Such as breast cancer data).
IV.
CONCLUSIONS
In this paper, we introduce the concept of interpretation radius and local similarity by using the data distribution of the original data and dimensionality reduction data at each point.The common nonlinear dimensionality reduction method, local linear embedding method, Laplacian feature mapping method, linear dimensionality reduction method, principal component analysis method and projection pursuit method are analyzed with examples.
ACKNOWLEDGMENTS
This research was supported by the National Natural Science Foundationof China (Nos.11801310, 11771251, 71771138, 61873144), the Province Natural Science Foundation of Shandong(No. ZR2017MA031), the Project of Shandong Province Graduate supervisor ability promotion (No.SDYY17139) and the Innovation and Entrepreneurship Project of Qufu Normal University.
REFERENCES
[1]. D.L.Donoho, High Dimensional Data Analysis: The Curses and Blessings of Dimensionality, presented at American Mathematics Society Conference: Math Challenges of the 21st Century, Los Angeles, USA, 2000
[2]. Chen Tsuhan, et al.Principle Component Analysis And Its Variants For Biometrics.In: IEEE 2002 International Conference on Image Processing, 2002
[3]. P. J. Huber. Projection pursuit. Annals of Statistics, 13(2): 435–525, June 1985
[4]. Xiaofei He, et al. Locality Preserving Projections (LPP). Technical Report TR-2002-09. Computer Science Department of the University of Chicago, 2002
[5]. M. Belkin,et al.Laplacian Eigenmaps and Spectral Techniques for Embedding and Clustering.Advances in Neural Information Processing Systems 15,Vancouver,British Columbia,Canada,2001
[6]. Sam T.Roweis,et al.Nonlinear Dimensionality Reduction by Locally Linear Embedding.Science,December 2000,vol 290
,22
[7]. E. Levina and P.J. Bickel. Maximum likelihood estimation of intrinsic dimension. In NIPS 17, Cambridge, MA, 2005www.stat.lsa.umich.edu/~elevina/mldim.pdf
[8]. Bal´azs K´egl, Intrinsic Dimension Estimation Using Packing Numbers,Neural Information Processing Systems, Vancouver, Canada, December, 2002
[9]. J.Bruske and G.Sommer, Intrinsic Dimensionality Estimation with Optimally Topology Preserving Maps, Technical Report Nr.9703, February 1997