227
Energy Consumption Reduction And Optimize
The Operation And It’s Associated Cost
Ameen Abdulkareem Al-AnsariAbstracts: A chilled water energy assessment was conducted at Public Authority for Applied Education and training in Kuwait, which took place over a 6-month period (April to September). This involved the facility’s engineering, maintenance, and chilled water production personnel. The goal of the energy assessment was to commission and audit the major energy uses at the facility and to identify opportunities to reduce energy consumption and optimize the operation and its associated cost. At the end of the site assessment, the recommendations of the cooling system was discussed in further length as well as the methodology of implementation, a wrap up study and discussion of findings and provide a list of recommendations for the plant to start evaluating. Estimated project costs are also included where they are know
————————————————————
1.
I
NTRODUCTIONA chilled water energy assessment was conducted at Public Authority for Applied Education and training in Kuwait, which took place over a 6-month period (April to September). This involved the facility’s engineering, maintenance, and chilled water production personnel. The goal of the energy assessment was to commission and audit the major energy uses at the facility and to identify opportunities to reduce energy consumption and optimize the operation and its associated cost. At the end of the site assessment, the recommendations of the cooling system was discussed in further length as well as the methodology of implementation, a wrap up study and discussion of findings and provide a list of recommendations for the plant to start evaluating. Estimated project costs are also included where they are known.
2.
F
ACILITYD
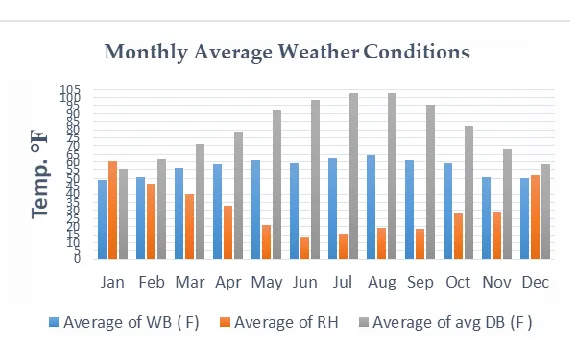
ESCRIPTIONThe facility is located in Kuwait, which is approximately 10 km in distance of Kuwait City. Since, the weather conditions data of Kuwait City was pulled and tabulated [1] . The data is for the year 2016, where it consists of monthly temperatures, relative humidity, cooling degree days, heating degree days, and wet bulb as represented below in table 1. Below the table, a graphical representation of the table is represented in chart 1
Table1: Kuwait Weather Conditions of 2016
Month Temperature
Relative Humidity
Degree Days @ 65°F (°F*Day)
W.B.
°C °F % CDD HDD °F
January 17 62 63% 0 10 49
February 19 67 66% 1 4 51
March 24 76 58% 6 0 56
April 29 84 55% 14 0 58
May 35 95 71% 27 0 61
June 39 103 69% 33 0 59
July 41 106 74% 37 0 63
August 42 107 59% 38 0 65
September 38 101 65% 30 0 61
October 32 90 72% 17 0 59
November 24 76 68% 4 1 51
December 18 64 58% 0 7 50
Chart 1: Kuwait City Weather Conditions of 2016
Currently, the central chilled water plant generates enough chilled water to serve multiple facilities in the college district. The plant is designed to handle 8000 Tons of cooling load with a chiller of 1000 Tons on standby. The estimated annual energy costs and consumption within the period of April 2017 to September 2017 is projected with a basis on cost of 0.028 K.D per kWh (recommended rate by government) for (8,670) hours.
2.1 COOLING SYSTEMS SCHEDULE/ DESCRIPTION
The next series of tables consist of actual data Table 2: Cooling Towers
C
o
o
lin
g
Tow
e
r I
D
Man
u
fa
c
tu
re
r Mod
e
l
#
N
u
mbe
r o
f Fan
s
Mot
o
r S
iz
e
p
e
r Fan
Mot
o
r S
p
e
e
d
C
o
n
tr
o
l
(S
e
lec
t)
C
a
p
a
c
it
y
Cooling Tower
Water L
o
a
d
S
e
rv
e
d
In
let
Temp
Ou
ts
ide
Temp
Flow
CT 1-CT
9 Marle
y H826
22 1
kW Const ant Speed
To
ns °F °F Gals/
min Chille rs (1-9)
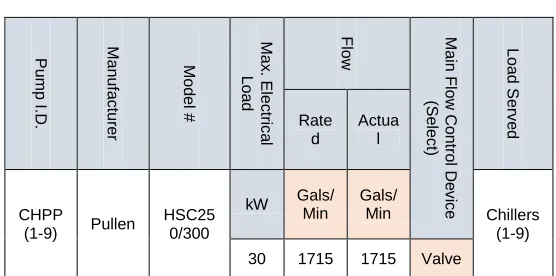
228 Table 3: Chilled Water Production Pumps
P u mp I.D . Man u fa c tu re r Mod e l # Max . E lec tr ic a l Load
Flow Main F
low C o n tr o l D e v ic e (S e lec t) L o a d S e rv e d Rate d Actua l CHPP
(1-9) Pullen
HSC25 0/300
kW Gals/ Min
Gals/
Min Chillers
(1-9) 30 1715 1715 Valve
Table4: Primary Chilled Water Pumps
P u mp I.D . Man u fa c tu re r Mod e l # Max . E lec tr ic a l Load
Flow Main F
low C o n tr o l D e v ic e (S e lec t) L o a d S e rv e d R a te d A c tu a l CHPP
(1-9) Pullen
HSC150 /380
kW Gals/ Min
Gals/
Min Chillers (1-9) 55 1715 1715 Valve
Table5: Condenser Water Pumps
P u mp I.D . Man u fa c tu re r Mod e l # Max . E lec tr ic a l Load Flow Main F low C o n tr o l D e v ic e ( S e le c t) L o a d S e rv e d R a te d A c tu a l CHPP
(1-9) Pullen
HSC25 0/380
kW Gals/ Min
Gals/
Min Chiller
s (1-9) 75 3000 3000 Valve
Table 6: Chilled Water Systems
E q u ipmen t T y p e (S e lec t) C h iller I. D . Man u fa c tu re r Mod e l # Max . E lec tr ic a l Load C a p a c it y C h illed W a te r L o a d S e rv e d In let Temp Ou ts ide Temp Flow Water-Coole d CH-1 to CH-9 Trane CVGF 1000 kW HVAC – AHU’s 651
Tons °F °F Gals/ min 1000 58 44 1715
2.2 COOLING SYSTEMS COOLING APPLICATION The chillers are primarily being used for cooling application. The main loads are for class rooms, labs, and office areas, which are served by air handling units (AHUs). The typical configuration has an outdoor air inlets, return air inlet, pre-filters, chilled water cooling coils, bag filters. Some (AHUs) units are with supply fans that have variable speed drives and some other AHU’s have return fans. This equipment is regularly started and stopped either manually or by an energy management system. System runs from 08:00 to 18:00 hours on a Sunday through Friday basis. Currently, the HVAC chilled water system is a constant primary / variable secondary flow chilled water system. It has a stepped capacity control based on the number of chillers that is manually selected to run. There are eight water-cooled and 1 standby chiller. The illustration below is a typical oversimplified configuration as this can be seen in figure 1.
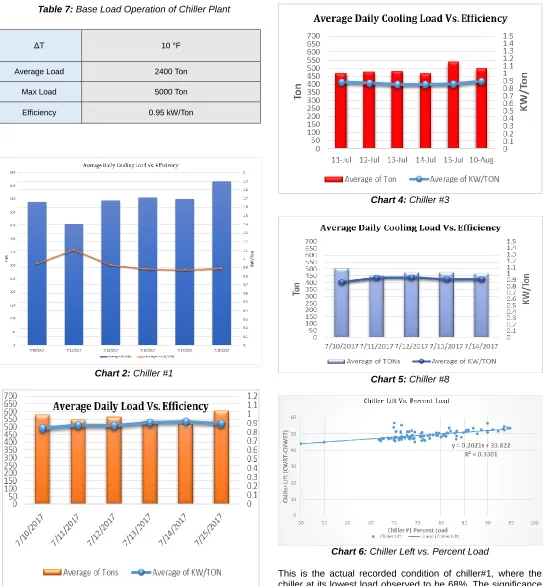
One chiller plant is comprised of eight chillers. This chiller plant provides cooling to the air handlers. It has eight dedicated cooling towers each with constant speed fans. The cooling towers provide cooling water for the associated chillers, every chiller has dedicated cooling tower pump. The series of next four charts (chart 2 through chart 5) illustrate the efficiency variation with respect to the load for chillers #1, #2, #3 and #8. As the charts clearly illustrate, the chiller load fluctuates and in turn all the chillers change their capacity to provide the required load. However, none of the chillers are in a base load / trim sequence strategy. This leads to inefficient operation and overall decreased in efficiency of the plant. The following table summarizes the base load operation of the combined chiller system at the plant as this can be seen in table 7
229 Table 7: Base Load Operation of Chiller Plant
Chart 2: Chiller #1
Chart 3: Chiller #2
Chart 4: Chiller #3
Chart 5: Chiller #8
Chart 6: Chiller Left vs. Percent Load
This is the actual recorded condition of chiller#1, where the chiller at its lowest load observed to be 68%. The significance is that it corresponds to be at 45 °F chiller lift temperature. The chiller manufacture specifies that the lowest lift is to be at 10 °F for a centrifugal compressor. Thus, it is clearly observed that the current chiller cannot unload efficiently to meet the lowest lift possible. The 50% load is a forecasted number to show that the lower the load the less the lift is and in turn more efficient the system potentially could be. However, with this type of chillers, the system is constrained in terms of unloading capabilities.
ΔT 10 °F
Average Load 2400 Ton
Max Load 5000 Ton
230
3.
COOLING
SYSTEM
RECOMMENDATIONS
TO
INCREASE
THE
TOTAL
EFFECIENCY
OF
THE
CHILLER
PLANT
In this section, the recommendations of the cooling system will be discussed in further length as well as the methodology of
implementation. There are 7 recommendation items that will
be discussed.
1- Replacing the constant load chillers with oil-free chiller
with variable speed drives.
2- Adding variable speed drives to control cooling tower
fans with an outdoor wet bulb temperature sensor.
3- Install variable speed drives and optimize them for the
chiller pumps.
4- Install variable speed drives on cooling tower pumps.
5- Development of energy intelligence to include central
plant energy control system (CPECS).
3.1 Item 1: Replace Constant Load 1000 Tons Chillers With Oil-Free Chiller With VFD
Currently, the chilled water plant is running inefficiently as this is illustrated in the load profile in charts 9 and charts 10 below.
Chart 7: Load Profile of Chiller #1
In the table below is a summarization of the optimization with oil free chillers, optimized oil free chillers with VFDs on chillers, cooling towers, and condenser water pumps and in comparison to a baseline performance. The tabulated data also consist of the kWh saved upon replacing the chillers and addition of VFDs.
Plant Run Hours
Annual Ton Hours
Plant Efficiency
(kW/ton)
kWh Saved
$ Savings ($0.095 USD/kWh) Baseline 8,760 31,253,100 0.951 - -
CPECS with oil free
Chillers
8,760 31,253,100 0.677 8,552,435 $812,481
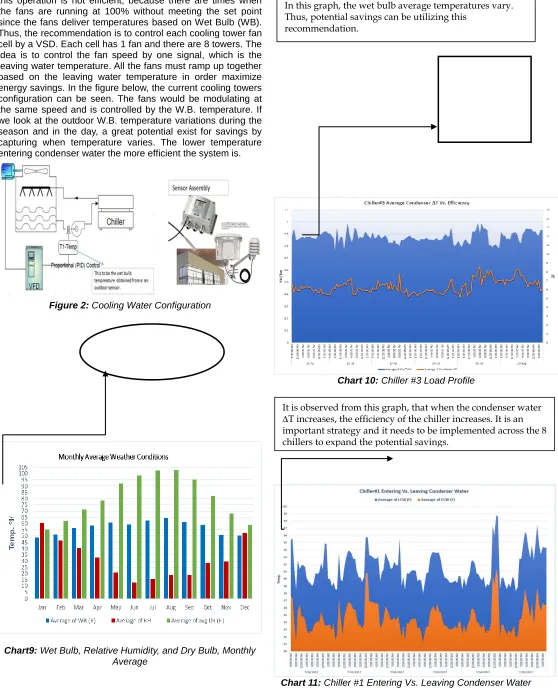
3.2 Item 2: Add VFDs To Control Cooling Tower Fans And An Outdoor Wet Bulb Temperature Sensor Currently, there are 8 cooling towers and each tower has 1 fan. All of the fans are running at 100% and tower cells are controlled based on the leaving water temperature. However,
This chart illustrates the daily average load fluctuation. It is critical to know the load in order to sequence the chiller properly. However, this needs to be automated using a chilled water plant optimization system such as Smart System. Also, this shows the inability to unload due the chiller selected to be a constant load chiller. If the Smart Chiller is to be used, then the chiller can be unloaded up to 20% and operate at an efficiently well below 0.6 kW/Ton.
231 this operation is not efficient, because there are times when
the fans are running at 100% without meeting the set point since the fans deliver temperatures based on Wet Bulb (WB). Thus, the recommendation is to control each cooling tower fan cell by a VSD. Each cell has 1 fan and there are 8 towers. The idea is to control the fan speed by one signal, which is the leaving water temperature. All the fans must ramp up together based on the leaving water temperature in order maximize energy savings. In the figure below, the current cooling towers configuration can be seen. The fans would be modulating at the same speed and is controlled by the W.B. temperature. If we look at the outdoor W.B. temperature variations during the season and in the day, a great potential exist for savings by capturing when temperature varies. The lower temperature entering condenser water the more efficient the system is.
Figure 2: Cooling Water Configuration
Chart9: Wet Bulb, Relative Humidity, and Dry Bulb, Monthly Average
Chart 10: Chiller #3 Load Profile
Chart 11: Chiller #1 Entering Vs. Leaving Condenser Water
In this graph, the wet bulb average temperatures vary. Thus, potential savings can be utilizing this
recommendation.
It is observed from this graph, that when the condenser water
232 The recommendation is to add a VFD to the CTWS pump as
well to have the system modulate speed based on feedback from the pressure transducer of the supply header to maintain a specific pressure difference ΔP. Many VFDs exist on the market where they can have a 4-20mA signal from a local pressure meter and modulate to the pressure set-point. To reduce the needed pump volume, isolation valves can be added to the compressors. An open valve by default is installed, that closes via a relay. The relay switch is tied into the run signal from the local control panel for the compressor or dryer. The cost includes the installation of a VFD on the pump, a discharge line pressure transmitter, and eight (8) normally open solenoid valves. The pump savings will be realized upon implementation.
3.3 Item 3: Chiller Pump VFDs Installation And Optimization
It is proposed that variable frequency drives be installed on pumps to optimize their usage and minimize pumping energy by adjusting the flow based on load. The balance of the chilled water pumps that are already on VFDs should be optimized. The sequencing strategy is such that the pumps’ speed will be based on chilled water load as measured by flow meters and differential temperatures between the supply and return lines. The idea behind the strategy is to reduce the pumps speed when the chilled load is low as indicated by a small differential temperature. The cost includes the installation of three new chilled water flow meters, integration into the existing Energy Management System, and modifying the control strategy in the control system
3.4 Item 4: Install VFDs on cooling tower pumps
The existing pumping system in cooling tower consists of pumps operating at constant power. This uses more energy than required, providing an opportunity for energy savings. The proposed condition will install variable frequency drives on the cooling tower pumps to control the flow of the pumps based on the cooling requirements measured by differential temperature. The flow will be maintained such that minimum flow conditions are met at with the required pump speed. The cost for the system includes installation of VFDs on each pump and modifying the control strategy in the Energy Management System to control the pump speed based on a fixed temperature differential between supply and return temperatures
3.5 Item 5: Expand Energy Intelligence to include CPECS
The current system does not have a powerful historian database, which is not effectively being utilized by the plant. The CPECS system will include more HVAC and chiller data points and other important energy and process data. The data will be able to perform the following:
1. Create more robust dashboards that can be viewed in real
time
2. Generate daily reports automatically to summarize the
day's energy consumption (total kwh), efficiency of systems (kW/tons)
3. Send alerts via fault detection & diagnostics
The three primary source of the 4,400,699 kWh/yr or $418,066 in savings from CPECS and RCx will be realized through the following processes:
1.
Decrease Operations and Maintenance effort and costs.a. Facilitate ongoing recommissioning of systems to
ensure persistence of savings.
b. Identify root causes to poor system performance.
c. Extend the useful operation lifecycles of equipment
and systems.
2.
Increase indoor environmental quality and occupantcomfort.
a. Verify that adequate air flows and proper space
temperatures are being maintained in occupant spaces.
3.
Realize immediate and long-term energy savings andpeak demand savings.
a. Optimize how the facility’s energy using systems are
operated and maintained.
b. Identify previously unrecognized inefficiencies in
building and plant system operations.
Measure and document energy savings from resulting operational improvement
4.
SUMMARY OF RECOMMENDATIONS
This Energy Assessment Report is the result of a process involving a significant effort by a team of people at the Public Authority for Applied Education and Training in Kuwait and the subject matter expert in chilled water optimization. Other specialists within the Facilities Engineering Services have reviewed the report and contributed their experience in evaluating some of the energy saving opportunities. This approach has identified potential energy and cost saving opportunities and are presented in the table as follows.
Table8: Cost Saving and Return on Investment
Financial Estimated CPECS Cost
$752,520
USD Simple Payback 1.8 years
Annual Savings ($0.095 USD)
$418,066 USD
Net Present Value* (10-year)
$2,125,339 USD
* NPV Assumes 10% Discount Rate and 3% Inflation Rate This graph illustrates excellent T ranges as it maintains an
233 Some of the projects will need cost adjustment depending on
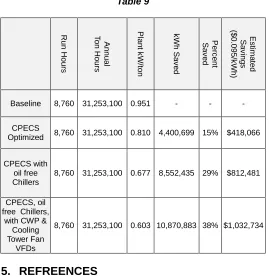
local costs that may or may not improve the return on investment (ROI). Also, other ongoing projects may have an interaction with each other, which results in the savings and costs to change. The annual load profile allowed for the collected data to be extrapolated over a year-long period. This was needed in order to create an annual plant performance baseline. The developed load profile was also used to optimize plant performance estimation. The results of the analysis are presented below in table 9.
Table 9
R
u
n
H
o
u
rs
A
n
n
u
a
l
T
o
n
H
o
u
rs
P
lan
t k
W
/to
n
k
W
h
S
a
v
e
d
P
e
rc
e
n
t
S
a
v
e
d
E
s
tim
a
te
d
S
a
v
ing
s
($
0
.0
9
5
/k
W
h
)
Baseline 8,760 31,253,100 0.951 - - -
CPECS
Optimized 8,760 31,253,100 0.810 4,400,699 15% $418,066
CPECS with oil free Chillers
8,760 31,253,100 0.677 8,552,435 29% $812,481
CPECS, oil free Chillers,
with CWP & Cooling Tower Fan
VFDs
8,760 31,253,100 0.603 10,870,883 38% $1,032,734
5.
REFREENCES
[1]. American Society of Heating, Refrigerating and
Air-Conditioning Engineers. Ventilation for
Acceptable Indoor Air Quality. ASHRAE Standard 62-1999. ASHRAE, Atlanta (1999).
[2]. Carrier Kuwait Air Conditioning K.S.C.
[3]. Yuce, B, Rezgui Y an ANN-GA semantic
rule-based system to reduce the gap between predicted and actual energy consumption in public buildings IEEE trans. Autom sci. Eng. 2015.
[4]. Barret, P, Sexton, M. innovation in small,
project-based construction firms’ .Br. J. Manage. 2006.
[5]. Reeves, T., Olbina, S., Issa, R.R.Guidelines for
using building information modelling for energy analysis of buildings 2015.
[6]. Energy conservation and building code, user
guide. Ministry of electricity and water – State of
Kuwait.
[7]. Isaacs, N., Donn, M. (1996) .Evaluating energy