Transport
and
the
Environment
PROGRESS
TO DATE AND THE REMAINING CHALLENGES
By
Michael P. Walsh
Consultant, Arlington, Washington, U.S.A.
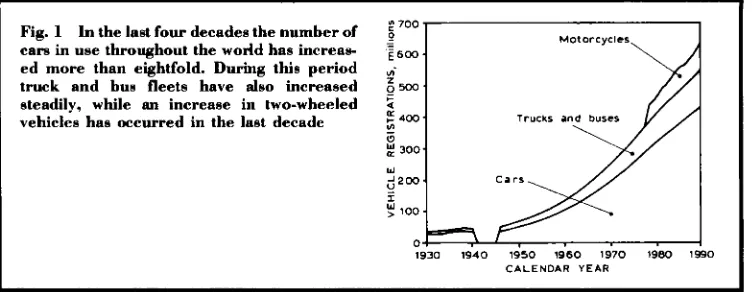
Across the entire globe, motor vehicle usage has increased tremendously in recent years. In 1950, there were about 53 million cars on the world’s roads; only four decades later, the global automobile fleet is now over 430 million, more than an eightfold increase. On average, the fleet has grown by about 9.5 million automobiles per year over this period. Simultaneously, as illustrated in Figure 1, the truck and bus fleet has been growing by about 3.6 million vehicles per year (1). If the approx- imately 100 million two-wheeled vehicles around the world is included, a number that has been growing at about 4 million vehicles per year over the last decade, the global motor vehi- cle fleet is now approximately 675 million.
Simultaneously, over the course of the past two decades, substantial progress has been made in reducing emissions from vehicles. North America, Europe and Japan have developed significant motor vehicle pollution control programmes which have led to tremen- dous advances in petrol car control technologies. At present, similar technologies are under intensive development for diesel cars and trucks, and significant breakthroughs are starting to appear with production diesel vehicles. As a result of these efforts around the world, motor vehicle emissions today are much lower than they might otherwise have been. Based on global emissions under standardised test conditions, it is estimated that carbon monoxide, hydrocarbons and nitrogen oxides emissions are, respectively 90, 63 and 51 per cent lower around the world than they would have been if countries had not moved forward on motor vehicle emission controls. In urban areas, under conditions which give rise to the highest levels of ozone or carbon monoxide in the air, actual reductions have been much lower. None the less, most of the gain has been
the result of the introduction of platinum based catalytic converters.
However, in many areas, the air quality pro- blem remains serious and widespread, and motor vehicles continue to be the dominant source of the emissions which cause many of these problems. Air pollution problems which are related to motor vehicles are no longer limited to the countries in the Organisation for Economic Co-operation and Development (OECD); areas of rapid industrialisation are now starting to note similar air pollution pro- blems to those of the industrialised world. Cities such as Mexico, Delhi, Seoul, Singapore, Hong Kong, Sao Paulo, Manila, Santiago, Bangkok, Taipei and Beijing, to cite just a few, already experience unacceptable air quality, or are projecting that they will do so in the relatively near future.
Furthermore, the number of vehicles con- tinues to grow. Because of this continued growth, on top of the existing air pollution pro- blems which still plague most countries, addi- tional control initiatives will have to be undertaken to attain clean, healthy air.
Environmental Problems Caused
by
Motor
Vehicle Emissions
Initially, the problems resulting from motor vehicle emissions were most apparent in city centres, but recently lakes and streams and even remote forests have also experienced significant degradation. Carbon monoxide, hydrocarbons and nitrogen oxides emitted by motor vehicles are also contributing to global atmospheric changes which most scientists believe are likely to alter the climate of the planet. Nevertheless, the primary greenhouse gas remains carbon dioxide, produced by motor vehicles and from other sources. Although detailed discussion of this pollutant is beyond
Trucks and buses Fig. 1 In the last four decades the number of
cars in use throughout the wodd has increas- ed more than eightfold. During this period truck and bus fleets have also increased steadily, while an increase in two-wheeled vehicles has occurred in the last decade
'0°
6M)
m-
5%
i
y
"'-L
100cx
04 \ I I
1930 1940 1950 1960 1970 1980 1940 C A L E N D A R YEAR
the scope of this paper, it is worth noting that in the United States of America reductions of carbon dioxide were greatest during the period when improvements in carbon monoxide, hydrocarbons and nitrogen oxides were occurr- ing at the most rapid rate.
Pollutants in Urban Areas
Over 90 per cent of the carbon monoxide emitted in cities generally comes from motor vehicles. People with coronary artery disease who are exposed to carbon monoxide during ex- ercise experience chest pain (angina); exposure also alters their electrocardiograms (2). In addi- tion, foetuses, people with sickle cell anaemia and young children are also highly susceptible to exposure to low levels of carbon monoxide. Although ambient carbon monoxide levels have been reduced across Europe, Japan, and the United States of America, the problem is far from under control (3). Global carbon monox- ide concentrations in the lower atmosphere are increasing by 0.8 to 1.4 per cent per year (4). Nitrogen oxides emissions from vehicles and other sources produce a variety of adverse health and environmental effects. They react chemically with hydrocarbons to form ozone and other highly toxic pollutants (5). Next to sulphur dioxide, nitrogen oxides emissions are the most prominent pollutants contributing to acidic deposition. Direct exposure to nitrogen dioxide leads to increased susceptibility to respiratory infection, increased airway resistance in asthmatics, and decreased
pulmonary function. Short term exposure to nitrogen dioxide has resulted in a wide ranging group of respiratory problems in school children, among the most common are coughs, runny noses and sore throats, and also to in- creased sensitivity to urban dust and pollen by asthmatics. Some scientists believe that nitro- gen oxides are significant contributors to the dying forests seen throughout central Europe. Because lead is added to petrol, motor vehicles have been the major source of lead in the air of most cities. Several studies have now shown that children with high levels of lead ac- cumulated in their baby teeth experience more behavioural problems, lower IQ and decreased ability to concentrate. Most recently, in a study of 249 children from birth to two years of age, it was found that those with prenatal umbilical- cord blood lead levels at or above 10 micrograms per decilitre consistently scored lower on standard intelligence tests than those having lower lead levels. As a result the U.S. Department of Health and Human Services considers all children at levels above 10 micrograms per decilitre of lead in their blood to be at risk (6).
Other toxic emissions from mobile sources
are also a serious problem. A variety of studies has found that in individual metropolitan areas, mobile sources are one of the most important, possibly the most important, source category in terms of their contribution to health risks associated with air toxicity. For example, accor- ding to the U.S. Environmental Protection
Agency, mobile sources art responsible for ap- proximately 58 per cent of the air pollution related cancer cases in the U.S.A. each year.
Regional Considerations
The most widespread air pollution problem in areas with temperate climates is ozone, one of the photochemical oxidants which results from the reaction of nitrogen oxides and hydrocarbons in sunlight (7). Many individuals exposed to ozone suffer eye irritation, cough and chest discomfort, headaches, upper respiratory illness, increased asthma attacks, and reduced pulmonary function (8).
Numerous studies have also demonstrated that photochemical pollutants inflict damage on forest ecosystems and seriously affect the growth of certain crops.
Although ozone in the lower atmosphere does not come directly from motor vehicles, they are the major source of the ozone precursors, hydrocarbons and nitrogen oxides, throughout the industrialised world. Over the past 100 years, “background” ozone levels have approx- imately doubled (9), and monitoring data sug- gest that ozone concentrations are increasing by about 1 per cent per year in the northern hemisphere (10).
Acid deposition results from the chemical transformation and transport of sulphur diox- ide and nitrogen oxides. Evidence indicates that the role of nitrogen oxides may be of increasing significance with regard to this problem.
Global Changes
A significant environmental development during the 1980s was the emergence of global warming, or the greenhouse effect, as a matter of major international concern. Pollutants associated with motor vehicle use can increase global warming by changing the chemistry in the atmosphere so as to reduce the ability of the sun’s reflected rays to escape. As noted by the Intergovernmental Panel on Climate Change, “Increases in CH,
,
NMHCs, and CO all lead to increases in 0,,
and decreases in OH, thus leading to an increase in radiative forcing. ” (1 1) It is important to note that the availableevidence indicates that emissions of nitrous ox- ide, a potent greenhouse gas, tend to increase with the use of three-way catalytic converters. Based on a review of available literature as well as some new testing on nine vehicles, General Motors Research has concluded that vehicular emissions of nitrous oxide are about 125% in the U.S.A. and about 200Gg worldwide. “Bas- ed on this value and the rate of N , O increase in the stratosphere, vehicles in the United States emit about two percent of anthropogenic N , O emissions and contribute only 0.1 per cent of the calculated temperature increase from greenhouse gases.” (12)
The State of
the
Urban
Environment
The Example of Asia
As noted earlier, motor vehicle related pollu- tion problems are not limited to the highly in- dustrialised West. As a result of the large and growing number of poorly maintained vehicles, with minimal, if any, pollution controls, and powered by unusually dirty fuels, most major cities of Asia are already experiencing serious motor vehicle related air pollution problems, frequently on top of other serious environmen- tal insults. In virtually every city for which data is available, carbon monoxide, lead and par- ticulate, coming primarily from road traffic, ex- ceeds acceptable norms. Further, vehicles contribute significant amounts of hydrocarbons and nitrogen oxides emissions, which are fre- quently toxic as well as contributing to photochemical smog in cities with the ap- propriate meteorological conditions.
In Thailand, for example, the Office of the National Environment Board has monitored levels of carbon monoxide, particulate matter and lead near major roads in Bangkok since 1984. According to their latest annual report the “air pollution problem in Thailand is serious near the major streets.” (13) In certain areas of the city where traffic density is high,
‘ ‘particulate matter’s concentrations far exceed the daily ambient air quality standards of 330 microgram/cubic meter on any day, and are as high as 2-3 times standard values on some
days”. Carbon monoxide levels are also high in some areas of high traffic density, frequently exceeding air quality standards.
A study of blood lead levels of policemen ex- posed to three different rates of vehicular traf- fic, found a positive and statistically significant link between traffic exposure and blood lead levels (14).
In Hong Kong, approximately “1.5 to 2 million people are exposed to unacceptable levels of sulphur dioxide and nitrogen dioxide and about three million people are exposed to high particulate levels. Many people are expos- ed to unacceptable levels of all three pollutants.” (15) “The most common adverse health effects of these pollutants take the form of increased incidence of respiratory illnesses, such as asthma and bronchitis. The high levels of air pollution in many parts of Hong Kong must seriously aggravate the condition of those already suffering from such illnesses and con- tribute to the onset of chronic conditions. Other health effects such as lung cancer can be caused by air pollution, as certain air pollutants, such as those emitted from diesel vehicles, are known to be carcinogenic.” (15) The air pollution problem in many urban areas is compounded by the life style and climate in many of the warmer Asian cities. As a result there is much greater public exposure to the emissions from vehicles which are emitted directly at the breathing zones of many millions of people. This was reinforced in a recent study conducted by the East West Center where an individual carried a personal exposure monitor throughout the day (16). Carbon monoxide levels were found to increase dramatically dur- ing a vehicle trip compared to levels in a house, even when a charcoal stove was in use.
International Progress
in
Controlling Pollution
Advances in automotive technologies have made it possible to lower emissions from motor vehicles dramatically. Increasingly, countries around the world have been taking advantage of these technologies. Initial crankcase hydrocar- bon controls were frst introduced in the early
1960s followed by exhaust carbon monoxide and hydrocarbons standards later that decade. By the early to mid 1970s most major industrial countries had initiated some level of vehicle pollution control programme.
During the mid to late 1970s, advanced technologies were introduced on most new cars in the U.S.A. and Japan. These technologies resulted from a conscious decision to “force” the development of new approaches, and were able to reduce dramatically carbon monoxide, hydrocarbons and nitrogen oxides emissions, to levels unachievable by previous systems. As knowledge of these technological developments on cars spread, and as the adverse effects of motor vehicle pollution became more widely recognised, more and more people across the globe began demanding the use of these systems in their countries. During the mid 1980s, Austria, the Netherlands, and the Federal Republic of Germany adopted in- novative economic incentives to encourage pur- chase of low pollution vehicles. Australia, Canada, Finland, Austria, Norway, Sweden, Denmark and Switzerland all decided to adopt mandatory requirements. Even rapidly in- dustrialising, developing countries such as Brazil, Chile, Taiwan, Hong Kong, Mexico, Singapore and South Korea have adopted stringent emissions regulations.
After years of debate, the European Com-
munity has also made significant strides. As 1990 came to a close, the European Council of Environmental Ministers reached unanimous agreement to require all new models of light du- ty vehicles, by 1992A993, to meet emission standards sufficiently stringent to require the universal use of catalytic converters based upon platinum group metals on all petrol fuelled vehicles. Further, they voted to require the Commission to develop a proposal before 31 December 1992 which, taking account of technical progress, will require a further reduc- tion in limits. Presumably this proposal should be roughly equivalent to U.S. standards of 0.25 grams per mile non-methane hydrocarbons, 0.4 nitric oxide and 3.4 carbon monoxide.
At the same time that emissions per kilometre
have been decreasing in many areas, the amount of driving has continued to increase. The world vehicle population has in fact been growing faster than the overall population; over the last decade, the per capita car population has increased in every corner of the world. Even in the U.S.A., which already had a much greater per capita vehicle population by far than any other area of the world, it continues to in- crease. In percentage terms, for the world as a whole, cars per capita increased by over 20 per cent during the last decade.
Where
Do We
Go
from
Here?Regional Trends in the Vehicle Fleet
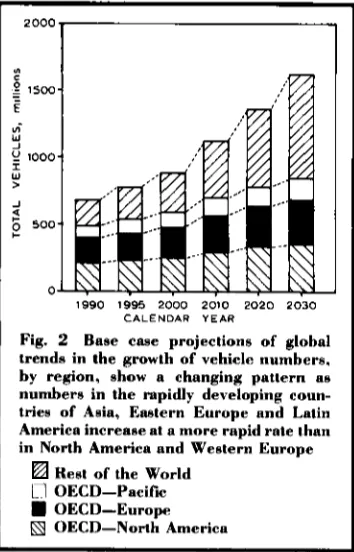
After consideration of the underlying factors influencing vehicle growth, especially popula- tion growth and economic development, pro- jections of future vehicle numbers have been made. Estimates of cars, trucks and buses, and motorcycles for the next forty years are given in Figure 2. In making these estimates it was assumed that vehicle saturation, increased
2000
Ln
c
8 1500
E
Lo
W
u
1000W >
J
4
6 500
c
0
1990 1995 2000 2010 2 0 2 0 2030
CALENDAR Y E A R
Fig. 2 Base case projections of global trends in the growth of vehicle numbers, by region, show a changing pattern a8 numbers in the rapidly developing coun- tries of Asia, Eastern Europe and Latin America increase at a more rapid rate than in North America and Western Europe
Rest of the World
11
OECD-Pacific OECD-Europek
2
OECD-North Americacongestion and further policy interventions by governments would restrain future growth, especially in highly industrialised areas. In spite of this, vehicles per capita are estimated to con- tinue to rise in all areas of the world. It should be emphasised that without policy interven- tions, the growth will likely be much higher.
As noted earlier, the global vehicle fleet has tended to be dominated by the highly in- dustrialised areas of North America and Western Europe. This pattern is gradually changing, not because these areas have stopped growing but because growth rates are ac- celerating in other regions. Early in the next century, based on current trends, the rapidly developing areas of the world, especially Asia, Eastern Europe and Latin America, and the OECD Pacific region will have as many vehicles as North America and Western Europe. Forty years on, North America and OECD Europe could represent less than half the global fleet.
Emissions Rates
The emissions rates for carbon monoxide, hydrocarbons and nitrogen oxides have been estimated, based on exhaust and evaporative emissions standards, fuel quality, maintenance practices, refuelling controls, and Inspection and Maintenance programme status and plans in each country in each of the regions. For countries with no, or very few, pollution con- trol strategies at present it is estimated that they will generally adopt the same programmes as the more environmentally advanced rapidly in- dustrialising countries after a delay of approx- imately ten years.
Emissions Trends by Region
Projections of future emissions from vehicles around the world are summarised in Figure 3 for each region of the world. Based on a con- tinuation of the strong motor vehicle control programmes in the U.S.A. and Japan, and the recent tightening of requirements in the coun- tries of the European Community, these estimates indicate that global carbon monoxide, hydrocarbons and nitrogen oxides emissions will remain fairly stable throughout the next
""
1
I
Fig. 3 Base case Droiections of ulobal trendst
250. hC
I
2 200. *0
w'150.
e
s
g
100.I
z
50. 4 lJ
n-
*lo\
U
x
I
: 4 0
L
0
0 x 30
ui
p
2 0 4U
& I 0
0
1990 1995 2000 2010 2020 2030
50
n
x
-
4 0
0
L
9
0
* 30
0-
D
0 2 0
X
z
Y
10
z
0
1990 1995 2000 2010 2020 2030
3001
1990 1995 2000 2010 2020 2030
CALENDAR Y E A R
decade. Beyond that point, however, emissions of all three pollutants will start to increase due to the projected continued growth in vehicle numbers both in OECD countries and especial- ly in other areas of the world where emissions controls are frequently minimal. This upturn in
-
-
in vehicle emissions by region suggest that for
the three pollutants considered amounts will
be fairly stable until the turn of the century. At that stage there will be an increase in both
hydrocarbons and nitrogen oxides, but car-
bon monoxide emissions may decline
somewhat until about 2020 when the
detrimental effects of a rapid increase in vehicles, especially in the rapidly developing countries, are likely to prevail. The key is given in Figure 2
hydrocarbon and nitrogen oxides emissions will occur shortly after the turn of the century; for carbon monoxide, the downward trend is ex- pected until 2020 when it will also turn up.
Emissions Trends by Vehicle Type
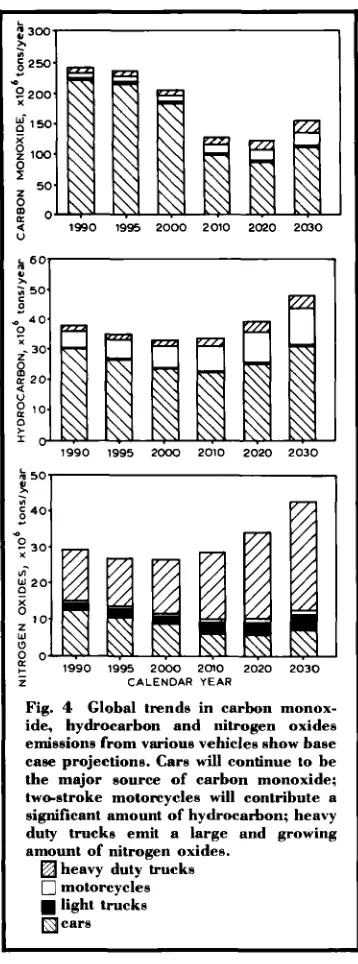
An analysis of the trends in global emissions of carbon monoxide, hydrocarbons, and nitrogen oxides by vehicle type provides some startling insights, as illustrated in Figure 4. First of all, and not surprisingly, cars remain the dominant source of carbon monoxide for the foreseeable future. However, motorcycles, most of which have two-stroke engines, are seen to be significant contributors to hydrocar- bons emissions around the world, a fact which is largely ignored in the West due to the small contribution made by motorcycles to pollution in that region. With regard to nitrogen oxides emissions, heavy duty trucks make a large and rapidly growing contribution, due to the minimal nitrogen oxides control of these vehicles in most regions of the world.
Alternative Futures
The Technological State-of-the-Art Continued growth in emissions from the transportation sector is not inevitable. Even relatively modest steps can significantly lower emissions in the near term, and combined with slight reductions in future vehicle growth pat- terns, overall stability in emissions from the transport sector is possible.
In the state-of-the-art case, emissions were estimated as if all vehicles in the world were to
I
5 2 5 0
0 200
-
W-
p 150
B
1 0 00
I
m o 50
6
Y
-4 1990 1995 2000 2010 2020 2030
1990 1995 2000 2010 2020 2030
k 50-
y.
u1
c
5 40.
0
3 0
VI
x
205
-1 0
W
D
0 0
1990 1995 2000 2010 2020 2030
z CALENDAR YEAR
Fig. 4 Global trends in carbon monox-
ide, hydrocarbon and nitrogen oxides emissions from various vehicles show base case projections. Cars w i l l continue to be
the major source of carbon monoxide;
twestroke motorcycles will contribute a
significant amount of hydrocarbon; heavy
duty trucks emit a large and growing
amount of nitrogen oxides.
heavy duty trucks
0
motorcycleslight trucks cars
adopt the most stringent set of requirements considered technologically feasible today. These include currently adopted California low emission vehicle standards for cars and light trucks, heavy truck requirements scheduled to be introduced in the U.S.A. during the 1990s, volatility controls on petrol to reduce
evaporative and refuelling hydrocarbon emis- sions, enhanced inspection and maintenance programmes to maximise the effectiveness of emissions standards and refuelling controls.
If all vehicles in the world were to adopt these requirements, carbon monoxide, hydrocarbons and nitrogen oxides emissions would drop significantly over the next twenty years. Two points are worth emphasising:
1. Using today’s state-of-the-art technology on all vehicles, emissions are dramatically lower than they would be in the base case. For exam- ple, hydrocarbons are only a third of the amount that they would otherwise be; in the case of nitrogen oxides they are less than half. 2. Because of their high growth rates, even with the application of state-of-the-art controls, the non OECD countries of the world will be much more important in the future.
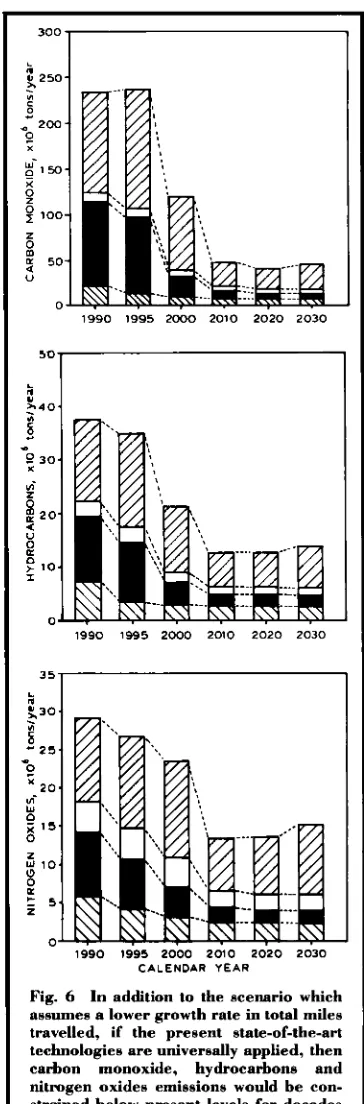
The State-of-the-Art P h s Lower Growth An additional scenario was analysed which in addition to the more widespread application of the state-of-the-art controls includes lower growth rates in vehicle miles travelled. Under these projections, as illustrated in Figure 5, the vehicle population increases by 30 per cent bet- ween 1990 and 2010, and by another 50 per cent to 1.2 thousand million vehicles by 2030. This reflects the much lower per capita vehicle population in non OECD countries compared to OECD countries, the former are projected to grow at a much faster rate in the future.
Trends in global carbon monoxide, hydrocar- bons, and nitrogen oxides emissions are shown in Figure 6, assuming that these lower growth rates occur and that the state-of-the-art technologies described above are implemented. Under this scenario, carbon monoxide, hydrocarbons, and nitrogen oxides emissions are constrained below current levels for the next forty years.
Summary and Conclusions
Air pollution is a widespread problem in many countries. Guidelines for air quality, embedded in law in many nations or recom- mended by such international bodies as the
1400
UI
:
1200m-looo
;
BOO- -
E
W
W
600
2
F
400
200
0
1990 1995 2000 2010 2020 2030
CALENDAR Y E A R
Fig. 5 In a scenario which assumes lower growth rate in the total vehicle miles travelled, the number of vehicles in the non OEDC countries of the world will in- crease at the most rapid rate, starting as they do from their current much lower vehicle population per capita. The key is given in Figure 2
World Health Organisation, are frequently ex- ceeded in industrialised and less industrialised nations. Such excesses threaten human health, material and economic well-being, and, perhaps most important, ecological stability.
Motor vehicles are the largest single source of man-made volatile organic compounds, nitrogen oxides, and carbon monoxide in the OECD as well as in many rapidly industrialis- ing countries. Controls which reduce these pollutant emissions from this source to the maximum extent technologically feasible are therefore most effective at reducing ozone con- centrations. In addition, motor vehicles are probably also the major source of toxic pollutants, and make a significant contribution to potential climate altering emissions.
These emissions cause or contribute to a wide range of adverse health and environmental ef- fects including eye irritation, cough and chest discomfort, headaches, heart disease, upper respiratory illness, increased asthma attacks and reduced pulmonary function. The most re- cent studies indicate that these emissions can cause cancer and exacerbate mortality and
300
I
h?, 250 J
A
VI
.
s
0 200
;
1 5 0 9p
100P
X
z
5
50U
0
1990 1995 2000 2010 2020 2030
1990 1995 2000 2010 2020 2030
k
K 3 0
-
6
-
2 50
0
* 20
m-
15
3
10t
c 5
n
V .
1990 1995 2000 2010 2020 2030
CALENDAR Y E A R
Fig. 6 In addition to the scenario which assumes a lower growth rate in total miles travelled, if the present state-of-the-art technologies are universally applied, then carbon monoxide, hydrocarbons and nitrogen oxides emissions would be con- strained below present levels for decades to come. The key is given in Figure 2
morbidity from respiratory disease. In addi- tion, studies indicate that air pollution seriously impairs the growth of certain crops, reduces visibility, and in sensitive aquatic systems such as small lakes and streams can destroy fish and other forms of life, and damage forests.
Whether it be localised urban problems, regional smog or global changes, it is clear that motor vehicles are a dominant source of air pollution.
Technologies such as platinum group metals based closed-loop three-way catalyst systems have been developed which have the potential to substantially reduce vehicle emissions in a cost effective manner. Application of these state-of-the-art technologies can improve vehi- cle performance and drivability, reduce maintenance and facilitate improved fuel economy. Evaporative controls are also readily available and cost effective. The effectiveness of state-of-the-art emissions controls can be im- proved by in-use vehicle directed programmes such as inspection and maintenance, recall and warranty.
As a result of platinum group metals based catalysts and other controls introduced to date, carbon monoxide, hydrocarbons and nitrogen oxides levels are substantially below what they would otherwise be.
If today’s state-of-the-art emissions controls were introduced on all new vehicles around the world, it would be possible to continue to reduce vehicle emissions of carbon monoxide, hydrocarbons and nitrogen oxides while simultaneously absorbing the expected growth in vehicle numbers, at least until early in the next century.
Advances in the state-of-the-art for vehicle technology are emerging and, coupled with more modest vehicle growth, they can constrain global vehicle emissions if they are widely utilised and effectively implemented.
Looking ahead to the future, it is clear that several challenges remain for platinum group metals based catalyst technology. Particular areas of intense activity include:
1. Preheated or very quick light-off systems which will enable manufacturers to comply
with the stringent California low emission vehicles requirements.
2. Diesel flow-through particulate catalysts which can lower particulate and the organics associated with diesel combustion without con- verting too much sulphur dioxide to sulphate. 3. Lean nitrogen oxides catalysts which would enable technologies with inherent lean operating advantages, such as diesels or two- strokes, to take advantage of these capabilities without increasing nitrogen oxides emissions.
1
2
3
4
5
6
7
8
9
10
11
12
13
14
15
16
References
“World Motor Vehicle Data, 1991 Edition”, Motor Vehicle Manufacturers Association of the United States, Inc., p.35
“Health Effects of Ambient Air Pollution,” American Lung Association, 1989, p. 10 “National Air Quality and Emissions Trends Report, 1991”, U.S. Environmental Protection Agency, EPA-450/4-91-023, February 1992 M. A. K. Khalil and R. A. Rasmussen, Nature,
1988, 332, (6161), 242
“Air Quality Criteria for Ozone and Other Photochemical Oxidants”, Vol. 11, U.S. En- vironmental Protection Agency, EPA/600/8-
“Preventing Lead Poisoning in Young Children,
A Statement by the Centers for Disease Control”,
U.S. Department of Health and Human Services,
Public Health Service, Centers for Disease Con-
trol, October 1991
“National Air Quality and Emissions Trends Report, 1990”, U. S. Environmental Protection Agency, EPA-450/4-91-023, November 1991 “Health Effects of Ambient Air Pollution”, American Lung Association, New York, July 1989
A. Volz and D. Kley, Nature, 1988, 332, (6161), 240
P. Ciborowski, “Sources, Sinks, Trends, and Op- portunities’’, in “The Challenge of Global Warm- ing’’, ed. D. E. Abrahamson, Island Press, Washington, D.C., 1989, p.217
Intergovernmental Panel on Climate Change, 1992 IPCC Supplement, February 1992 J. M. Dasch, “Nitrous Oxide Emissions from Vehicles”,J. Air Waste Manage. Assoc., 1992,42,
(I), 63
“Air and Noise Pollution in Thailand 1989”, Na- tional Environment Board of Thailand, 1990 “Various Factors Associated with Blood Lead Levels of Traffic Policemen in Bangkok Metropolis”, Thesis of Sompratana Raungchat “White Paper: Pollution in Hong Kong-A Time to Act”, Hong Kong EPA, 5 June 1989 Personal Communication with Kirk Smith, February 28, 1991
84/020bF, August 1986, pp.3-15 ff