R E S E A R C H
Open Access
Effects of different sources of carbohydrates on
intake, digestibility, chewing, and performance of
Holstein dairy cows
Simin Poorkasegaran
1and Asadollah Teimouri Yansari
1,2*Abstract
To investigate the effects of different sources of carbohydrates on intake, digestibility, chewing, and performance, nine lactating Holstein dairy cows (day in milk= 100±21 d; body weight=645.7 ± 26.5 kg) were allotted to a 3 × 3 Latin square design at three 23-d periods. The three treatments included 34.91% (B), 18.87% (BC), and 18.86% (BB) barley that in treatment B was partially replaced with only corn or corn plus beet pulp in treatments BC and BB, respectively. The concentration of starch and neutral detergent soluble carbohydrate varied (22.2, 20.2, and 14.5; 13.6, 15.9, and 20.1% of DM in treatments B, BC, and BB, respectively). Cows in treatment BB showed a higher DMI and improved digestibility of DM, NDF, and EE compared with treatments B or BC. Ruminal pH was higher in cows fed on BB (6.83) compared with those that received B or BC treatments (6.62 and 6.73, respectively). A lower proportion of propionate accompanied the higher pH in the BB group; however, a greater proportion of acetate and acetate: propionate ratio was observed compared with cows fed either on the B or BC diet. Moreover, cows fed on the BB diet showed the lowest ruminal passage rate and longest ruminal and total retention time. Eating time did not differ among treatments, rumination time was greater among cows fed on the BB diet compared with the others, whereas total chewing activity was greater than those fed on BC, but similar to those fed on B. The treatments showed no effect on milk yield. Partially replacing barley with corn or beet pulp resulted in an increase in milk fat and a lower protein concentration. Changing dietary NFC with that of a different degradability thus altered intake, chewing activity, ruminal environment, retention time or passage rate, and lactation performance. The results of this study showed that beet pulp with a higher NDF and a detergent-soluble carbohydrate or pectin established a more consistent ruminal mat than barley and corn, thus resulting in higher mean retention time and chewing activity, whereas no changes in 3.5% FCM and milk fat were observed.
Keywords:Chewing activity, Dairy cow, Detergent-soluble carbohydrate, Fiber, Neutral detergent fiber, Physically effective fiber, Ruminal characteristics
Background
Three components affect the balance of carbohydrates in the diets of lactating dairy cattle. The first two are the nature of the NDF and the nature of non-fiber carbohy-drates (NFC), and the third component is one of the fol-lowing: NDF content, NFC content, or NDF:NFC ratio [1-3]. Carbohydrates consisting of NDF and NFC frac-tions make up 65%–75% of rations. However, issues have
been associated with the use of an NDF because this component ranges from 27% to 37% in dietary DM, whereas NFC content ranges from 45% to 35% [3,4]. The NFC has been represented as a single value for feeds or diets, but the type of carbohydrates in this frac-tion largely varies. For example, the NFC in corn grain is mostly starch (65%–70% of DM), beet and citrus pulp provides sugar (12%–40% of DM) and neutral detergent-soluble carbohydrate (NDSC) (25%–44% of DM), and sugar (mono- and oligosaccharides) predominates in molasses [5]. In addition, some of the variation in the re-sults of the effect of the type and amount of NFC on high-producing lactating cows may be related to: 1) the * Correspondence:astymori@yahoo.com
1Department of Animal Science, Animal Science and Aquaculture Faculty,
Sari Agricultural and Natural Resource University, Sari, Mazandaran, Iran
2Department of Animal Science, Educational Center of Tajan, GhaemShahar,
Mazandaran, Iran
effects of rapidly degradable starch on ruminal digestion of fiber; 2) the level to which NFC replaces fiber in the ration; 3) the site of starch digestion; 4) the level of DMI and the physiological state of the animal; and 5) the con-servation and processing methods of NFC sources used to alter the rate and the extent of NFC digestion [4-6]. However, the optimal concentration of NFC in dairy cow diets has not been well defined. The lack of clear recommendations may be at least due to the wide com-positional and nutritional variation in the sources of NFC, the kinetics of ruminal digestion, and the yields of metabolizable nutrients [4]. Therefore, improving the understanding of the digestion and metabolism of vari-ous NFC types that are fed to dairy cattle can improve animal performance and profitability while maintaining health.
The physically effective NDF (peNDF) incorporates in-formation on particle length, NDF content of the diet, and impact of replacing forage fiber with NFC based on the use of small particles of byproducts and measuring the animal’s chewing activity [7,8]. However, this concept does not account for different sources of NFC or differ-ences in fermentability among various feeds. The nature of NFC differs among feeds and diets. In evaluating the effectiveness of the NDF approach, the effect of remov-ing or addremov-ing NFC has been entirely attributed to NDF [1,2,9]. Based on this simple assumption, the effective-ness of NDF from all sources is thus based on the re-placement of NFC. Therefore, understanding the nutritional value of each NFC type may aid in the use of available feeds, including byproducts, to efficiently for-mulate dairy cow diets that would enhance production and health. However, extensive information on the opti-mal level of starch and digestible fiber in rations for dairy cows is warranted to facilitate in the design of strategies to prevent ruminal acidosis and the efficient conversion of energy into milk. The objective of this trial was to compare the effects of three different carbohy-drate sources, namely barely, corn, and beet pulp (BP), on stimulating intake, digestibility, chewing activity, ru-minal characteristics, and early lactation in Holstein dairy cows.
Materials and methods Animals and diets
The experiment was conducted at the Dairy Farm of the Agricultural Education and Research Centre of Jehad-e-Keshavarzi, Sari, Iran. Nine multiparous mid-lactation Holstein dairy cows (BW = 645.7 ± 26.5 kg; DIM = 100 ± 21 d) were subjected to a 3 × 3 Latin square design. The experiment consisted of three 23-d periods (adaptation, 14 d; sample collection, 7 d; and measurement of chew-ing activity, 2 d). The three treatments containchew-ing 34.91% (B), 18.87% (BC), and 18.86% (BB) barley as DM
were used. The barley in treatment B was partially re-placed with only corn or corn plus beet pulp in treat-ments BC and BB, respectively (Table 1). Barley grain, corn grain, and BP were prepared by milling normal BP using a 2-mm screen pore size miller. Diets were similar in chemical (16% CP and 6.65 MJ/kg of NEL) and phys-ical (geometric mean and peNDF) characteristics
Table 1 Ingredients and chemical composition of three total mixed rations containing three different sources of non-fiber carbohydrates
Item Treatments
1
SEM P
value
B BC BB
Ingredients, % of DM2
Alfalfa hay 23.41 23.69 23.57
Wheat straw 15.53 15.84 15.8
Barley grain 34.91 18.87 18.86
Corn grain … 15.89 …
Beet pulp … … 15.89
Cotton seed meal 11.19 8.88 8.90
Soybean meal 3.01 2.99 3.01
Wheat bran 8.01 9.68 9.69
Sunflower meal 2.69 2.99 3.01
Calcium carbonate 0.43 0.4 0.5
Calcium phosphate 0.25 0.20 0.20
Salt 0.10 0.10 0.10
Vitamin supplement3 0.25 0.25 0.25
Urea 0.22 0.22 0.22
Chemical compositions, % of DM
CP 16.2 15.9 15.9 0.232 0.321
NDF 36.2 36.9 37.7 0.864 0.079
ADF 23.1 22.6 24.6 0.541 0.092
NFC 38.9 38.9 37.9 0.682 0.061
Starch 22.2a 20.2a 14.5b 0.792 0.001
Sugar 3.1 2.8 3.3 0.432 0.213
NDSC4 13.6c 15.9b 20.1a 0.232 0.001
EE 2.3 2.4 2.4 0.219 0.212
Ash 6.4 5.9 6.1 0.672 0.431
NEl5, Mcal/kg of DM 1.58 1.59 1.58 0.232 0.452
a, b, c
Means within a row with different subscripts differ (P< 0.05). 1
Treatments were diets containing barley + basal diet (B), barley and corn + basal diet (BC), and barley and beet pulp + basal diet (BB).
2
Alfalfa, wheat straw, barley grain, corn, beet pulp, cotton seed meal, soy bean meal, wheat bran, and sun flower meal (DM basis) were chemically composed of 89.1%, 50.9%, 18.7%, and 15.3%; 91.2, 75.2, 10.4, and 3.4; 93.2, 22.1, 55.4, and 10.5; 96.7, 11.0, 78.3, and 8.5; 93.4, 44.4, 41.0, and 9.0; 90.7, 45.2, 16.3, and 27.3; 90.3, 17.8, 24.7, and 42.5; 90.3, 52.3, 24.4, and 16.5; and 92.0, 55.7, 17.3, and 16.1 for OM, NDF, NFC, and CP, respectively.
3
Contained 40% NaCl, 25% Dyna mate, 10% K, 7% Mg, 12% S, 1,000 mg Fe/kg, 2% ZnSO4.H2O, 2% MnSO4.4H2O, 0.01% CoSO4.6H2O, 0.009% Na2SeO3, 0.012% ethylenediamine dihydroiodide, 0.8% CuSO4.5H2O, 680,000 IU/kg of Vitamin A, 160,000 IU/kg of Vitamin D, and 2,000 IU/kg of Vitamin E.
4
NDSC = Neutral detergent soluble carbohydrate. 5
(Table 2). Cows were housed in tie-stalls and fedad libi-tumtwice daily at 0900 and 2100 h with TMR, allowing for at least 10% residual (as-fed basis). Water and miner-alized salt stone were available for cows during the experiment.
Particle length and effectiveness fiber
Feed particle size and distribution were determined by dry sieving in four replicates using two sets of a Penn State particle separator [10,11]. The NDF content of all materials retained on each sieve of the Penn State par-ticle separator were measured [12]. Using three systems, the physical effective factor (pef) of the TMRs was de-termined. According to Mertens [13], Lammers et al. [10] and Kononoff [11], the pef was determined based on the proportion of DM retained on the 1.18-m sieve (pefm), on two 19- and 8-mm sieves (pef>8), and three 19-, 8-, and 1.18-mm sieves (pef>1.18), respectively. The peNDFm, peNDF>8, and peNDF>1.18 were calculated by
multiplying the NDF content of each portion on each sieve with the pefm, pef>8, and pef>1.18, respectively
(Table 2).
Body weight, intake, and apparent total-tract nutrient digestibility
The BW of cows was determined each wk. The DMI of the cows was measured daily (Table 3). Daily samples of TMRs, residuals and. total feces were collected daily for 5 d of each period at 0700 h on d 14 to 0700 h on d 20, weighed, and d 5 samples were composited and subsam-pled. The samples were dried at 55°C for 48 h and ground using a Wiley mill (1-mm screen), analyzed for DM, Kjeldahl N, ether extract, OM, ash at 605°C for 3 h [14], NDF, and ADF [12; withα-amylase being added for concentrates during NDF extraction; sodium sulfite was not added]. Neutral detergent fiber was expressed without residual ash. Non-fibrous carbohydrate was calculated using the following equation: 100 - % CP +%
Table 2 Physical characteristics of three total mixed rations containing three different sources of non-fiber carbohydrate
Item Treatments1 SEM P
value
B BC BB
Particle size distribution (material retain on each sieve, % of DM)
19 mm 9.7 10.1 9.8 0.732 0.213
8 mm 22.2 22.1 20.4 0.912 0.133
1.18 mm 34.4 34.2 36.9 1.648 0.422
Pan 33.7 33.6 32.9 0.641 0.455
Geometric mean, mm 3.85 3.92 3.80 0.692 0.087
Standard deviation of geometric mean 1.20 1.24 1.34 0.106 0.093
Physical effective factor
pefm2 66.2 66.3 66.9 0.509 0.101
pef> 83 34.4 34.6 31.3 0.322 0.288
pef> 1.184 66.3 66.4 67.1 0.694 0.083
Physical effective NDF, % of DM
peNDFm 24 24 26 1.13 0.063
peNDF> 8 12 13 12 1.03 0.054
peNDF> 1.18 24 24 26 1.14 0.063
1
Treatments were diets containing barley + basal diet (B), barley and corn + basal diet (BC), and barley and beet pulp + basal diet (BB).
2
pefm= physically effective factor, based on DM retained on sieve 1.18 mm [13].
3
pef>8= physically effective factor, determined as the proportion of DM retained on sieves of the original version of Penn State particle separator [10]. 4
pef>1.18= physically effective factor, determined as the proportion of DM retained on sieves of the new version of Penn State particle separator [11]. 5
The peNDF was calculated by multiplying NDF content of each portion on each sieve on each pef [13].
Table 3 Body weight, intake, and digestibility of nutrients of three total mixed rations containing three different sources of non-fiber carbohydrates
Item Treatments1 SEM P
value
B BC BB
BW, kg 600.63 591.84 583.25 11.212 0.140
Intake, kg/d
DM 21.14b 21.02b 22.32a 0.530 0.004
NDF 7.65b 7.76b 8.57a 0.021 0.001
peNDFm2 5.10b 5.14b 5.74a 0.034 0.025
peNDF> 83 2.63 2.68 2.68 0.231 0.075
peNDF> 1.184 5.07b 5.15b 5.75a 0.023 0.024
CP 3.42 3.34 3.55 0.456 0.133
NFC 8.22 8.18 8.46 0.345 0.309
Starch 4.69a 4.25a 3.24b 0.431 0.002
Sugar 0.66 0.59 0.73 0.084 0.064
NDSC5 2.88c 3.34b 4.49a 0.104 0.001
EE 0.49 0.50 0.54 0.121 0.087
OM 19.79 19.78 20.96 0.961 0.342
Digestibility, %
DM 64.58b 65.01b 66.91a 0.824 0.004
NDF 61.58b 62.38b 68.82a 1.028 0.004
ADF 51.67 52.21 52.33 0.769 0.100
CP 77.33 77.42 76.89 0.571 0.532
NFC 83.36a 80.37b 80.90b 1.424 0.032
EE 62.44b 66.52ab 67.33a 0.277 0.024
OM 64.68 64.61 63.53 1.143 0.200
a, b, c
Means within a row with different subscripts differ (P< 0.05). 1
Treatments were diets containing barley + basal diet (B), barley and corn + basal diet (BC), and barley and beet pulp + basal diet (BB).
2
peNDFm= physically effective NDF based on DM retained on sieve 1.18 mm [13].
3
peNDF>8= physically effective NDF, determined as the proportion of DM retained on sieves of the original version of Penn State particle separator [10]. 4
peNDF>1.18= physically effective NDF determined as the proportion of DM retained on sieves of the new version of Penn State particle separator [11]. 5
NDF +% ash +% EE [4]. The TMR composites were ana-lyzed for soluble sugars using sucrose as the standard and for starch [5]. The proportion of NDSC was com-puted as NFC (%) using the following equation: [(Sugar (%) + Starch (%)] [5]. Using the chemical components of TMRs and feces, the intake and digestibility of nutrients were calculated. Intake (kg/d and% of DMI) of peNDFm,
peNDF>8, and peNDF>1.18were calculated for each
treat-ment (Table 3).
Rumen fermentation and kinetics
On d 21 of each period, ruminal fluid samples (50 mL) from the ventral sac were collected 3 h after the morning feeding using the rumenocentesis technique. Ruminal pH was measured immediately after ruminal fluid collection using a pH meter (model 632, Metrohm, Herisau, Switzerland), and samples were frozen at−20°C. The con-centration of ammonia nitrogen (NH3-N) was measured
using a Kjeltec Auto Analyzer (Model 1030, Tecator Co. Sweden). Ruminal fluids were acidified by mixing with 2.5 mL of 6 mol/L HCl and then frozen for further ana-lysis of VFA and NH3-N. Ruminal fluid was centrifuged at
25,000 ×gfor 20 min before measurement of VFA by gas chromatography (4% carbomax 80/120 BDA column, Supelco Inc., Bellefonte, PA; Autosystem XL gas chro-matograph, Perkin Elmer Inc., Norwalk, CT) [15].
Digestive kinetics were measured using Cr-mordanted NDF alfalfa that was prepared by repeatedly soaking a mixture of alfalfa hay in dilute neutral detergent and rinsing until the NDF content of the material exceeded 80%. The fiber was then dried at 55°C. Chromium (Cr)-mordanted alfalfa NDF was prepared as previously de-scribed by Uden et al. [16], as the single-dose marker for solid passage rate measurement. Cr-mordanted fiber was prepared by mordanting alfalfa NDF ground through a 5-mm screen using a Wiley mill. Each cow was orally fed with a mix of 2 kg of concentrate and 250 g of marker before morning feeding on the 15th d of each period. Fecal grab samples were collected at 0, 6, 10, 12, 14, 18, 22, 26, 30, 36, 42, 48, 54, 60, 72, 84, 96, 120, and 144 h after dosing from the rectum to determine the passage rate, ruminal, and total mean retention time, and time delay (transit time) of the marker. Samples were dry-ashed, and fecal Cr concentrations were deter-mined by direct current plasma emission spectroscopy [14]. Fecal Cr excretion curves were fitted to the double compartment model, as represented by the following two exponential constants and a time delay [17]:
Y¼Aek t1ð‐TTÞ−Ae‐2kðt‐TTÞ;k1¼k2for t3T;Y¼0 for t
¼TT;
in which Y = marker concentration (ppm); A = scale par-ameter; k1= ruminal passage rate (%/h); k2= lower
digestive tract passage rate (%/h); t = sampling time post dosing (h); and TT = transit time or time delay of marker. The total mean retention time was calculated as the sum of ruminal mean retention time (1/k1), and
for the lower digestive tract, mean retention time (1/k2)
plus the transit time. Parameters were estimated by NLIN regression using the PROC NLIN (iterative Marquardt method) of SAS® [18]. The estimated parameters were analyzed according to a previously described experimental design.
Eating, ruminating, and chewing times
Eating and ruminating activities were monitored visually for all cows in each treatment over a 24-h period for 2 d and at d 22 to 23 of each period. Eating and ruminating activities were noted at 5-min intervals and each activity was assumed to persist for the entire interval. A period of rumination was defined as at least 5 min of ing activity, followed by at least 5 min without ruminat-ing activity. Total time spent on chewruminat-ing was calculated as the total time spent eating and ruminating [8].
Milk production
Milk yield was recorded daily during the course of the experiment. On d 18 to 23 of each period, milk samples were collected each morning and evening. Approxi-mately 100 mL of each milk sample were composited and analyzed for total protein, fat, and lactose [14].
Statistical analysis
The data on particle size were analyzed as a completely randomized design for the effects of the diets and the two methods of particle size measurement using the REML variance component and PROC MIXED of SAS® [18]. Mean separation was determined using the PDIFF procedure and significance was declared atP< 0.05. The geometric mean and its standard deviation were calcu-lated using ASAE S424.1 [7].
Using PROC MIXED of SAS® [18], the experimental data were analyzed in a 3 × 3 replicated Latin square design using following model:
Yijkl¼μþΤiþSjþCowk jð Þþperiodþeijkl
in which Yijkl is the dependent variable; μ is overall
mean; Tiis fixed effect of the treatments (i = 1, 2, and 3
for diets containing B, BC, and BB); Sj,random effect of
square (j = 1, 2, and 3); Cowk(j), effect of cow within
square; periodl within square, and eijkl is residual error.
Results
Nutrient composition, particle size distribution, and physical effectiveness of different treatments
Except for starch (P =0.001) and NDSC (P =0.001) con-tent, the three TMRs showed similar chemical composi-tions and physical characteristics (Tables 1 and 2). Concentrations of starch were similar for treatments B and BC and both were greater than that observed with treatment BB (22.2, 20.2, and 15.9%, respectively). In addition, the concentration of NDSC increased with par-tial replacement of barley by corn and to a greater extent by partial replacement with BP (13.6, 15.9, and 20.1% for treatments B, BC, and BB, respectively). Distribution of particles, expressed as the percentage of total mass, retained on the 19, 8, 1.18-mm sieves for the three TMRs were also similar and averaged 9.7, 10.1, and 9.8; 22.2, 22.1, and 20.4; 34.4, 34.2, and 36.9%, respectively. The values of pefm, pef>8, and pef>1.18 of the treatments
were different among the systems. However, regardless of the methods and evaluation system, as well as the geometric mean and its standard deviation, their values were similar within each system. The peNDF values (% of DM) were similar in all treatments (Table 2).
Intakes and apparent total-tract nutrient digestibility Dry matter intake (P =0.004), as well as NDF (P =0.001), peNDFm (P = 0.025), and peNDF>1.18 (P = 0.024) intake
were significantly different, although the intake of CP, NFC, EE, and ash were similar among treatments. Replacing bar-ley with BP increased DMI, but DMI in treatments B and BC were similar (Table 3). The nature of NFC affected DMI, as well as the production and composition of milk. Positive intake responses to feeding on BP were observed. Cows in the treatment BB group consumed more NDF, peNDFm, and peNDF>1.18 compared with those in
treat-ments B and BC. The intake of starch (P =0.002), sugars, and NDSC (P = 0.001) varied among the different NFC treatments. Cows fed on treatments B and BC showed a greater intake of starch compared with treatment BB. Cows assigned to the B diet showed the smallest sugar and NDSC intakes. NDF intake did not vary among treatments. How-ever, there were some unexpected differences in the total NFC intake, ash, and CP. Digestibility of DM (P = 0.004), NDF (P =0.004), NFC (P =0.032), and EE (P =0.03) varied among treatments, although digestibility of ADF, CP, and OM remained the same (Table 3). The highest DM, NDF, and EE and significantly lower NFC digestibility were ob-served in treatment BB.
Rumen fermentation and kinetics
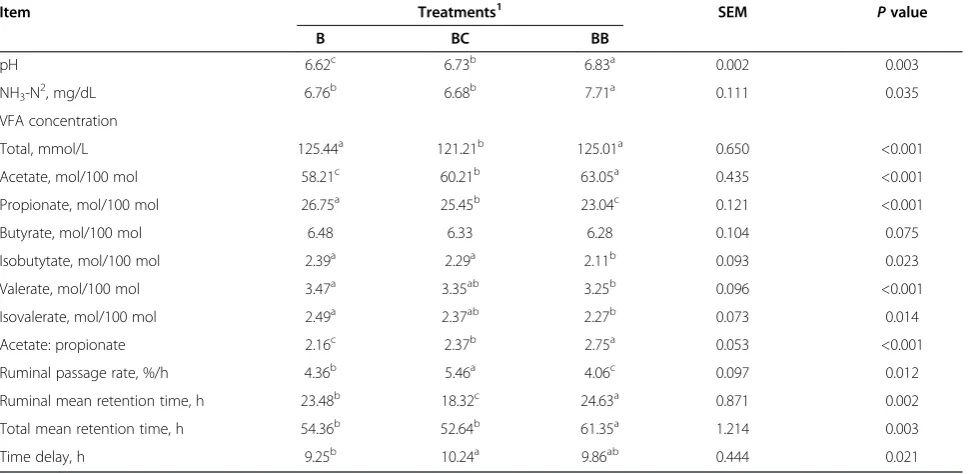
Lower pH levels were observed in cows that received treatments B and BC compared with those in treatment BB (P = 0.003). In addition, the NH3-N concentration
varied among treatments (P = 0.035). The NH3-N
concentrations were significantly lower in treatments B and BC than in treatment BB. The total VFA concentra-tion in treatment BC was similar to those observed in treatments B and BB. Acetate concentration levels were also significantly different (P< 0.001) among treatments. The lowest values of acetate and acetate: propionate ra-tio was observed in treatment B, whereas the highest were observed in treatment BB. The butyrate concentra-tion remained the same among treatments. The lowest values for propionate, isobutytate, valerate, and isovale-rate were observed in treatment BB, whereas the highest were in treatment B.
The ruminal particulate passage rate was highest and lowest in treatment BC and BB, respectively. The rumi-nal and total mean retention time were higher in treat-ments BB than in treattreat-ments B and BC. Contrary to the passage rate, treatments BB and BC showed the highest and lowest ruminal mean retention times, respectively. However, total mean retention time in treatment BB was higher than in treatments B and BC (Table 4). The time delay of the marker was significantly lower in treatment B than in BC (Table 4).
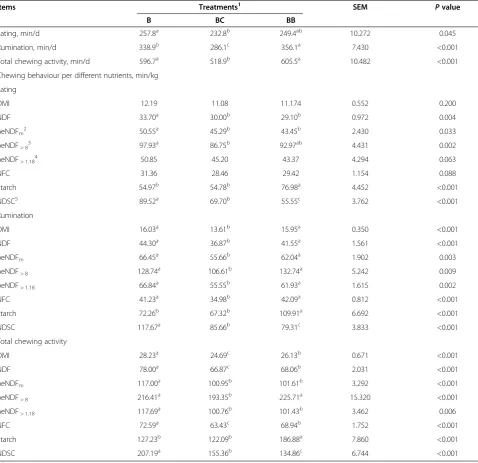
Eating, ruminating, and chewing times
No differences in eating time were observed among treatments, although rumination time (P≤0.001) and total chewing activity (P <0.001) varied (Table 5). Ru-mination time and total chewing activity were lower and higher in BC compared with that observed in B and BB. Treatment BB showed the highest rumination time and total chewing activity. Eating time (min/kg) per NDF in-take, peNDFm, and peNDF>8 were higher in treatment B
compared with treatments BC and BB. However, no sig-nificant differences with regard to eating time per NDF intake, peNDFm, and peNDF>8 were observed among
treatments B and BB. Rumination time (min/kg) per DMI, NDF intake, peNDFm, peNDF>8, peNDF>1.18, and
NFC were higher in treatments BB and BB compared with treatment BC. However, no significant differences on rumination time per DMI, NDF intake, peNDFm,
peNDF>8, peNDF>1.18, and NFC were observed among
treatments BB and BB. In addition, total chewing activity (min/kg) per DMI, NDF intake, peNDFm, peNDF>8,
peNDF>1.18, and NFC were higher in treatment BB
com-pared with treatments BC and BB. However, no differ-ences on total chewing activity per peNDFm, peNDF>8,
peNDF>1.18 were observed between treatments BC and
intake NDSC was lower in treatment BB than in ments B and BC, and was significantly lower in treat-ment BC than in treattreat-ment B (Table 5).
Milk production
Although milk yield was not altered, replacing barley with corn and BP in the diet resulted in an increase in milk fat [yield (P= 0.013)] and percentage (P <0.001) and a decrease in milk protein (yield (P= 0.021) and per-centage [(P= 0.001); Table 6)], respectively.
Discussion
Nutrient composition, particle size distribution, and physical effectiveness
The pef>8 values were lowest for TMRs, although the
pefm and pef>1.18 values were higher and very close. In
contrast to the peNDFm and peNDF>1.18, the peNDF>8
values were similar among treatments. In this experi-ment, peNDFmand peNDF>1.18were higher than 21% of
the DM that Mertens [13] suggested to adequately stimulate chewing activity that was required to maintain an average ruminal pH of greater than 6.0. The peNDF content of experimental rations was adequate and the differences among treatments were attributable to the effects of NFC sources or its nature. The concentration of starch was similar in the B and BC treatments and higher than that observed in the BB treatment, but the NDSC significantly varied among treatments. These re-sults thus confirm that intake of starch and NDSC varied
with different NFC treatments. We hypothesized that the use different digestion products, which are the NFC complement of the diet, would alter feed intake, ruminal digestion kinetic, chewing activity, and the production and composition of milk.
Intake and apparent total-tract nutrient digestibility The intake of peNDFm and peNDF>1.18 did not follow
the same trend as the pef content of the diets, although this was similar to that of NDF; however, this increased in treatment BB. Treatment BB, which contained more NSDC, resulted in a significant increase in DMI. These results have been confirmed by several previous studies. Substitution of sugars and NDSC with starch has in-creased [19-22] or did not change [23] the intake in dairy cattle. Increases in dietary concentrations of NDSC at the expense of starch also increased [20,24], decreased [22,25], or did not affect DMI [24]. Changes in the pas-sage rate or fiber digestibility using various NFC sources may partial explain these changes [6]. A higher intake in treatment BB could have been expected based on the high NDSC and elevated starch content of barley and corn compared with treatments B and BC.
In this experiment, intake might have been regulated by the metabolism of propionate in the liver, and ruminal pro-pionate production generally increases with a higher rate of starch fermentation. The amount of starch intake was 4.69, 4.25, and 3.24 kg/d, and ruminal molar percent of propion-ate in total VFA was 26.75, 25.45, and 23.04 mol/100 mol
Table 4 Ruminal metabolites and kinetic of digestion of three total mixed rations containing three different sources of non-fiber carbohydrate
Item Treatments1 SEM
Pvalue
B BC BB
pH 6.62c 6.73b 6.83a 0.002 0.003
NH3-N 2
, mg/dL 6.76b 6.68b 7.71a 0.111 0.035
VFA concentration
Total, mmol/L 125.44a 121.21b 125.01a 0.650 <0.001
Acetate, mol/100 mol 58.21c 60.21b 63.05a 0.435 <0.001
Propionate, mol/100 mol 26.75a 25.45b 23.04c 0.121 <0.001
Butyrate, mol/100 mol 6.48 6.33 6.28 0.104 0.075
Isobutytate, mol/100 mol 2.39a 2.29a 2.11b 0.093 0.023
Valerate, mol/100 mol 3.47a 3.35ab 3.25b 0.096 <0.001
Isovalerate, mol/100 mol 2.49a 2.37ab 2.27b 0.073 0.014
Acetate: propionate 2.16c 2.37b 2.75a 0.053 <0.001
Ruminal passage rate, %/h 4.36b 5.46a 4.06c 0.097 0.012
Ruminal mean retention time, h 23.48b 18.32c 24.63a 0.871 0.002
Total mean retention time, h 54.36b 52.64b 61.35a 1.214 0.003
Time delay, h 9.25b 10.24a 9.86ab 0.444 0.021
a, b, c
Means within a row with different subscripts differ (P< 0.05). 1
Treatments were diets containing barley + basal diet (B), barley and corn + basal diet (BC), and barley and beet pulp + basal diet (BB). 2
in treatments B, BC, and BB, respectively, showing that starch intake decreased with a higher rate of starch intake (Table 4). Therefore, it seems that propionate metabolism in the liver caused the reduction in DMI in treatments B and BC compared with BB because hepatic propionate oxi-dation probably decreased with the supplementation of BP [25]. In addition, ruminal pH might be implicated in the control of feed intake, particularly in satiety, because VFAs
were more rapidly absorbed in the undissociated form at lower pH. In addition, substituting a high-fiber byproduct such as BP for grain may have resulted in the reduction of energy content of the ration or the limitation of intake by the physical filling effects of the diet.
The NFC sources such as BP have a similar range of NDF content as forages, although its particle length was generally smaller. In several experiments, these sources
Table 5 Chewing activity of cows fed on three total mixed rations of three total mixed rations containing three different sources of non-fiber carbohydrates
Items Treatments1 SEM
Pvalue
B BC BB
Eating, min/d 257.8a 232.8b 249.4ab 10.272 0.045
Rumination, min/d 338.9b 286.1c 356.1a 7.430 <0.001
Total chewing activity, min/d 596.7a 518.9b 605.5a 10.482 <0.001
Chewing behaviour per different nutrients, min/kg
Eating
DMI 12.19 11.08 11.174 0.552 0.200
NDF 33.70a 30.00b 29.10b 0.972 0.004
peNDFm 2
50.55a 45.29b 43.45b 2.430 0.033
peNDF> 8 3
97.93a 86.75b 92.97ab 4.431 0.002
peNDF> 1.18 4
50.85 45.20 43.37 4.294 0.063
NFC 31.36 28.46 29.42 1.154 0.088
Starch 54.97b 54.78b 76.98a 4.452 <0.001
NDSC5 89.52a 69.70b 55.55c 3.762 <0.001
Rumination
DMI 16.03a 13.61b 15.95a 0.350 <0.001
NDF 44.30a 36.87b 41.55a 1.561 <0.001
peNDFm 66.45
a
55.66b 62.04a 1.902 0.003
peNDF> 8 128.74
a
106.61b 132.74a 5.242 0.009
peNDF> 1.18 66.84
a
55.55b 61.93a 1.615 0.002
NFC 41.23a 34.98b 42.09a 0.812 <0.001
Starch 72.26b 67.32b 109.91a 6.692 <0.001
NDSC 117.67a 85.66b 79.31c 3.833 <0.001
Total chewing activity
DMI 28.23a 24.69c 26.13b 0.671 <0.001
NDF 78.00a 66.87c 68.06b 2.031 <0.001
peNDFm 117.00
a
100.95b 101.61b 3.292 <0.001
peNDF> 8 216.41
a
193.35b 225.71a 15.320 <0.001
peNDF> 1.18 117.69
a
100.76b 101.43b 3.462 0.006
NFC 72.59a 63.43c 68.94b 1.752 <0.001
Starch 127.23b 122.09b 186.88a 7.860 <0.001
NDSC 207.19a 155.36b 134.86c 6.744 <0.001
a, b, c
Means within a row with different subscripts differ (P< 0.05). 1
Treatments were diets containing barley + basal diet (B), barley and corn + basal diet (BC), and barley and beet pulp + basal diet (BB). 2
peNDFm= physically effective NDF, based on DM retained on sieve 1.18 mm [13]. 3
peNDF>8= physically effective NDF, determined as the proportion of DM retained on sieves of the original version of Penn State particle separator [10]. 4
peNDF>1.18= physically effective NDF, determined as the proportion of DM retained on sieves of the new version of Penn State particle separator [11]. 5
were substituted with forage or grain in diets and then the DMI was measured [3,5,6,22]. When DMI is regu-lated by ruminal distension, its substitution with forage in diets results in an increase in DMI, whereas its substi-tution with grain decreases DMI [2,4,13]. However, non-forage fiber sources showed inconsistent effects on DMI when substituted with either forage or grain in the diets of lactating cows. In the current experiment, the physical characteristics of the diets were similar; therefore, it seems that these do not differ in their relative filling ef-fects. In treatment BB, the DMI was not regulated by ru-minal distension [3,25]. The greater concentration of propionate in the ruminal liquid in treatment B com-pared with treatments BC and BB suggests that stimu-lated propionate receptors in the ruminal region may have controlled satiety and DMI, because propionate is more hypophagic than acetate, resulting in a lower DMI in treatment B versus treatments BC and BB [19,26].
Partially replacing barley with BP in the dairy cow diet resulted in an increase in total digestibility of DM, NDF, and EE, and a decrease in the digestibility of NFC. How-ever, partially replacing barley with corn in the dairy cow diets showed minimal effects on total digestibility. Un-fortunately, total digestibility of starch was not measured in this study. In the present study, decreased fiber di-gestibility in treatment B using barley was consistent with the reduction in rumination time, ruminal pH, and acetate to propionate ratio. The consumption of diets rich in NDSC imparted positive effects on ruminal di-gestion. In addition, the results of this experiment might be influenced by differences in the digestible NDF of the
treatment diet and not simply the source of NFC, as im-plied in the objectives of this study.
Differences in digestible NDF rations or starch, NDSC, and sugar content were associated with several parame-ters, especially acetate and propionate concentrations and their ratio in the rumen, as well as milk fat and pro-tein content. These were significantly different among treatments (P< 0.001) and treatment BB showed the highest intake of potentially digestible fiber or NDSC. Previous studies have confirmed that animal intake re-sponse to supplemented starch- or pectin-rich feeds remained the same, although changes in digestibilities have been observed. Valk et al. [22] reported that cows fed on corn consumed more DM and produced more milk than cows fed on BP. However, DMI and digestibil-ity of NDF were higher in cows fed on BP compared with those fed on corn meal.
The extent and rate of degradation is extremely vari-able among grains, byproducts, and different sources of NFC [6,27]. Variation in ruminal degradation of DM and OM across feeds has been reported to range from 29% to 90%, and 29% to 67%, respectively [27]. Total tract di-gestibility of corn ranges from 91.2% to 98.9%, depend-ing on the processdepend-ing method and grain type, with ground corn averaging 93.5% [28]. Ruminal degradation of starch in ground corn and ground barley ranged from 51% to 93%, and 42% to 91%, respectively [28]. In addition, ruminal degradation of DM and NDF in BP was 78% [29] and 94.1% [30], respectively. The poten-tially digestible fraction leaves the rumen either by deg-radation or by passage to the lower tract. Furthermore, feed characteristics and ruminal fractional passage rates would most likely vary; these tend to be higher with fine, non-forage fiber sources due to differences in ruminal retention time, which may be influenced by ruminal consistency [6]. The inclusion of BP in treatment BB re-sulted in a decrease in particulate passage rates, an in-crease in ruminal and total mean retention time, and a positive effect on ruminal and total digestion.
Rumen fermentation and kinetics
Variables of ruminal pH such as the outflow rate of digesta from the reticulorumen or ruminal indicate that retention time influences total fiber degradation. Rapidly fermenting carbohydrates such as sugars, NDSC, and some starches have the potential to rapidly decrease ruminal pH by virtue of the sheer mass of organic acids produced in this digestive region within a relatively short period of time. The ruminal pH corresponded to a higher rate of degradation and fer-mentation of barley grain that produced the highest con-centration of total VFA and propionate, lower acetate, and acetate: propionate ratio in treatment B compared with the other treatments (Table 4).
Table 6 Milk production and composition of cows fed on three total mixed rations containing three different sources of non-fiber carbohydrates
Item Treatments
1
SEM P
value
B BC BB
Yield of milk and milk components, kg/d
Milk 25.11 25.50 25.83 0.653 0.062
3.5% FCM 21.69 22.43 22.69 0.645 0.070
Fat 0.86b 0.90a 0.91a 0.033 0.013
Protein 0.81a 0.80b 0.80b 0.025 0.021
Lactose 1.17 1.20 1.16 0.020 0.062
Total solid 3.47 3.42 3.57 0.060 0.076
Milk composition, %
Fat 3.43b 3.55b 3.63a 0.087 <0.001
Protein 3.23a 3.15b 3.10b 0.030 0.001
Lactose 4.67 4.69 4.66 0.045 0.058
Total solid 11.93 11.89 12.01 0.098 0.060
a, b
Means within a row with different subscripts differ (P< 0.05). 1
Beet pulp, which is rich in pectin or NDSC, has been shown to yield relatively high amounts of acetic acid, thus resulting in an increase in the acetate to propionate ratio and less butyrate and lactate compared with other carbohydrate sources [31]. In addition, using twelve Friesian cows and sixteen heifers, Lees et al. [21] reported that in wk 9 and 16, the ruminal VFA propor-tions of cows fed on BP were higher for acetate and bu-tyrate and lower for propionate compared with cows fed on corn. The molar proportion of acetate in the current study and in previous investigations was probably altered by the tendency of BP to increase fiber intake and diges-tion. In contrast, Van Vuuren et al. [32] did not detect any differences in ruminal fluid pH or VFA concentra-tions in either experiment involving cows fed on corn products or BP and soybean hulls.
Changing the dietary source of NFC or NDSC and starch content of diet rations of lactating dairy cows has been shown to alter the ruminal environment and fer-mentation products. The effects, although not always consistent, have been observed on the proportions of VFA, the concentration of rumen NH3-N, and the extent
of fiber digestion with feeding starch, sugars, or NDSC-rich feeds [6]. The application of treatment BC resulted in a higher acidic pH, lower total VFA and proportion of propionate, and increased acetate concentration and acetate:propionate ratio in the ruminal fluid. Replacing BP with barley resulted in a higher acidic pH, increased acetate concentration in ruminal fluid, without any change in total VFA, and decreased proportion of propi-onate, valerate, isobutyrate, and isovalerate. Therefore, compared with barley, BP created more favorable condi-tions for microbial utilization of other carbohydrates in the rumen, at least in part due to the neutral pH. Decreasing daily mean ruminal pH, which was associ-ated with an increase in ruminal outflow rate of digesta, resulted in a decrease in ruminal NDF digestibility and total tract digestibility [2,8,9,33]. Zebeli et al. [9] showed a decrease in total tract NDF digestibility by increasing the outflow rate of particulate digesta, which was associ-ated with a decrease in ruminal mat consistency. It might be possible that a low digesta passage rate and high consistency in the ruminal mat due to inclusion of BP in the treatment BB was associated with a higher water holding capacity, greater entrapment of small particles, decreased outflow rate of solid digesta, and in-creased ruminal NDF digestibility in dairy cows.
The ruminal particulate passage rate was highest and lowest in treatments BC and BB, respectively. Because corn has a higher specific gravity than barley and BB, in-clusion of corn in the diet resulted in an increase in ru-minal passage rate and a decrease in rumen mean retention time (Table 4), and consequently, it decreased rumination time and total chewing activity. In contrast,
the higher total chewing activity in treatment BB might have resulted from the lower pH that was attributable to a high degradability of barley, which may have decreased the rate and extent of NDF digestion. In treatment BB, the BP did not result in a reduction in ruminal pH despite its high rate of NDF digestion because of the production of a higher concentration of acetate and lower propionate. However, it has a low functional spe-cific gravity and a large particle size [34], which could decrease its passage rate and increase its ruminal mean retention time and consequently, rumination and total chewing activity.
Two characteristics that affect the passage of digesta are density and particle size. In addition, there is a clear negative relationship between particle density and rumi-nal mean retention time. Particles with a specific gravity of lower than the critical size (1.18 mm) quickly pass out of the reticulorumen [8]. The specific gravity for BP was 1.152, whereas that of barley and corn grain were higher than 1.237 [34]. Therefore, inclusion of BP in treatment BB decreased particulate passage rates and increased ru-minal and total mean retention time. Particles with a density range of 1.2 to 1.5 showed the highest rate of passage in cattle and sheep [3,8,9]. Grain and its bypro-ducts (except for BP and soy hulls] showed a higher rate of passage from the rumen than forages because of the higher functional specific gravity and a particle size much smaller than that associated with stimulation of rumination. Therefore, most grains would have a faster rate of passage from the rumen than forages and other byproducts.
In treatment B, negative associative effects resulting from a lower pH due to a high degradability of barley would probably decrease the rate of digestion. Beet pulp did not reduce ruminal pH despite its high rate of NDF digestion [3]; however, it has a low functional specific gravity and a large particle size [34], which could decrease its passage rate and increase its ruminal mean retention time. Therefore, BP should have a very high ruminal digestibility [29], potentially supporting levels of ruminal microbial protein synthesis and milk produc-tion, similar to that observed in corn [31]. However, generalization of these results under different feeding conditions would be an oversimplification because dif-ferent dietary treatments can interact with each other, thus affecting passage rate.
Eating, ruminating, and chewing times
chewing activity significantly varied among treatments. Prolonged total chewing time due to the increase in diet-ary peNDF resulted from an increase in ruminating time rather than an increase in eating time.
Treatment BB showed the highest rumination time and total chewing activity. Total daily chewing time var-ied from 8.6, 9.9, and 10.1 h, with ruminating time at 5.6, 4.8, and 5.9 h in treatments B, BC, and BB, respect-ively. These values were within limits previously re-ported for dairy cows [9,13], although the mean chewing time per kg DM ingested was less than 30 min, contrary to the recommendations of Mertens [13], who proposed values equal to or exceeding 30 min/kg DM intake as suitable for limiting the risk of digestive disorders. Eat-ing time per day and per kilogram of DMI increased with the supplementation of BP. As diet NDF intake in-creased with added BP in the current study, a decrease in time eating per kilogram of NDF was observed. How-ever, no effect of BP substitution for corn on time eating per day or per kilogram of DMI was reported [2,13]. Tafaj et al. [2] and Zebeli et al. [9] have previously shown that the fiber content (NDF or forage NDF) and non-fiber carbohydrates in the diet affected daily chewing and rumination activities. Forage content remained the same across treatments; therefore, the nature of NFC or starch and NDSC content impacted the rate of feed in-take, ruminal mean retention time, rumination time, and total chewing activity.
Milk production
Although milk yield was not altered, replacing corn and BP with barley in diets resulted in an increase in milk fat (yield and percentage), and a decrease in protein con-centration (yield and percentage; Table 6). Dietary BP can increase [27], decrease [22], or support milk yield, which have also been observed in cows fed on corn or barley [22,35]. In addition, intake may be improved [21], decreased [22,35], or remain the same [27,35] using BP. Various dietary carbohydrates can result in changes in ruminal fermentation and generate VFAs patterns that influence the hormonal status of the animal and poten-tially affect milk production and composition.
The increase in fat secretion in treatments BC and BB has been shown to elevate both acetate and acetate: propi-onate ratio in the rumen. However, treatments BC and BB did not alter ruminal concentrations of either the total VFA or butyrate. Mansfield et al. [31] previously showed a higher milk fat concentration (3.82 vs. 3.64), whereas milk protein (3.01% vs. 2.90%) and yield were lower in cows fed on the BP diet compared with the corn diet. The fat content of milk was enhanced in treatment BB, which can be directly attributed to the increase in fiber intake and digestion in cows and the molar proportion of acetate in the rumen. Consistent with the current experiment, milk fat increased
in cows fed on the BP diet as a replacement for grain [22,31] due to the higher fiber intake and greater acetate concentrations in the rumen. It seems that the higher milk fat observed in treatment BB was due to the increase in intake of digestible NDF and NDSC, ruminal mean reten-tion time, ruminareten-tion time, total chewing activity, ruminal acetate concentration, and ruminal pH.
A decrease in milk CP content and yield was observed when corn and BP were substituted with barley. This finding was confirmed by Mansfield et al. [31], but was in contrast to the findings of Valk et al. [22]. In contrast to the current experiment, a lower intake of CP, lower NH3-N concentrations in the rumen, and lower CP
degradability for cows fed on BP was observed, com-pared with that in cows fed on corn [20] or barley [33]. The consumption of carbohydrates such as NDSC that are more extensively fermented in the rumen may im-prove the utilization of the NPN through the stimulation of microbial protein synthesis. In contrast, when NH3-N
concentrations in the rumen cannot meet microbial re-quirements, the fermentation of fiber is reduced and the animal responds with a lower intake and digestibility. Total VFA concentration in treatments BC and BB were observed to decrease. The lower total rumen VFA is an indicator of lower ruminal fermentation of fiber that limited milk protein yield. Huhtanen [27], Rooke et al. [36], and Chcster-Jones et al. [20] previously showed that BP supports VFA concentrations in the rumen simi-lar to those for corn and barley grain, whereas VFA con-centrations decreased in some situations [6]. In addition, NFC sources that were used in the current experiment varied in their DM rate and extent degradability, support of microbial yield, and supply of protein to the small intestine because microbial CP yield is influenced by carbohydrate and nitrogen sources, rate of carbohydrate fermentation, bacterial growth rate, ruminal dilution rate, and pH [22].
Conclusion
The results of this study indicate that changing dietary NFC or starch and NDSC that possess a different level of degradability may alter intake, ruminal mat consistency, chewing activity, ruminal environment, and retention time or passage rate, and lactation performance. However, stud-ies on the optimal concentrations of NFC from different sources, in combination with other dietary components, are warranted to monitor the lactation performance of dairy cows.
Competing interests
The authors declare that they have no competing interests.
Authors’contributions
Received: 4 June 2013 Accepted: 28 December 2013 Published: 13 January 2014
References
1. Grant RJ:Interactions among forages and non-forage fiber sources.
J Dairy Sci1997,80:1438–1446.
2. Tafaj M, Zebeli Q, Baes C, Steingass H, Drochner W:A meta-analysis examining effects of particle size of total mixed rations on intake, rumen digestion and milk production in high yielding dairy cows in early lactation.Anim Feed Sci Technol2007,138:137–161.
3. Varga AG:Soluble carbohydrates for lactating dairy cows, Proceeding of Tri-State Dairy Nutrition Conference. Columbus: The Ohio State University; 2003:59–73.
4. National Research Council (NRC):Nutrient Requirements of Dairy Cattle, 7th rev.Washington, DC: Natl. Acad. Sci; 2001.
5. Hall MB, Hoover WH, Jennings JP, Webster TKM:A method for partitioning neutral detergent-soluble carbohydrates.J Sci Food Agric1999, 79:2079–2086.
6. Larson CC:The effects of non-fiber carbohydrate sources and protein degrad-ability on performance of Holstein cows, Ph.D. Thesis. University of Florida: Department of Animal Sci; 2003.
7. American Society of Agricultural Engineers:Method of determining and expressing particle size of chopped forage (S424.1).70th edition. St. Joseph, MI: Am Society Agric Engineering; 2002:619–921.
8. Teimouri Yansari A, Primohammadi R:Effect of particle size of alfalfa hay and reconstitution with water on intake, digestion, and milk production in Holstein dairy cows.Animal2009,3:218–227.
9. Zebeli Q, Dijkstra J, Tafaj M, Steingass H, Ametaj BN, Drochner W:Modeling the adequacy of dietary fiber in dairy cows based on the responses of ruminal pH and milk fat production to composition of the diet.J Dairy Sci2008,91:2046–2066.
10. Lammers BP, Buckmaster DR, Heinrichs AJ:A simple method for the analysis of particle sizes of forages and total mixed rations.J Dairy Sci
1996,79:922–928.
11. Kononoff PJ:The effect of ration particle size on dairy cows in early lactation, Ph.D. Thesis. The Pennsylvania State Univ: Department of Animal Sci; 2002. 12. Van Soest PJ, Robertson JB, Lewis BA:Methods for dietary fiber, neutral
detergent fiber, and non-starch polysaccharide in relation to animal nutrition.J Dairy Sci1991,74:3583–3597.
13. Mertens DR:Creating a system for meeting the fiber requirements of dairy cows.J Dairy Sci1997,80:1463–1481.
14. Association of Official Analytical Chemists:Official Methods of Analysis, Volume 1. 17th edition. Arlington, VA: AOAC; 2002:1–75.
15. Merchen NR, Firkins JL, Berger LL:Effect of intake and forage level on ruminal turn over rates, bacterial protein synthesis and duodenal amino acid flows in sheep.J Anim Sci1986,62:216–224.
16. Uden P, Colucci E, Van Soest PJ:Investigation of chromium, cerium, and cobalt as markers in digesta rate of passage studies.J Sci Food Agric
1980,31:625–632.
17. Grovum WL, Williams VJ:Rate of passage of digesta in sheep 4: Passage of markers through the alimentary tract and the biological relevance of rate-constants derived from changes in concentration of markers in feces.Br J Nutr1973,30:231–242.
18. User’s Guide SAS:Statistics, version 8.2.Cary, NC: SAS Inst. Inc; 1998. 19. Broderick GA, Luchini ND, Radloff WJ, Varga GA, Ishler VA:Effect of replacing
dietary starch with sucrose on milk production in lactating dairy cows.U.S: Dairy Forage Research Center 2000–2001 Research Report; 2002:116–118. 20. Chester-Jones H, Stern MD, Metwally HM, Linn JG, Ziegler DM:Effects of dietary protein-energy interrelationships on Holstein steer performance and ruminal bacterial fermentation in continuous culture.J Anim Sci
1991,69:4956–4966. 69.
21. Lees JA, Oldham ID, Haresign W, Gamsworthy PC:The effect of patterns of rumen fermentation on the response by dairy cows to dietary protein concentration.Br J Nutr1990,63:177–187.
22. Valk H, KleinPoelhuis HW, Wentink HJ:Effects of fibrous and starchy carbohydrates in concentrates as supplements in a herbage-based diet for high yielding dairy cows.Neth J Agric Sci1990,38:475–486. 23. Friggens NC, Emmans GC, Robertson S, Chamberlain DG, Whittemore CT,
Oldham JD:The lactational responses of dairy cows to the amount of feed and to the source of carbohydrate energy.J Dairy Sci1995, 78:1734–1744.
24. Leiva E, Hall MB, Van Horn HH:Performance of dairy cattle fed citrus pulp or corn products as sources of neutral detergent-soluble carbohydrates.
J Dairy Sci2000,83:2866–2875.
25. Allen MS:Effects of diet on short-term regulation of feed intake by lactating dairy cattle.J Dairy Sci2000,83:1598–1624.
26. Broderick GA, Mertens DR, Simons R:Efficacy of carbohydrate sources for milk production by cows fed diets based on alfalfa silage.J Dairy Sci
2002,8:1767–1776.
27. Huhtanen P:The effect of dietary inclusion of barley, unmolassed sugar beet pulp and molasses on milk production, digestibility and digesta passage in dairy cows given silage based diet.J Sci Food Agric1987, 59:l01–l111.
28. Huntington GB:Starch utilization by ruminants: from basics to the bunk.
J Anim Sci1997,75:852–867.
29. Torrent J, Johnson DE, Kujawa MA:Co-product fiber digestibility: kinetic and in vivo assessment.J Anim Sci1994,72:790–795.
30. DePeters EJ, Fadel JG, Arosemena A:Digestion kinetics of neutral detergent fiber and chemical composition within some selected by-product feedstuffs.Anim Feed Sci Technol1991,67:127–140. 31. Mansfield HR, Stern MD, Otterby DE:Effects of beet pulp and animal
by-products on milk yield and in vitro fermentation by rumen microorganisms.J Dairy Sci1994,77:205–216.
32. Van Vuuren AM, Van Der Koelen CJ, Vroons-De Bruin J:Ryegrass versus corn starch or beet pulp fiber diet effects of digestion and intestinal amino acids in dairy cows.J Dairy Sci1993,76:2692–2700.
33. Teimouri Yansari A, Valizadeh R, Naserian A, Christensen DA, Yu P, Eftekhari Shahroodi F:Effects of alfalfa particle size and specific gravity on chewing activity, digestibility, and performance of Holstein dairy cows.
J Dairy Sci2004,87:3912–3924.
34. Bhatti SA, Firkins JL:Kinetics of hydration and functional specific gravity of fibrous feed by-products.J Anim Sci1995,73:1449–1458.
35. DeVisser H, Van der Togh PL, Tamminga S:Structural and nonstructural carbohydrates in concentrate supplements of silage-based dairy cow rations. 1. Feed intake and milk production.Neth J Agric Sci1990, 38:487–497.
36. Rooke JA, Rymer C, Maya FM, Armstrong DG:Effect of including barley or molassed sugar beet feed in grass silage diets on their digestion by cattle and sheep.J Sci Food Agric1992,48:475–489.
doi:10.1186/2049-1891-5-6
Cite this article as:Poorkasegaran and Yansari:Effects of different sources of carbohydrates on intake, digestibility, chewing, and performance of Holstein dairy cows.Journal of Animal Science and Biotechnology20145:6.
Submit your next manuscript to BioMed Central and take full advantage of:
• Convenient online submission
• Thorough peer review
• No space constraints or color figure charges
• Immediate publication on acceptance
• Inclusion in PubMed, CAS, Scopus and Google Scholar
• Research which is freely available for redistribution