R E S E A R C H
Open Access
The effect of increased atmospheric
temperature and CO
2
concentration during crop
growth on the chemical composition and
in vitro
rumen fermentation characteristics of wheat straw
Xiangyu He
1, Yanping Wu
1, Min Cai
1, Chunlong Mu
1, Weihong Luo
2, Yanfen Cheng
1*and Weiyun Zhu
1Abstract
This experiment was conducted to investigate the effects of increased atmospheric temperature and CO2
concentration during crop growth on the chemical composition andin vitrorumen fermentation characteristics of wheat straw. The field experiment was carried out from November 2012 to June 2013 at Changshu (31°32′93″N, 120°41′88″E) agro-ecological experimental station. A total of three treatments were set. The concentration of CO2 was increased to 500μmol/mol in the first treatment (CO2group). The temperature was increased by 2 °C in the second treatment (TEM group) and the concentration of CO2and temperature were both increased in the third treatment (CO2+ TEM group). The mean temperature and concentration of CO2in control group were 10.5 °C and 413μmol/mol. At harvesting, the wheat straws were collected and analyzed for chemical composition andin vitro digestibility. Results showed that dry matter was significantly increased in all three treatments. Ether extracts and neutral detergent fiber were significantly increased in TEM and CO2+ TEM groups. Crude protein was significantly decreased in CO2+ TEM group.In vitrodigestibility analysis of wheat straw revealed that gas production was significantly decreased in CO2and CO2+ TEM groups. Methane production was significantly decreased in TEM and CO2+ TEM groups. Ammonia nitrogen and microbial crude protein were significantly decreased in all three treatments. Total volatile fatty acids were significantly decreased in CO2and CO2+ TEM groups. In conclusion, the chemical composition of the wheat straw was affected by temperature and CO2and thein vitrodigestibility of wheat straw was reduced, especially in the combined treatment of temperature and CO2.
Keywords:Chemical composition, CO2,In vitrodigestibility, Temperature, Wheat straw
Introduction
Straw is widely used in China for ruminant production and serves as a potential nutrition source. It undergoes diges-tion by ruminal microbes [1]. Temperature and CO2levels
are important factors regulating crop growth. The atmos-pheric temperature and concentrations of CO2 have
in-creased in the past decades [2]. CO2concentrations have
increased by about 40 % since pre-industrial times and
reached 391 μmol/mol in 2011 [2]. The increases in
temperature and CO2concentrations have had a significant
impact on crop production and its biological variables, such as the lengths of crop growth periods and the crop cycle [3]. In general, higher CO2 concentrations increase
plant production due to higher rates of photosynthesis and water utilization and reduces grain protein concentration, which results in lower grain quality [4]. Meanwhile, the duration of a plant’s developmental stages is extremely sen-sitive to climate conditions, especially temperature [5]. Experimental warming was shown to shorten phenological stages in wheat, resulting in a 9 % yield decrease per 1 °C increase in temperature [6]. However, limited data are available about the effect of warming and enriched CO2on
the nutrient components of wheat straw.
In vitrotechnique has been used as a measure of rumi-nal degradation of feeds [7, 8] and as an indicator of the
* Correspondence:[email protected]
1
Jiangsu Key Laboratory of Gastrointestinal Nutrition and Animal Health, Laboratory of Gastrointestinal Microbiology, Nanjing Agricultural University, Nanjing 210095, China
Full list of author information is available at the end of the article
digestible dry matter intake (DMI) and growth rate for cattle that are fed cereal straws [9, 10]. This technique primarily measures digestion of soluble and insoluble carbohydrates [7], the amount of gas produced from a feed on incubation, and production of volatile fatty acids, which are a major source of energy for ruminants. This technique also has the potential to reveal associative effects between feeds [10–12]. Therefore, the in vitro fer-mentation technique was employed to evaluate the fermen-tation of straw by ruminal microbes. Due to the different abilities of ruminal microbiota to utilize nutrients [13, 14], the potential difference in nutrient composition in straw may affect microbial fermentation. Thus, this research sup-ported that the potential difference in nutrient component caused by temperature and CO2variation may also change
the utilization of straw by ruminal microbiota.
We hypothesized that an increase in temperature and CO2 may affect the nutrient composition of straw and
its utilization by ruminal microbiota. The objective of this study was to investigate the effects of increased
at-mospheric temperature and CO2 concentration during
crop growth on the chemical composition and in vitro fermentation characteristics of wheat straw, which will help to improve the utilization and functionality of wheat straw for ruminants.
Materials and methods Material substrates
The field experiment was carried out at Changshu (31°32′ 93″N, 120°41′88″E) agro-ecological experimental station, Changshu, Jiangsu Province, China, in a humid, semi-tropical climate. The mean annual temperature is 15.4 °C with rainfall of about 1,054 mm and solar radiation of 4,540 MJ/m2/y. The mean annual concentration of CO2
is 413 μmol/mol. The soil contained 14.2 g/kg organic matter, 1.1 mg/kg available N, 41.9 mg/kg Olsen-P and 93.3 mg/kg K2O.
The high-yield winter wheat (Triticum aestivum L.) cultivar, Yangmai 14, was sown on November 23, 2012 and harvested on June 13, 2013. A dose of 120 kg N per ha, 60 kg P2O5 per ha and 120 kg K2O per ha were
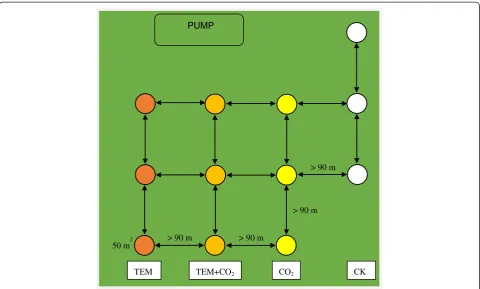
applied as basal fertilizer before sowing and another 120 kg N/ha was top-dressed at jointing following the local wheat management practices. A total of three treatment groups and one control group were set. Each group had three replicates with a randomized complete block design and the area of each replicate plot was 50 m2. In order to avoid the cross-contamination, the dis-tances between plots were more than 90 m (Fig. 1). The first treatment (CO2group) was to increase the
concentra-tion of CO2to 500μmol/mol by pumping pure CO2into
the ring plot via perforated pipes surrounding the ring from a commercial liquid supplier. The second treatment (TEM group) was to increase the temperature by 2 °C
with an infrared heater over the crop canopy. The third treatment (CO2+ TEM group) was to increase both CO2
concentration and temperature as described in the first
two treatments. Li-COR CO2 sensors and thermometer
were both equipped over canopy and around the ring to automatically control the CO2 pumping and canopy air
heating, respectively. The control group (CK) was sur-rounded by the same ring plot without any treatment, with the mean temperature of 10.5 °C and 413μmol/mol of CO2.
At harvesting, the wheat crop was cut above 40–50 cm and the grains were removed with wheat harvester (Lovol, GF60 (4LZ-6 F), China). The whole wheat straw with des-iccated leaves were collected and dried in a forced-air oven (Yiheng, PH070, China) for 24 h at 60 °C and then grounded and filtered by a 0.85 mm mesh sieve screen before use.
Chemical analyses
Samples were analyzed for dry matter (DM, method 930.15), ash (method 942.05), ether extract (EE, method 920.39), crude protein (CP, method 984.13) according to AOAC (1990) [15]. CP was calculated as Kjeldahl N*6.25. Neutral detergent fiber (NDF), acid detergent fiber (ADF) and acid detergent lignin (ADL) were deter-mined by Van Soest et al.’s method [16]. Both ADF and NDF were expressed exclusive of residual ash. Lignin was determined by the solubilization of cellulose with sulfuric acid on the ADF residue [17]. NDF was ana-lyzed without the addition of sodium sulfite and heat stable α-amylase. Hemicellulose was calculated as the difference between NDF and ADF.
Rumen inocula and sample collection
Four rumen fistulated local goats were used for donor ani-mals. The diet was formulated to meet the maintenance requirement, which included 700 g/kg forage (Chinese wildrye) and 300 g/kg concentrate mixtures (200 g/kg ground corn, 70 g/kg soybean meal, 15 g/kg calcium hydrogen phosphate, 5 g/kg stone powder, 5 g/kg sodium chloride and 5 g/kg mineral and vitamin premix). Rumen fluids were collected into pre-warmed insulated flasks at 2 h after the morning feeding and immediately trans-ported to the laboratory.
All laboratory operations were performed under anaer-obic conditions by continuous flushing with CO2. The
amount of 10 ml rumen fluid, strained through four layers of cheesecloth under anaerobic conditions [18], was inoculated into pre-warmed bottles containing 50 ml medium [19] and 1 g wheat straw as a substrate. The medium was an anaerobic buffer/mineral solution con-taining per litre: NH4HCO30.8 g, NaHCO37 g, Na2HPO4
1.14 g, KH2PO41.24 g, MgSO4· 7H2O 0.12 g, CaCl2· 2H2O
FeCl3· 6H2O 0.008 g, L-Cysteine HCl 0.625 g, NaOH
0.16 g and resazurine 0.001 g. Cultures were incu-bated at 39 °C for 48 h without agitation. Each sam-ple was analyzed in triplicate as analytic replicates. Gas production and methane emission were measured at 2, 4, 6, 10, 12, 18, 24, 36 and 48 h using the pres-sure transducer technique [19]. Following readings, the head-space gas was vented, returning the pressure back to ambient conditions. Methane was measured
by injecting 30 μL of the head-space gas into gas
chromatograph (Shimadzu, GC-14B, Japan) equipped with thermal conductivity detector. The temperatures of the column, injector and flame ionization detector were 80, 100 and 120 °C, respectively. 99.99 % me-thane was used as external standard. At the end of 24 and 48 h, pH was measured immediately upon re-moving the crimp seals and stoppers from the bottles, and approximately 10 mL of supernatant was col-lected for the analysis of VFAs, ammonia nitrogen
(NH3-N), and microbial crude protein (MCP). The
substrate residues were collected for the determin-ation of DM, NDF, and ADF, and the corresponding dry matter digestibility (DMD), neutral detergent fiber digestibility (NDFD), and acid detergent fiber digest-ibility (ADFD) were calculated.
Determination of pH and fermentation end products
Culture pH was measured by a pH meter (Schott, Germany). The VFAs were determined by gas chromatog-raphy (Shimadzu, GC-14B, Japan) according to Mao et al.
[20]. The NH3-N concentration was measured by the
indophenol method [21]. The MCP concentration was determined according to Makkar et al. [22] by spectro-photometer (Thermo Fisher Scientific, NanoDrop2000c, Wilmington, DE, USA).
Statistical analysis
The data were tabulated as mean ± standard error for all parameters and analyzed using the one-way analysis of variance (ANOVA) procedure with SPSS 17.0 (SPSS, Chicago, IL, USA). The differences of the means of the treatments were tested by using Duncan’s new multiple range test. The correlations between the different pa-rameters were established by calculating Pearson’s cor-relation coefficient. In all the analyses, significant effects were declared atP< 0.05.
Results
Chemical composition
The effects of temperature and CO2 on the chemical
composition of the wheat straw were shown in Table 1.
50 m2
TEM TEM+CO2 CO2 CK
PUMP
> 90 m > 90 m
> 90 m
> 90 m
Fig. 1Diagram of the experimental design (CK, control, concentration of CO2413μmol/mol and average temperature 10.5 °C; CO2, elevated CO2
group, concentration of CO2500μmol/mol; TEM, elevated temperature group, average temperature 12.5 °C; CO2+ TEM, elevated CO2and
ADF, hemicellulose, and acid detergent lignin were not affected in all treatments (P> 0.05). In CO2group, DM
increased significantly (P< 0.05). In TEM group, ash de-creased significantly (P< 0.05) and EE increased signifi-cantly (P< 0.05). In CO2+ TEM group, DM and NDF
significantly (P< 0.05) increased, while ash and CP sig-nificantly decreased (P< 0.05). Among the three treat-ments, the NDF content in CO2+ TEM was significantly
higher than that in TEM and CO2groups (P< 0.05). CP
and EE in CO2+ TEM and CO2were significantly lower
than that in TEM.
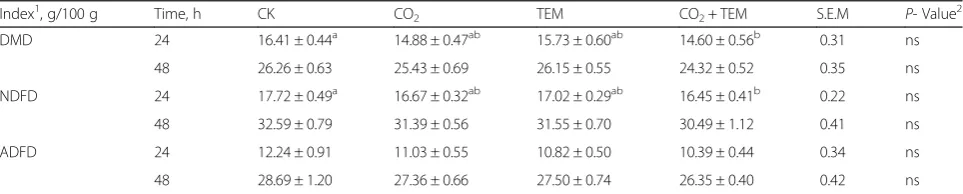
Apparentin vitroDM, NDF, and ADF digestibility
The apparentin vitroDM, NDF, and ADF digestibility of the wheat straw were presented in Table 2. DMD,
NDFD, and ADFD were not affected by CO2and TEM
treatments (P> 0.05). But DMD and NDFD were signifi-cantly (P< 0.05) decreased at 24 h in CO2+ TEM group,
and no significant difference was observed at 48 h.
In vitrogas and methane production
As shown in Table 3, the maximum gas production of 76.38 ± 1.28 mL was caused by CK during 48 h of incuba-tion, which was closely followed by TEM (73.63 ± 2.24 mL) and CO2 (68.16 ± 1.55 mL), while CO2+ TEM caused a
minimum of 66.44 ± 1.49 mL. GP was significantly de-creased in CO2and CO2+ TEM groups at 48 h (P< 0.05).
Among the three treatments, gas production in CO2+
TEM group was significantly lower than that in TEM (P< 0.05). During 48 h of incubation, the maximum me-thane production was caused by CO2 (27.58 ± 1.38 mL),
followed by CK (25.80 ± 1.15 mL), CO2+ TEM (20.67 ±
0.21 mL), and TEM (17.88 ± 0.77 mL). At 24 h, MP was significantly decreased in TEM group (P< 0.05). Among the three treatments, MP in CO2and CO2+ TEM groups
was significantly higher than that in TEM (P< 0.05). At 48 h, MP was significantly decreased in TEM and CO2+
TEM groups (P< 0.05). Among the three treatments, MP in CO2group was significantly higher than that in TEM and
CO2+ TEM groups (P< 0.05).
pH, NH3-N, MCP, and VFA
The pH varied in different groups, but was still in the normal range throughout the incubation, ranging from 6.56 to 6.69 (Table 3). The pH was significantly in-creased in CO2group at 24 h and in CO2+ TEM group
at 24 and 48 h (P< 0.05). Among the three treatments, the pH in TEM group was significantly lower than that in CO2group at 24 h and CO2+ TEM group at 24 and
48 h (P< 0.05). NH3-N was significantly decreased in all Table 1Composition of wheat straw under different treatments (dry matter basis)
Item, g/100 g CK CO2 TEM CO2+ TEM S.E.M P- Value
1
Dry matter 94.37 ± 0.11a 95.25 ± 0.31bc 94.60 ± 0.12ab 95.57 ± 0.24c 0.17 *
Crude ash 4.46 ± 0.10a 4.56 ± 0.14a 3.49 ± 0.13b 3.69 ± 0.13b 0.15 *
Crude protein 1.45 ± 0.05ab 1.29 ± 0.03bc 1.59 ± 0.06a 1.17 ± 0.06c 0.05 *
Ether extracts 0.70 ± 0.07b 0.57 ± 0.04b 0.92 ± 0.02a 0.64 ± 0.02b 0.04 *
Neutral detergent fiber 82.95 ± 0.03a 82.98 ± 0.19a 82.96 ± 0.23a 84.72 ± 0.16b 0.24 *
Acid detergent fiber 52.47 ± 0.76 52.52 ± 0.66 52.59 ± 0.46 53.96 ± 0.69 0.33 ns
Hemicellulose 30.48 ± 0.77 30.46 ± 0.84 30.65 ± 0.37 31.09 ± 0.28 0.27 ns
Acid detergent lignin 6.31 ± 0.24 6.45 ± 0.15 6.57 ± 0.13 7.02 ± 0.29 0.12 ns
CKcontrol, concentration of CO2413μmol/mol and average temperature 10.5 °C;CO2elevated CO2group, concentration of CO2500μmol/mol;TEMelevated
temperature group, average temperature 12.5 °C;CO2+TEM, elevated CO2and temperature group, i.e., concentration of CO2500μmol/mol, temperature 12.5 °C.
The same as below
a,b,c
Values within a column with different superscript letters are significantly different (P< 0.05)
1
ns = non-significant (p> 0.05), * = significant (P< 0.05)
Table 2Effects of CO2and temperature treatments on DM, NDF and ADF digestibility at 24 and 48 h of wheat straw
Index1, g/100 g Time, h CK CO2 TEM CO2+ TEM S.E.M P- Value2
DMD 24 16.41 ± 0.44a 14.88 ± 0.47ab 15.73 ± 0.60ab 14.60 ± 0.56b 0.31 ns
48 26.26 ± 0.63 25.43 ± 0.69 26.15 ± 0.55 24.32 ± 0.52 0.35 ns
NDFD 24 17.72 ± 0.49a 16.67 ± 0.32ab 17.02 ± 0.29ab 16.45 ± 0.41b 0.22 ns
48 32.59 ± 0.79 31.39 ± 0.56 31.55 ± 0.70 30.49 ± 1.12 0.41 ns
ADFD 24 12.24 ± 0.91 11.03 ± 0.55 10.82 ± 0.50 10.39 ± 0.44 0.34 ns
48 28.69 ± 1.20 27.36 ± 0.66 27.50 ± 0.74 26.35 ± 0.40 0.42 ns
1
DMDdry matter digestibility;NDFDNeutral detergent fiber digestibility;ADFDAcid detergent fiber digestibility
2
ns = non-significant (P> 0.05)
a,b
three treatments at 24 and 48 h (P< 0.05) and no signifi-cant difference was observed among the treatments. MCP was significantly decreased in all treatments at 48 h (P< 0.05) and in CO2 and CO2+ TEM groups at
24 h (P< 0.05). Among the three treatments, MCP in TEM group was significantly higher than that in CO2
and CO2+ TEM at 24 h (P< 0.05) and no significant
dif-ference was observed at 48 h.
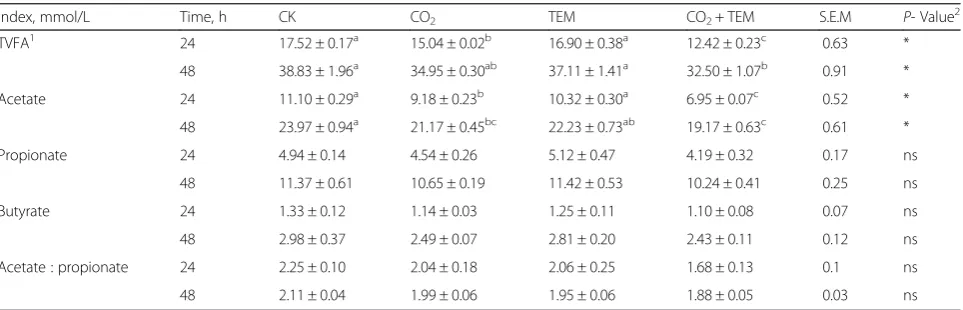
The effects of temperature and CO2on the
concentra-tion of VFA were shown in Table 4. The concentraconcentra-tions of propionate, butyrate, and the acetate: propionate ra-tion were not affected in all treatments (P> 0.05), while the concentration of TVFA was significantly decreased by the CO2+ TEM treatment (P< 0.05). Meanwhile, the
concentration of TVFA was significantly decreased by CO2at 24 h (P< 0.05). Among the three treatments, the
concentration of TVFA in CO2+ TEM was significantly
lower than that in CO2and TEM at 24 h (P< 0.05) and
significantly lower than that in TEM at 48 h (P< 0.05).
The concentration of acetate was significantly decreased in CO2and CO2+ TEM groups at 24 and 48 h (P< 0.05).
Among the three treatments, the concentration of acetate in TEM was significantly higher than that in CO2 and
CO2+ TEM at 24 h (P< 0.05), and it was significantly
higher than that in CO2+ TEM at 48 h.
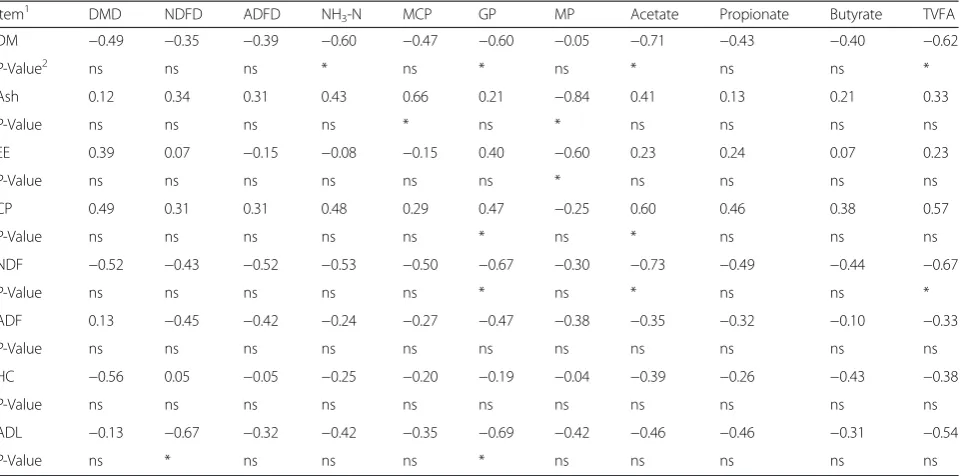
The correlation between chemical constituents and fermentation products of wheat straw after 48 h fermentation
The relationships between the chemical constituents and fermentation products of the wheat straw were shown in Table 5. DM was negatively correlated (P< 0.05) with NH3-N, GP, acetate, and the TVFA concentration. NDF
was negatively correlated (P< 0.05) with GP, TVFA, and acetate. ADL was negatively correlated (P< 0.05) with NDFD and GP. However, ash was positively correlated (P< 0.05) with the MCP concentration. CP was posi-tively correlated (P< 0.05) with GP, MP, and acetate.
Table 3Effects of CO2and temperature treatments onin vitropH, concentration of ammonia nitrogen (mg/100 ml) and microbial
crude (mg/100 mL) protein, gas and methane production at 24 and 48 h of wheat straw
Index1, g/100 g Time, h CK CO
2 TEM CO2+ TEM S.E.M P- Value2
pH 24 6.62 ± 0.01a 6.67 ± 0.01b 6.64 ± 0.01a 6.69 ± 0.01b 0.01 *
48 6.56 ± 0.01a 6.58 ± 0.01ab 6.56 ± 0.01a 6.61 ± 0.01b 0.01 *
NH3-N 24 3.34 ± 0.03a 3.22 ± 0.03b 3.24 ± 0.02b 3.24 ± 0.03b 0.30 *
(mg/100 mL) 48 5.17 ± 0.03a 4.60 ± 0.08b 4.71 ± 0.06b 4.55 ± 0.07b 0.08 *
MCP 24 8.29 ± 0.14a 7.13 ± 0.21b 8.31 ± 0.13a 7.09 ± 0.43b 0.21 *
(mg/100 mL) 48 10.46 ± 0.19a 7.93 ± 0.19b 8.63 ± 0.32b 7.72 ± 0.55b 0.36 *
Gas production (mL) 24 25.41 ± 0.71 25.78 ± 0.46 25.80 ± 1.25 23.51 ± 1.21 0.50 ns
48 76.38 ± 1.28a 68.16 ± 1.55bc 73.63 ± 2.24ab 66.44 ± 1.49c 1.41 *
Methane production (mL) 24 6.41 ± 0.10a 7.84 ± 0.59a 3.95 ± 0.58b 7.25 ± 0.69a 0.50 *
48 25.80 ± 1.15a 27.58 ± 1.38a 17.88 ± 0.77b 20.67 ± 0.21b 1.24 *
a,b
Values within a column with different superscript letters are significantly different (P< 0.05)
1
VFA: volatile fatty acid.2
ns = non-significant (P> 0.05)
Table 4Effects of CO2and temperature treatments onin vitroVFA at 24 and 48 h of wheat straw
Index, mmol/L Time, h CK CO2 TEM CO2+ TEM S.E.M P- Value2
TVFA1 24 17.52 ± 0.17a 15.04 ± 0.02b 16.90 ± 0.38a 12.42 ± 0.23c 0.63 *
48 38.83 ± 1.96a 34.95 ± 0.30ab 37.11 ± 1.41a 32.50 ± 1.07b 0.91 *
Acetate 24 11.10 ± 0.29a 9.18 ± 0.23b 10.32 ± 0.30a 6.95 ± 0.07c 0.52 *
48 23.97 ± 0.94a 21.17 ± 0.45bc 22.23 ± 0.73ab 19.17 ± 0.63c 0.61 *
Propionate 24 4.94 ± 0.14 4.54 ± 0.26 5.12 ± 0.47 4.19 ± 0.32 0.17 ns
48 11.37 ± 0.61 10.65 ± 0.19 11.42 ± 0.53 10.24 ± 0.41 0.25 ns
Butyrate 24 1.33 ± 0.12 1.14 ± 0.03 1.25 ± 0.11 1.10 ± 0.08 0.07 ns
48 2.98 ± 0.37 2.49 ± 0.07 2.81 ± 0.20 2.43 ± 0.11 0.12 ns
Acetate : propionate 24 2.25 ± 0.10 2.04 ± 0.18 2.06 ± 0.25 1.68 ± 0.13 0.1 ns
48 2.11 ± 0.04 1.99 ± 0.06 1.95 ± 0.06 1.88 ± 0.05 0.03 ns
a,b,c
Values within a column with different superscript letters are significantly different (P< 0.05)
1
Negative correlation (P< 0.05) was also observed be-tween EE and MP.
Discussion
In the present study, elevated temperature and CO2
levels were found to increase the DM, EE and NDF con-tents and reduce the ash and CP concon-tents. Rosenzweig et al. [23] reported that increasing the CO2
concentra-tion and temperature might lead to the increase of photosynthesis, carbohydrate fixation, respiration and transpiration in the plants. Increased photosynthesis and carbohydrate fixation might result in the increase of growth rate and plant biomass [24], which would lead to the increase of dry matter in the plants. Meanwhile, the increased respiration and transpiration would lead to the increase of total leaf area, which could increase the evap-oration of water, decrease the water content, and thus relatively increase the dry matter content in plants [25]. Carten et al. [26] reported that a combined increase in temperature and CO2 concentration could increase the
biomass of three genotypes ofLotus corniculatus. Hocking et al. [27] also showed that shoot to root dry matter ra-tions of both wheat and maize increased with CO2
enrich-ment. The allocation of nutrients in the plants was also affected by increasing temperature and CO2
concentra-tion. Asseng et al. [28] reported that temperature and CO2
increased the protein concentration of grain and affected the composition of amino acids [29]. As a result, the pro-tein concentration in straw would decrease and the NDF
content would increase. Erice et al. [30] reported that ele-vated temperature and CO2significantly reduced the CP
content of alfalfa and had the potential to enhance its NDF and ADF contents. Wayne et al. [31] also reported that elevated temperature and CO2reduced the CP
con-tent of leaves in yellow birch. Little is known about the ef-fects of elevated temperature on the content and distribution of EE in plants, it may be due to the increase of photosynthesis [32].
By usingin vitrofermentation, we found the digestibility and degradation of wheat straw decreased with the in-crease of temperature and CO2. The combined increase of
temperature and CO2 had the most significant impacts,
which was revealed by the decrease of DMD, NDFD, GP, MP and concentrations of NH3, MCP, TVFA and acetate.
Increase of CO2 decreased GP and concentrations of
NH3, MCP, TVFA and acetate. Increase of temperature
only decreased MP and the concentrations of NH3 and
MCP. The decrease of DMD and NDFD might be due to the decrease of CP and increase of DM and NDF in the CO2+ TEM group. Previous research demonstrated that a
high NDF level directly decreased in vitroDM and NDF disappearance of several ruminant feeds [33]. Iantcheva et al. [34] demonstrated a highly negative effect of NDF on the digestibility of grass hay. Elghandour et al. [35] also showed that the digestibility of four fibrous feeds de-creased under inde-creased DM and NDF levels.
We found that the combined increase of temperature and CO2 significantly decreased the concentration of Table 5Correlation between chemical composition andin vitrofermentation characteristics of wheat straw
Item1 DMD NDFD ADFD NH3-N MCP GP MP Acetate Propionate Butyrate TVFA
DM −0.49 −0.35 −0.39 −0.60 −0.47 −0.60 −0.05 −0.71 −0.43 −0.40 −0.62
P-Value2 ns ns ns * ns * ns * ns ns *
Ash 0.12 0.34 0.31 0.43 0.66 0.21 −0.84 0.41 0.13 0.21 0.33
P-Value ns ns ns ns * ns * ns ns ns ns
EE 0.39 0.07 −0.15 −0.08 −0.15 0.40 −0.60 0.23 0.24 0.07 0.23
P-Value ns ns ns ns ns ns * ns ns ns ns
CP 0.49 0.31 0.31 0.48 0.29 0.47 −0.25 0.60 0.46 0.38 0.57
P-Value ns ns ns ns ns * ns * ns ns ns
NDF −0.52 −0.43 −0.52 −0.53 −0.50 −0.67 −0.30 −0.73 −0.49 −0.44 −0.67
P-Value ns ns ns ns ns * ns * ns ns *
ADF 0.13 −0.45 −0.42 −0.24 −0.27 −0.47 −0.38 −0.35 −0.32 −0.10 −0.33
P-Value ns ns ns ns ns ns ns ns ns ns ns
HC −0.56 0.05 −0.05 −0.25 −0.20 −0.19 −0.04 −0.39 −0.26 −0.43 −0.38
P-Value ns ns ns ns ns ns ns ns ns ns ns
ADL −0.13 −0.67 −0.32 −0.42 −0.35 −0.69 −0.42 −0.46 −0.46 −0.31 −0.54
P-Value ns * ns ns ns * ns ns ns ns ns
1
DMdry matter;CPcrude protein;EEether extracts;NDFneutral detergent fiber;ADFacid detergent fiber;HChemicellulose;ADLacid detergent lignin;DMDdry digestibility;NDFDNDF digestibility;ADFDADF digestibility;GPgas production;MPmethane production;VFAvolatile fatty acid;NH3-Nammonia nitrogen;MCP
microbial crude protein
2
MCP during in vitrofermentation, which suggested that the numbers of microorganisms in the fermentation de-creased. The decrease of MCP might be related to the
decrease of NH3-N and microbial attachment to the
plant. Previous studies showed that a decreased concen-tration of NH3-N might result in the decrease of MCP
as NH3-N could be used for microbial protein synthesis
[36]. In addition, increased NDF might also lead to the decrease of microbial attachment to the plants [37].
The increase of NDF led to the decrease of soluble carbohydrate fractions in wheat straw, resulting in the de-crease of end products of microbial fermentation [38]. Gases (mainly CO2and methane) are important end
prod-ucts of the fermentation [39]. Sallam et al. [40] reported a negative correlation between cell wall fraction andin vitro gas production. Getachew et al. [33] also observed reduced gas production by increasing NDF content in the fermentation of several ruminant feeds. The negative rela-tionship between NDF level and gas production was also reported in the fermentation of tropical trees by Nsahlai et al. [41] and Larbi et al. [42]. Methane was mainly pro-duced via methanogenesis by methanogens such as
Methanobrevibacter smithii [43]. Besides the decreased digestibility of wheat straw, the increase of EE might be another reason for the decrease of methane production. Johnson et al. [44] reported that increased lipid content in the feed was thought to decrease methanogenesis through inhibition of protozoa, increase of propionic acid, and biohydrogenation of unsaturated fatty acids. Dohme et al. [45] also reported that lipid could inhibit the growth of methanogens directly through binding to the cell mem-brane and interrupting memmem-brane transport. Lee et al. [46] observed a negative relationship between methane production and EE in the fermentation of feed ingredients. A negative correlation between methane production and EE content was also observed in the present study, which implied that the EE might be a potential factor regulating methane production from the rumen.
The most important water soluble end products of the
fermentation are NH3-N and VFA representing the
metabolism of nitrogen and carbon [47]. The decrease of NH3-N was due to the decrease of the CP content of the
wheat straw. Chen et al. [48] suggested that NH3-N
con-centration was significantly affected by changing the levels of CP in cattle feed. Ghorbani et al. [49] reported that in-creased CP could increase the NH3-N concentration. The
production of VFA represented the main supply of metabolizable energy for ruminants [50]. Nsahlai et al. [41] and Larbi et al. [42] reported that a negative relationship between NDF level and VFA was observed in the fermen-tation of 23 browses of the genus Sesbania and fodder trees. In the present study, the decrease of VFA was also observed and it was mainly due to the decrease of acetate, as no significant difference was observed in the production
of propionate and butyrate. As summarized by Bergman [51], acetate was the major end product of microbial fer-mentation in the rumen and it contributed about 40 % of a ruminant’s daily energy requirements. Therefore, the de-crease in acetate production may indicate a reduction of energy supply for ruminants.
Conclusions
Elevated temperature and concentration of CO2changed
the chemical composition of wheat straw in an adverse fashion, which resulted in the decrease of digestibility and degradation of wheat straw. Most importantly, the decrease of the concentration of volatile fatty acids, es-pecially acetate, may reduce the energy source for rumi-nants, thus decreasing the performance of livestock.
Competing interests
The authors declared that they have no competing interests.
Authors’contributions
The research trials were planned and conducted by WHL, YFC and WYZ. The lab work was conducted by XYH, YPW and MC. XYH, CLM, YFC and WYZ prepared the manuscript. All authors read and approved the final manuscript.
Acknowledgements
This work was supported by the Special Fund for Agro-scientific Research in the Public Interest in China (No. 200903003). The authors group is grateful to thank Mr Chuang Cai from College of Agriculture of Nanjing Agricultural University for the assistance in maintaining the experiment system.
Author details
1Jiangsu Key Laboratory of Gastrointestinal Nutrition and Animal Health, Laboratory of Gastrointestinal Microbiology, Nanjing Agricultural University, Nanjing 210095, China.2College of Agriculture, Nanjing Agricultural University, Nanjing 210095, China.
Received: 20 January 2015 Accepted: 4 October 2015
References
1. Mahesh MS, Mohini M, Jha P, Sawant SP, Kundu SS, Kuhad RC. Nutritional evaluation of wheat straw treated with Crinipellis sp. in Sahiwal calves (Retracted article. See vol. 46, pp. 589, 2014). Tropical Animal Health And Production. 2013;45:1817–23.
2. Stocker T, Qin D, Plattner G, Tignor M, Allen S, Boschung J, et al. IPCC, 2013: Climate Change 2013: The Physical Science Basis. Contribution of Working Group I to the Fifth Assessment Report of the Intergovernmental Panel on Climate Change. Cambridge: Cambridge University Press; 2013.
3. Ye L, Xiong W, Li Z, Yang P, Wu W, Yang G, et al. Climate change impact on China food security in 2050. Agron Sustain Dev. 2013;33:363–74.
4. Ludwig F, Asseng S. Climate change impacts on wheat production in a Mediterranean environment in Western Australia. Agric Syst. 2006;90:159–79. 5. Cleland EE, Chuine I, Menzel A, Mooney HA, Schwartz MD. Shifting plant
phenology in response to global change. Trends In Ecology & Evolution. 2007;22:357–65.
6. Mitchell R, Mitchell V, Driscoll S, Franklin J, Lawlor D. Effects of increased CO2concentration and temperature on growth and yield of winter wheat
at two levels of nitrogen application. Plant Cell Environ. 1993;16:521–9. 7. Menke KH, Steingass H. Estimation of the energetic feed value obtained
from chemical analysis andin vitrogas production using rumen fluid. Anim Res Dev. 1988;28:7–55.
8. Getachew G, Blummel M, Makkar HPS, Becker K.In vitrogas measuring techniques for assessment of nutritional quality of feeds: a review. Animal Feed Science And Technology. 1998;72:261–81.
during a wet and a dry season, using thein vitrocumulative gas production technique. Animal Feed Science And Technology. 1996;57:183–94. 10. Liu JX, Susenbeth A, Sudekum KH.In vitrogas production measurements to
evaluate interactions between untreated and chemically treated rice straws, grass hay, and mulberry leaves'. J Anim Sci. 2002;80:517–24.
11. Suharti S, Astuti DA, Wina E, Toharmat T. Rumen microbial population in the in vitrofermentation of different ratios of forage and concentrate in the presence of whole lerak (Sapindus rarak) fruit extract. Asian Australas J Anim Sci. 2011;24:1086–91.
12. Tahir MN, Hetta M, Larsen M, Lund P, Huhtanen P.In vitroestimations of the rate and extent of ruminal digestion of starch-rich feed fractions compared toin vivodata. Anim Feed Sci Technol. 2013;179:36–45.
13. Scott K, Duncan S, Louis P, Flint H. Nutritional influences on the gut microbiota and the consequences for gastrointestinal health. Biochem Soc Trans. 2011;39:1073.
14. Wanapat M, Cherdthong A. Use of real-time PCR technique in studying rumen cellulolytic bacteria population as affected by level of roughage in swamp buffalo. Curr Microbiol. 2009;58:294–9.
15. Horwitz W. Official methods of analysis of AOAC International. Gaithersburg: AOAC International; 2000.
16. Vansoest PJ, Robertson JB, Lewis BA. Methods for Dietary Fiber, Neutral Detergent Fiber, And Nonstarch Polysaccharides In Relation To Animal Nutrition. J Dairy Sci. 1991;74:3583–97.
17. Robertson J, Van Soest P. The detergent system of analysis and its application to human foods. In: The analysis of dietary fiber in food. 1981. p. 123. 18. Zhu W-Y, Kingston-Smith A, Troncoso D, Merry R, Davies D, Pichard G,
et al. Evidence of a role for plant proteases in the degradation of herbage proteins in the rumen of grazing cattle. J Dairy Sci. 1999;82:2651–8.
19. Theodorou MK, Williams BA, Dhanoa MS, McAllan AB, France J. A simple gas production method using a pressure transducer to determine the fermentation kinetics of ruminant feeds. Anim Feed Sci Technol. 1994;48:185–97.
20. Mao SY, Zhu WY, Wang QJ, Yao W. Effect of daidzein onin vitro fermentation by microorganisms from the goat rumen. Anim Feed Sci Technol. 2007;136:154–63.
21. Weatherburn M. Phenol-hypochlorite reaction for determination of ammonia. Anal Chem. 1967;39:971–4.
22. Makkar H, Sharma O, Dawra R, Negi S. Simple determination of microbial protein in rumen liquor. J Dairy Sci. 1982;65:2170–3.
23. Rosenzweig C, Tubiello FN. Effects of changes in minimum and maximum temperature on wheat yields in the central US A simulation study. Agric For Meteorol. 1996;80:215–30.
24. Xie Z, Zhu J, Pan H, Ma H, Liu G, Georg C, et al. Stimulated rice growth and decreased straw quality under free air CO2enrichment (FACE). In: The
Proceedings of the China Association for Science and Technology. New York: Science Press Beijing; 2004. p. 640–5.
25. Adams RM, Hurd BH, Lenhart S, Leary N. Effects of global climate change on agriculture: an interpretative review. Clim Res. 1998;11:19–30.
26. Carter E, Theodorou M, Morris P. Responses of Lotus corniculatus to environmental change. New Phytol. 1997;136:245–53.
27. Zhang X-C, Nearing M, Garbrecht J, Steiner J. Downscaling monthly forecasts to simulate impacts of climate change on soil erosion and wheat production. Soil Sci Soc Am J. 2004;68:1376–85.
28. Asseng S, Jamieson P, Kimball B, Pinter P, Sayre K, Bowden J, et al. Simulated wheat growth affected by rising temperature, increased water deficit and elevated atmospheric CO2. Field Crop Res. 2004;85:85–102.
29. Högy P, Fangmeier A. Effects of elevated atmospheric CO2on grain quality
of wheat. J Cereal Sci. 2008;48:580–91.
30. Erice G, Irigoyen JJ, Pérez P, Martínez-Carrasco R, Sánchez-Díaz M. Effect of elevated CO2, temperature and drought on dry matter partitioning and
photosynthesis before and after cutting of nodulated alfalfa. Plant Sci. 2006;170:1059–67.
31. Wayne P, Reekie E, Bazzaz F. Elevated CO2ameliorates birch response to
high temperature and frost stress: implications for modeling climate-induced geographic range shifts. Oecologia. 1998;114:335–42.
32. Tao F, Yokozawa M, Xu Y, Hayashi Y, Zhang Z. Climate changes and trends in phenology and yields of field crops in China, 1981–2000. Agric For Meteorol. 2006;138:82–92.
33. Getachew G, Robinson P, DePeters E, Taylor S. Relationships between chemical composition, dry matter degradation andin vitrogas production of several ruminant feeds. Anim Feed Sci Technol. 2004;111:57–71.
34. Iantcheva N, Steingass H, Todorov N, Pavlov D. A comparison ofin vitrorumen fluid and enzymatic methods to predict digestibility and energy value of grass and alfalfa hay. Anim Feed Sci Technol. 1999;81:333–44.
35. Elghandour MM, Chagoyán JCV, Salem AZ, Kholif AE, Castañeda JSM, Camacho LM, et al. Effects of Saccharomyces cerevisiae at direct addition or pre-incubation onin vitrogas production kinetics and degradability of four fibrous feeds. Ital J Anim Sci. 2014;13(2):295–301.
36. Davila A-M, Blachier F, Gotteland M, Andriamihaja M, Benetti P-H, Sanz Y, et al. Intestinal luminal nitrogen metabolism: role of the gut microbiota and consequences for the host. Pharmacol Res. 2013;68:95–107.
37. Sun Y, Mao S, Zhou L, Zhu W. Effect of substrates with different lignin content on rumen fungal attachment and fermentation in the rumen of goats. Acta Prataculturae Sinica. 2004;14:56–61.
38. Chumpawadee S, Chantiratikul A, Chantiratikul P. Chemical compositions and nutritional evaluation of energy feeds for ruminant usingin vitrogas production technique. Pak J Nutr. 2007;6:607–12.
39. Wolin MJ. The rumen fermentation: a model for microbial interactions in anaerobic ecosystems. In: Advances in microbial ecology. New York: Springer; 1979. p. 49–77.
40. Sallam S, Nasser M, El-Waziry A, Bueno I, Abdalla A. Use of anin vitrorumen gas production technique to evaluate some ruminant feedstuffs. J Appl Sci Res. 2007;3:34–41.
41. Nsahlai IV, Siaw DEKA, Osuji PO. The Relationships Between Gas-Production And Chemical-Composition Of 23 Browses Of the Genus Sesbania. Journal Of the Science Of Food And Agriculture. 1994;65:13–20.
42. Larbi A, Smith JW, Kurdi IO, Adekunle IO, Raji AM, Ladipo DO. Chemical composition, rumen degradation, and gas production characteristics of some multipurpose fodder trees and shrubs during wet and dry seasons in the humid tropics. Animal Feed Science And Technology. 1998;72:81–96. 43. Denman SE, Tomkins NW, McSweeney CS. Quantitation and diversity
analysis of ruminal methanogenic populations in response to the antimethanogenic compound bromochloromethane. FEMS Microbiol Ecol. 2007;62:313–22.
44. Johnson KA, Johnson DE. Methane emissions from cattle. J Anim Sci. 1995;73:2483–92.
45. Dohme F, Machmüller A, Wasserfallen A, Kreuzer M. Ruminal
methanogenesis as influenced by individual fatty acids supplemented to complete ruminant diets. Lett Appl Microbiol. 2001;32:47–51.
46. Lee H, Lee S, Kim J, Oh Y, Kim B, Kim C, et al. Methane production potential of feed ingredients as measured byin vitrogas test. Asian Australasian Journal of Animal Sciences. 2003;16:1143–50.
47. Cecava M, Merchen N, Berger L, Mackie R, Fahey G. Effects of dietary energy level and protein source on nutrient digestion and ruminal nitrogen metabolism in steers. J Anim Sci. 1991;69:2230–43.
48. Chen S, Paengkoum P, Xia X, Na-Lumpang P. Effects of dietary protein on ruminal fermentation, nitrogen utilization and crude protein maintenance in growing Thai-indigenous beef cattle fed rice straw as roughage. J Anim Vet Adv. 2010;9:2396–400.
49. Ghorbani B, Ghoorchi T, Amanlou H, Zerehdaran S. 8 Effects of Using Monensin and Different Levels of Crude Protein on Milk Production, Blood Metabolites and Digestion of Dairy Cows. Asian Australasian Journal of Animal Science. 2011;24:65.
50. Mackie RI, Bryant MP. Acetogenesis and the rumen: syntrophic relationships. In: Acetogenesis. Springer: Springer; 1994. p. 331–64.
51. Bergman E. Energy contributions of volatile fatty acids from the gastrointestinal tract in various species. Physiol Rev. 1990;70:567–90.
Submit your next manuscript to BioMed Central and take full advantage of:
• Convenient online submission
• Thorough peer review
• No space constraints or color figure charges
• Immediate publication on acceptance
• Inclusion in PubMed, CAS, Scopus and Google Scholar
• Research which is freely available for redistribution