R E S E A R C H A R T I C L E
Open Access
DNA metabarcoding of spiders, insects, and
springtails for exploring potential linkage
between above- and below-ground food
webs
Hirokazu Toju
1,2*and Yuki G. Baba
3Abstract
Background:Understanding feedback between above- and below-ground processes of biological communities is a key to the effective management of natural and agricultural ecosystems. However, as above- and below-ground food webs are often studied separately, our knowledge of material flow and community dynamics in terrestrial ecosystems remains limited.
Results:We developed a high-throughput sequencing method for examining how spiders link above- and below-ground food webs as generalist predators. To overcome problems related to DNA-barcoding-based analyses of arthropod–arthropod interactions, we designed spider-specific blocking primers and Hexapoda-specific primers for the selective PCR amplification of Hexapoda prey sequences from spider samples. By applying the new DNA metabarcoding framework to spider samples collected in a temperate secondary forest in Japan, we explored the structure of a food web involving 15 spider species and various taxonomic groups of Hexapoda prey. These results support the hypothesis that multiple spider species in a community can prey on both above- and below-ground prey species, potentially coupling above- and below-ground food-web dynamics.
Conclusions:The PCR primers and metabarcoding pipeline described in this study are expected to accelerate nuclear marker-based analyses of food webs, illuminating poorly understood trophic interactions in ecosystems.
Keywords:Above- and below-ground linkage, Collembola (springtails), DNA barcoding, Ecological communities, Food webs, Illumina sequencing, Insects, Networks, Molecular gut content analyses, Predator–prey interactions
Background
Above- and below-ground biological communities are tightly linked with each other, collectively driving terres-trial ecosystem dynamics [1–3]. The above-ground parts of plants photosynthesize carbohydrates, of which 20% are directly supplied to below-ground mycorrhizal fungi in exchange for soil nutrients [4,5]. The vast majority of carbohydrates then flow into soil food webs by being consumed by fungivorous invertebrates [e.g., springtails
(Collembola)] [6, 7], which are subsequently preyed on by various groups of arthropod predators [8,9]. As some groups of predators sustained by below-ground biomass also eat above-ground prey [10–12], the presence of such generalist predators has been expected to stabilize above-ground food webs through the regulation of population dynamics of herbivorous insects in natural and agricultural ecosystems [13, 14]. Although these insights highlight the importance of ecosystem services provided by generalist predators linking above- and below-ground communities, we are just starting to understand the structure of food webs linking both below- and above-ground invertebrates.
Spiders (Araneae) are among the most important groups of generalist predators potentially connecting
* Correspondence:[email protected]
1Center for Ecological Research, Kyoto University, Hirano 2-509-3, Otsu, Shiga
520-2113, Japan
2Precursory Research for Embryonic Science and Technology (PRESTO), Japan
Science and Technology Agency, Honcho 4-1-8, Kawaguchi, Saitama 332-0012, Japan
Full list of author information is available at the end of the article
above- and below-ground food webs [14,15]. Spiders are known as major generalist predators stabilizing commu-nity dynamics of herbivorous insects, working as top-down regulators of above-ground food webs through trophic cascades [16]. As the body size and/or popula-tion size of spiders is limited by the amount of available prey biomass [11, 17], resource subsidies from below-ground food webs have been expected to strengthen the top-down regulation of above-ground food webs by spiders. In fact, pioneering studies have shown that springtails (Collembola) could be major “alternative prey”of web-weaving and wandering spiders, potentially sustaining populations of those spiders [8, 9,11,13,18]. However, the number of spider species analyzed in these previous studies was low presumably due to difficulty in identifying many small spiders.
DNA barcoding techniques, which allow detection of prey DNA from predator samples, have recently been applied to studies of various types of predator–prey and parasite–host interactions [19–22], revolutionizing our un-derstanding of species-rich food webs. Prey profile data based on high-throughput sequencing (e.g., 454, Illumina, and Ion-Torrent sequencing) have come to reveal poorly explored trophic interactions in the wild, providing novel insights into trophic interactions [23–26]. High-throughput sequencing analyses of spider diets have also indicated that spiders prey on both above- and below-ground arthropods [27, 28]. However, each of these studies focused on prey compositions of a single spider species. Thus, it remains a major challenge to identify diet composition of a spider community to determine above- and below-ground link-ages. Once a high-throughput research workflow for inves-tigating prey of multiple spider species is established, we will be able to discuss how spider communities drive terres-trial ecosystem processes in light of niche partitioning within spider functional guilds [29,30].
In this study, we explored the structure of a food web involving multiple spider species and their Hexapoda prey by developing a new DNA metabarcoding ap-proach. We first designed universal primers targeting broad taxonomic ranges of Hexapoda but not spiders, enabling the preferential amplification of degraded prey DNA from spider gut contents. We also developed blocking primers for further reducing off-target amplifi-cation of spider sequences and compared the perform-ance of PCR protocols with/without the blocking primers. Based on Illumina sequencing of various fam-ilies of web-weaving and non-web-weaving spider spe-cies collected in a temperate secondary forest in Japan, we examined whether multiple spider species in the community linked above- and below-ground food webs. Overall, this study shows a high-throughput pipeline for empirically characterizing prey communities consumed by spiders, providing opportunities for enhancing our
understanding of how above- and below-ground food-web dynamics are coupled by generalist predators.
Methods
Primer design
While many predator diet studies based on high-throughput sequencing have investigated interactions between vertebrate predators and invertebrate prey [19, 23,25], studies targeting interactions between phylogen-etically close organisms generally require specialized mo-lecular experimental protocols [28, 31]. In other words, because abundant predator DNA is highly likely to in-hibit the detection of prey DNA in the analysis of inver-tebrate–invertebrate trophic interactions, it is often necessary to develop taxon-specific PCR primers of prey or blocking primers targeting predators for selective amplification of prey DNA [28]. However, the mitochon-drial cytochrome c oxidase I (COI) region, which is used in most DNA barcoding analyses of spider diets, exhibits substantial variation in every one of three nucleotides (i.e., the third codons), even among species in the same insect orders, introducing taxonomic bias into prey community data [32, 33]. In contrast, nuclear ribosomal RNA (rRNA) regions are highly conserved across Hexa-poda, providing opportunities for designing high-coverage primers for the amplification of the hyper vari-able internal transcribed spacer (ITS) regions. Indeed, the ITS2 region, which is flanked by the 5.8S and 28S re-gions, has been used for the DNA barcoding of diverse animal lineages [34].
To build a research platform for screening spider prey based on DNA metabarcoding of the ITS2 region, we designed PCR primers whose sequence matched nuclear 5.8S rRNA sequences of Hexapoda, but not those of Araneae. We first downloaded Hexapoda and Araneae sequences containing the 5.8S rRNA region from the NCBI Nucleotide database (http://www.ncbi.nlm.nih. gov/nuccore) using the keywords described in Additional file 1. The 5.8S rRNA gene sequences were then extracted using the perl program available at https://www.uni-oldenburg.de/ibu/systematik-evolutions biologie/programme/, and then incomplete sequences lacking the core positions of the 5.8S rRNA region were removed from the data. The sequences of each order were subjected to multiple alignment using the program MAFFT v7.272 [35] (Additional file2).
Lepidoptera and a group of Hemiptera (Sternorrhyncha) had unique conserved sequences around the primer pos-ition (Addpos-itional file2). Thus, we designed additional for-ward primers for Lepidoptera (ITS3_Lepi_exSpF) and Sternorrhyncha (ITS3_Ster_exSpF). Note that we did not use the two primers targeting specific taxa (ITS3_Le-pi_exSpF and ITS3_Ster_exSpF) in the following high-throughput sequencing analysis because we put the priority of this study on developing basic molecular experimental protocols using the primer with broader taxonomic coverage (ITS3_Hexa_exSpF). To amplify the
ITS2 region, a reverse primer at the 28S rRNA region (ITS4_Hexa_R) was designed by slightly modifying an existing universal Eukaryota primers (ITS4 [36]): amplicon length was ca. 350 bp including primer positions. We also developed forward and reverse ITS2 primers for possible use in future DNA barcoding studies of Araneae (ITS3_Araneae_F and ITS3_Araneae_R).
Because high proportions of Araneae (predator) DNA could inhibit prey DNA amplification despite the use of Hexapoda-specific primers, we also designed blocking primers targeting Araneae sequences at the positions Fig. 1Forward primer position within 5.8S rRNA region. Around the insertion/deletion site within the 5.8S rRNA region, nucleotide sequences are well conserved within Hexapoda except for Lepidoptera and Sternorrhyncha. Hexapoda, and Araneae primers and Araneae-specific blocking primers were developed around the insertion/deletion site (Table1)
Table 1PCR primers developed in this study. Hexapoda-specific and Araneae-specific primers were developed at a 5.8S rRNA position involving deletions/insertions (Fig.1). Reverse primers were designed at the 5′-end of 28S rRNA region. A C3 spacer was added to the 3′-end of each blocking primer for the selective amplification of Hexapoda
Category Target Name Sequence (5′ –3′)
Hexapoda primers
Forward Amplification of Hexapoda (excluding Lepidoptera and Sternorrhyncha)
ITS3_Hexa_exSpF TGTGAACTGCAGGACACATGA
Amplification of Lepidoptera ITS3_Lepi_exSpF TGAACTGCAGGACACATTTGA
Amplification of Sternorrhyncha ITS3_Ster_exSpF CGAACATCGACMAGTCG
Reverse Amplification of Hexapoda ITS4_Hexa_R TCCTCCGCTTATTAATATGC
Araneae primers
Forward Amplification of Araneae ITS3_Araneae_F TGTGAATTGCAGGACACATYG
Reverse Amplification of Araneae ITS4_Araneae_R TCCTCCGCTTATTTATATGC
Blocking Primers
Forward Blocking of Araneae ITS3_BlockAraneae_A ATTGCAGGACACATTGAGC(C3)
spanning the insertion/deletion (Fig.1: Table1). We paid special attention to include mismatches to Hexapoda se-quences at or around 3′-end positions. To prevent the PCR extension of Araneae sequences, a C3 spacer [31] was added to the 3′-end of each blocking primer.
Sampling and DNA extraction
Spiders in diverse families were sampled in a deciduous secondary forest on Mt. Yoshida, Kyoto, Japan (35°01′ 32′N, 135°47′10′′E) on April 12, 2016. At the study site, an evergreen oak (Quercus glauca) and a deciduous oak (Quercus serrata) were dominant, while other evergreen (e.g.,Ilex pedunculosa) and deciduous (e.g.,Lyonia ovali-folia and Prunus grayana) tree species occurred com-monly. We collected spiders by beating Q. glauca
branches at a height of 1–1.5 m with a 1-m wooden stick (2 cm in diameter) above an insect net (60 cm in diameter). All spiders > 2 mm in body length were col-lected individually in 2-mL microtubes (132-620C; WATSON BIO LAB) or 5-mL mailing tubes (LC3811– 800; Labcon), immediately placed in a cool box. The samples were stored at−20 °C in the laboratory.
The taxonomy of the spider community at the study site is well resolved [37], and hence all spiders were identified to species using morphology. The 235 samples representing 26 species (Additional file3) were dissected under a stereoscopic microscope (Leica M205-C) in the laboratory. For samples of body size > 5 mm, abdomens were dissected and ground before DNA extraction: for smaller samples, the whole bodies were ground. The samples were then subjected to DNA extraction using the prepGEM Insect kit (ZyGEM). The prepGEM DNA extraction was performed with the 40-μL scale as instructed by the manufacturer and 15μL of PCR-grade water was subsequently added to each sample tube.
PCR and Illumina sequencing
The ITS2 region of Hexapoda was amplified using the pri-mer pair of ITS3_Hexa_exSpF and ITS4_Hexa_R (Table 1). A two-step PCR protocol [38] was used to analyze multiple samples in a single Illumina MiSeq sequencing. In the first PCR, we used fusion primers containing Illu-mina sequencing primer regions, 3–6-mer Ns for im-proved Illumina sequencing quality [39], and specific primers (forward, 5′- TCG TCG GCA GCG TCA GAT GTG TAT AAG AGA CAG - [3–6-mer Ns] - [ITS3_Hex-a_exSpF] -3′; reverse, 5′- GTC TCG TGG GCT CGG
AGA TGT GTA TAA GAG ACA G - [3–6mer Ns]
-[ITS4_Hexa_R] -3′) (Additional file4). The 10-μL reaction mixture contained 1 × KOD FX Neo buffer (TOYOBO), 0.4 mM of each dNTP, 0.2 μM of each fusion primer, 0.2 U of KOD FX Neo Polymerase (TOYOBO), and 1μL of template DNA. To evaluate the effects of newly de-signed blocking primers, four types of PCR settings
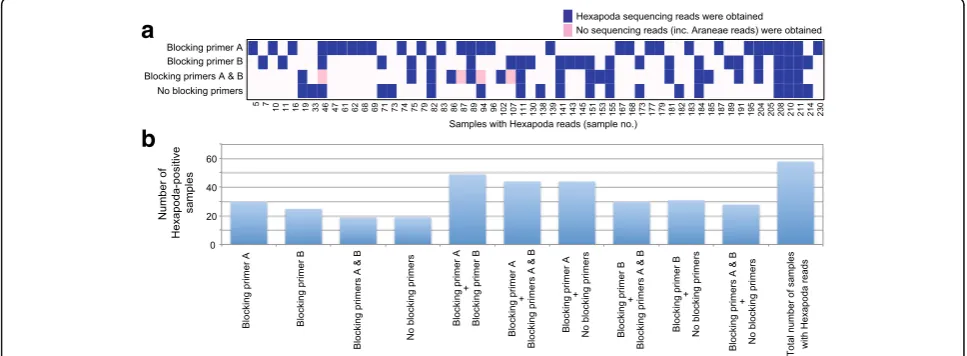
(blocking primer settings) were applied to the first PCR step. Specifically, ITS3_BlockAraneae_A (blocking primer A, 0.5μM in the reaction mixture), ITS3_BlockAraneae_B (blocking primer B, 0.5 μM), both blocking primers (blocking primers A & B, 0.5 μM each), or no blocking primers was/were added to the reaction mixture. Each of
the four PCR reactions were performed with a
temperature profile of 94 °C for 2 min, followed by 40 -cycles at 98 °C for 10 s, 50 °C for 30 s, 68 °C for 50 s, and a final extension at 68 °C for 5 min. The ramp rate was set to 1 °C/s to prevent the generation of chimeric sequences [40]. The PCR products were cleaned using 1/20 × ExoSAP-IT (affymetrix).
To add Illumina sequencing adaptors to the amplified ITS2 sequences, the second PCR reaction was performed with fusion primers containing P5/P7 Illumina adaptors, 8-mer index sequences for sample identification [41] (see Additional file 4 for forward and reverse index se-quences), and partial sequencing primer sequences that bind to the 5′-end of the 1st-PCR amplicons (forward,
5′- AAT GAT ACG GCG ACC ACC GAG ATC TAC
AC - [8-mer index] - TCG TCG GCA GCG TC -3′:
reverse, 5′- CAA GCA GAA GAC GGC ATA CGA
GAT - [8-mer index] - GTC TCG TGG GCT CGG -3′). Different sets of indexes were used for the four blocking primer experiments (Additional file 4). The temperature profile was 94 °C for 2 min, followed by 8 cycles at 98 °C for 10 s, 55 °C for 30 s, 68 °C for 50 s, and a final extension at 68 °C for 5 min (ramp rate = 1 °C/s). The PCR products were purified with AMPure XP Kit (Beckman Coulter): to remove primer dimers (< 200 bp sequences) the ratio of AMPure reagent to sample was set to 0.6 (v/v). For each of the four PCR (blocking primer) experimental settings, the purified PCR products of all samples were pooled. To re-move remaining fusion primer dimers, an additional AMpure purification was performed for each of the four li-braries. Equal concentrations of the four libraries were then mixed: note that forward-reverse index pairs differed among the four libraries to discriminate both blocking pri-mer settings and sample numbers (Additional file 4). The pooled libraries were sequenced in a single run of the Illumina MiSeq sequencer of Graduate School of Hu-man and Environmental Studies, Kyoto University (KYOTO-HE) (2 × 300 cycle sequencing kit; 7 pM sample concentration; 15% PhiX spike-in).
Bioinformatics
Illumina, and then demultiplexed the FASTQ sequences using the program Claident v0.2.2016.07.05 [42]. All se-quencing reads containing low-quality (quality score < 30) index sequences were discarded, and no mismatches between input and output index sequences were toler-ated. For the remaining forward reads [data deposition:
DNA DataBank of Japan (DDBJ) BioProject,
PRJDB5193], filtering of reads was performed using Claident. Specifically, low-quality nucleotides were trimmed from the 3′-end until the successive five nucle-otides had 30 or higher quality scores. Sequencing reads less than 170 bp in length (see [34] for length variation of the ITS2 region) and those containing certain propor-tions (10% or higher) of low quality (< 30) nucleotides were also eliminated. As the quality of reverse Illumina sequences is generally much lower than that of forward sequences, only forward sequences were used in the fol-lowing steps. Through the stringent criteria mentioned above, 5,049,150 of 10,126,283 demultiplexed reads were discarded in total. Noisy reads were subsequently re-moved based on the approach proposed previously [43]. Reads that passed the filtering processes were clustered with a cut-off sequence similarity of 97% using VSEARCH [44] as implemented in Claident. Operational taxonomic units (OTUs) representing ten or less reads were then removed as OTUs representing small num-bers of reads are likely to be artifacts generated through PCR/sequencing procedures.
The remaining OTUs were subjected to molecular taxo-nomic identification based on the database search algo-rithm of the query-centric auto-k-nearest neighbor (QCauto) methods [42] and subsequent taxonomic assign-ment with the lowest common ancestor (LCA) method [45] using Claident. Although we tried to remove chimeric
sequences using the program UCHIME [46] with
reference andde-novooptions, not only possibly chimeric sequences but also sequences with high Blast E-scores were discarded as chimeras. Therefore, instead of using UCHIME, we simply discarded OTUs other than Hexa-poda and Araneae (73.8% of the 2451 OTUs) after the QCauto–LCA taxonomic identification; even the super-kingdom level taxonomic information was unavailable for the possible chimeras. In total, 50 Hexapoda and 575 Araneae OTUs were obtained (Additional file 5). The UNIX commands used in the above bioinformatics pipe-line are provided in Additional file 4. No Hexapoda sequencing reads were obtained from DNA-extraction and PCR negative control samples (eight and two samples, respectively) included in the MiSeq run, while a small number of Araneae reads (0.006%) were detected from the DNA-extraction negative control samples.
The OTU count data matrix output by Claident was separated into four matrices representing respective PCR settings (Additional file 6). A cell in the matrices
depicted the read count of each OTU (column) in each sample (row) (hereafter, sample-level matrices). For each matrix, relationships between the number of sequencing reads and that of Hexapoda/Araneae OTUs per sample were shown using the“rarecurve” function of the vegan v.2.4–0 package [47] of R v.3.3.1. We did not equalize the number of sequencing reads per sample by sub-sampling (cf. [48]) and used raw (i.e., non-equalized) sample-level matrices.
Food web
The number and the taxonomic composition of detected Hexapoda OTUs across the four PCR protocols were an-alyzed based on the sample-level data matrices (Add-itional file 6). To visualize food-web structure based on the data of each PCR condition, we prepared a matrix in which rows represent an Araneae OTU, columns depict a Hexapoda OTU, and a cell entries show the number of samples from which an Araneae–Hexapoda OTU com-bination was observed (hereafter, Araneae × Hexapoda matrix) (Additional file 7). Based on the Araneae × Hexapoda matrix for each blocking-primer experiment, a network depicting potential trophic interactions be-tween spiders and Hexapoda was visualized with the “plotweb”function of the R bipartite 2.3–2 package [49]. By combining the information obtained from the four blocking-primer settings, we also showed an additional food web depicting all the Araneae–Hexapoda associa-tions detected in this study (Additional file7).
Results
Effects of blocking primers
Community composition of detected Hexapoda
The high-throughput sequencing data revealed reads assigned to Collembola and six insect orders (Coleop-tera, Dip(Coleop-tera, Hemip(Coleop-tera, Hymenop(Coleop-tera, Lepidop(Coleop-tera, and Thysanoptera) (Fig. 3; Additional file 6). Although we expected the Hexapoda-specific primer to mismatch sequences of Lepidoptera [and a group of Hemiptera (Sternorrhyncha)], a Lepidoptera OTU was detected in three of the four PCR settings (Fig. 3). The Hemiptera OTU observed represented Auchenorrhyncha, but not Sternorrhyncha (Additional file 6). The composition of Hexapoda taxa varied slightly across the four PCR settings. The number of Hexapoda OTUs observed was the highest in the blocking primer A condition (Fig.3).
Araneae–Hexapoda food web
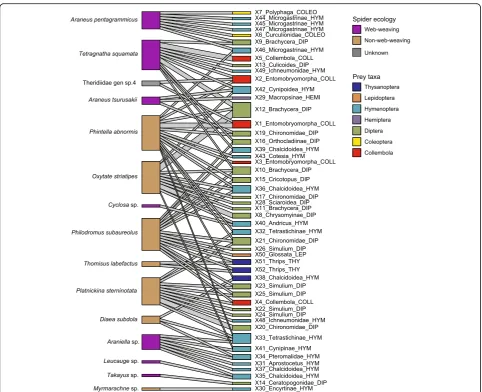
By combining all the Araneae–Hexapoda associations re-vealed in this study (Additional file10), a network involv-ing 15 spider species and 50 insect/sprinvolv-ingtail OTUs was obtained (Fig.4); note that intragenomic variation of ITS sequences might, in general, result in the overestimation of taxa or species. The network suggests that three spider species (Tetragnatha squamata, Phintella abnormis, and
Platnickina sterninotata) at the study site prey upon both insects and springtails. Even a species whose prey is thought to consist primarily of spiders (P. sterninotata) [50] potentially preyed on springtails, Hymenoptera, and Diptera species. Many other spider species were inferred to prey upon various above-ground insects, partly sharing prey taxa. In the network, there were Hymenoptera OTUs belonging to families consisting mainly of parasitoids (Braconidae, Pteromalidae, Encyrtidae, Eulophidae, and Ichneumonidae) and the family of gall wasps (Cynipidae) (Fig.4: Additional file6).
Discussion
The results implied that multiple spider species in a temperate forest preyed not only on insects but also on springtails. Thus, while pioneering studies have focused on the diets of a single or a few spider species [8,9,11, 13,18], this study provided a novel platform for
evaluat-ing how spider communities as a whole drive
ecosystem-scale processes. Our DNA metabarcoding data also suggested that spiders eat diverse taxonomic groups of insects, potentially having impacts on popula-tions of various prey species in food webs [51].
Table 2Summary of Illumina sequencing. Results based on the four PCR (blocking primer) settings are separately shown
Experiment No. of Samples with reads
No. of Samples with Hexapoda reads
Samples with Hexapoda reads (%)
Mean no. reads per sample (Hexapoda)
Mean no. reads per sample (Araneae)
Total no. of reads (Hexapoda)
Total no. of reads (Araneae)
Percentage of Hexapoda reads (%)
Blocking primer A 200 30 15.0 271 3754 8130 750,862 1.08
Blocking primer B 204 25 12.3 445 3720 11,113 758,851 1.46
Blocking primers A & B 189 19 10.1 258 3985 4909 753,181 0.65
No blocking primers 207 19 9.2 335 3428 6363 709,647 0.90
Total 210 58 27.6 – – 30,515 2,972,541 1.03
a
b
Meanwhile, prey taxonomic compositions varied, to some extent, among spider species in the secondary for-est (Fig.4), although the number of samples per species needs to be increased in future studies to perform statis-tical tests of niche (prey) overlap.
The results also suggested that spiders interact with multiple trophic levels of Hexapoda species in food webs. Specifically, the network revealed in this study (Fig. 4) involved not only herbivorous and fungivorous (or detritivorous) lineages of Hexapoda but also parasit-oids in the order Hymenoptera. Among the parasitic Hy-menoptera families detected from the spider samples, only Ichneumonidae includes well-characterized species known to parasitize on spiders [52, 53], while others (Braconidae, Pteromalidae, Encyrtidae, and Eulophidae) consist mainly of parasitoids on insects or species with unknown life histories [54, 55]. Because our spider samples did not seem to carry eggs/larvae/pupae of spider-specific Ichneumonidae wasps, which are easily recognizable ectoparasites [52, 53], most parasitoid hymenopterans detected in this study may be prey of the examined spider samples. However, a DNA metabarcod-ing analysis alone does not indicate whether such para-sitoids are directly preyed on by spiders or they were just parasitizing on Hexapoda hosts caught by spiders. In either case, interactions between spiders and parasit-oid wasps are of particular interest, as predation/parasit-ism within a trophic level has been considered as a strong determinant of food-web dynamics [56–59]. Moreover, existing DNA barcoding methods, including ours, are not designed to distinguish between signs of cannibalism, intra-guild predation, scavenging, and sec-ondary predation (i.e., DNA of prey’s prey). In addition, with the present DNA-metabarcoding protocol, we may
occasionally detect arthropod DNA contaminated in the environment. Further methodological improvements such as individual-level genotyping (e.g., single nucleo-tide polymorphism) for intra-guild predation analyses and sodium-hypochlorite bleaching for degrading non-prey DNA on predator sample surfaces will allow more comprehensive research of food-web structure.
Although supporting evidences based on direct field ob-servations of predation events are important for correctly evaluating trophic interactions, DNA metabarcoding-based analyses are expected to provide insights into the underappreciated structure of food webs [20,48,60]. For example, our data suggest trophic interactions between insects andP. sterninotata, which had been recognized as spider-eating species. Although the present DNA-based analysis might have detected insects preyed on by spider prey of P. sterninotata (i.e., secondary predation), DNA metabarcoding studies potentially help identify signs of novel trophic interactions in the wild (sensu [20]). In addition, DNA metabarcoding is a powerful tool for systematically investigating prey compositions of a whole spider community because many spider species are noc-turnal [61–63], making their predation behavior— espe-cially that of small-sized species—difficult to observe directly in the field,.
The high-throughput sequencing technology outlined in this study is expected to accelerate studies examining how spiders play key ecosystem roles at the interface of above- and below-ground biological communities. Using the protocol described in this study, molecular experi-mental procedures from DNA extraction to sequencing-library preparation could be completed in a few days, even with hundreds of spider samples. Illumina MiSeq sequencing and bioinformatics procedures also take only
a
b
a few additional days. Therefore, the molecular experi-mental and bioinformatics pipeline allowing fast profil-ing of predator–prey interactions is expected to provide an avenue for understanding temporal dynamics of food webs and their ecosystem-level consequences [64]. In particular, we will be able to examine how phenological switching between above- and below-ground prey by spiders can promote/inhibit the coexistence of species at the lower trophic levels [65]. The “early season predation” hypothesis predicts that the high biomass of overwintering adult/juvenile spiders is sustained by alter-native prey, such as detritivores, in early spring and that the resultant initial asymmetry in predator and above-ground insect biomass (spiders > insects) can restrict outbreaks of herbivores in the successive foliation season
[66]. Understanding of this phenological mechanism of predator–prey interactions, therefore, is invaluable from the aspect of insect pest controls in the restoration of natural ecosystems and the management of farmlands [15, 67]. By applying the high-throughput methods described herein to time-series sample sets, the early season predation hypothesis can be tested.
even without blocking primers as suggested in a previ-ous study [27]. We also found that the four PCR settings varied slightly in observed prey taxonomic compositions (Fig. 3; Additional file10). To avoid the loss of informa-tion, it may be important to combine results based on at least two PCR settings; combining the results of the blocking primer A and B settings (but not the simultan-eous use of the two primers) may be the most inform-ative (Fig. 2b). Alternatively, we may be able to improve the binding efficiency of the blocking primers by synthe-sizing them as peptide nucleic acid (PNA) [26]. Mean-while, given that Hexapoda sequences were not obtained from many of our samples (Table 2), improvements in DNA extraction or PCR protocols may further enhance prey information. Enrichment of fragmented prey DNA in template DNA solution, for example, has been re-ported to increase prey DNA detection rates [28] (see also [68]). In addition, by increasing the concentration of blocking primers in PCR reaction mixtures, more se-lective amplification of Hexapoda sequences over spider sequences may result in more enriched prey detection.
In this study, we developed a DNA barcoding method targeting the nuclear ITS2 region in order to overcome the previously indicated shortcomings of the use of the mitochondrial COI region [32, 33]. Most importantly, due to the lack of highly conserved regions within the COI region, COI primers that have been commonly used in DNA barcoding studies [69–71] often mismatch the template DNA of arthropods, introducing taxonomic bias into amplicon libraries [32,33]. In contrast, nucleo-tide sequences of the rRNA genes flanking the ITS2 region are highly conserved (Fig. 1), drastically reducing mismatches between primers and template genomic DNA and thereby increasing taxonomic coverage. Moreover, as the rRNA regions do not encode proteins, we could use insertion/deletion sites for developing taxon-specific (Araneae-specific) blocking primers (Fig. 1; Table1). Despite the benefits of using the ITS2 region, the number of ITS sequences has been much smaller than that of COI sequences in public databases. As a re-sult, most prey species in the inferred food web were un-identified even at the genus or family level, making it difficult to confirm that the detected Collembola se-quences derived from below-ground fungivore/detriti-vore taxa or springtail species inhabiting canopies or living-tree bark. The paucity of ITS sequences in public databases reflects the history of DNA barcoding: during the era of Sanger sequencing, organelle (i.e., haploid) markers including mitochondrial COI had advantage over nuclear markers because the latter required elabor-ate cloning processes to obtain clear electropherograms (see [72] for additional merits of COI as a marker). This situation is changing rapidly as a single run of a next-generation sequencer now enables the next-generation of
nuclear marker databases of hundreds or thousands of samples [48]. Indeed, an increasing number of re-searchers use the ITS regions for the DNA barcoding of not only fungi [73] but also animals [34] and plants [74], enhancing public ITS sequence databases. Developing ITS sequence databases of model local communities is also encouraged in order to understand how diverse arthropod guilds structure food webs.
Despite the use of Hexapoda-specific primers and Araneae-specific blocking primers, the majority of se-quencing reads obtained represented spiders rather than their Hexapoda prey (Table 2). While further methodo-logical improvements will increase the proportion of prey reads as discussed above, spider reads per se may provide important information. For example, given that juveniles of small spider species are often indistinguish-able, DNA barcoding information can help identification of not only prey but also predators. When we use the ITS2 region for DNA barcoding, however, we need to take into account potential intragenomic sequence vari-ation of the region [34, 75]. Our data suggested that most spider species analyzed in this study had two or more intragenomic ITS2 variants (Additional files8 2e– h and 9). Such intragenomic variation can promote, rather than prevent, the use of the ITS2 region for molecular taxonomic identification. In theory, two or more sequence variants per species need to be deposited to public databases for reliable taxonomic assignment of a query sequence at the species level [42]. Therefore, database construction of organelle markers essentially requires two or more reference samples per species, while the number of reference samples can be reduced in DNA barcoding based on the ITS regions in the pres-ence of intragenomic variation. The fact that nuclear markers are almost free from misidentification due to past introgressive hybridization [76] is another reason for promoting nuclear-marker-based DNA barcoding. We hope the primers developed in this study (Table 1) help accelerate ITS-based DNA barcoding, whose bene-fits have remained underappreciated in taxonomic and ecological studies of arthropods.
Conclusions
ITS-marker-based protocols (e.g., use of PNA blocking primers) will provide prospective technical options for testing hypotheses on the coupling of above- and below-ground ecosystem processes. More case studies are needed to better understand how springtails and other below-ground fungivores and detritivores [23] [e.g., mites (Acari) and fungus gnats (Sciaridae)] are involved in the entire food webs of terrestrial ecosystems.
Additional files
Additional file 1:Data S1.Keywords used in the downloading of ITS sequences in the NCBI database. (TXT 1 kb)
Additional file 2:Data S2.Aligned 5.8S rRNA database sequences. (TXT 387 kb)
Additional file 3:Table S1.List of spider samples. (PDF 72 kb)
Additional file 4:Data S3.Fusion primers, index tags, and the UNIX codes used in the Illumina sequencing and bioinformatic procedures. (XLSX 211 kb)
Additional file 5:Data S4.Hexapoda and Araneae OTU sequences. (TXT 158 kb)
Additional file 6:Data S5.Sample-level matrices and taxonomy of OTUs. (XLSX 363 kb)
Additional file 7:Data S6.Araneae × Hexapoda matrices. (XLSX 46 kb)
Additional file 8:Figure S1.Rarefaction curves of the sequencing reads. Each curve represents relationship between the number of sequencing reads and the number of observed OTUs. (PDF 522 kb)
Additional file 9:Table S2.Summary of Araneae ITS sequence variants detected. (PDF 78 kb)
Additional file 10:Figure S2.Spider–Hexapoda networks revealed in each PCR condition. (PDF 634 kb)
Acknowledgements
We thank Atsushi Ushimaru and Kensuke Nakata for advice on spider natural history, and Kaoru Maeto, Keizo Takasuka, and Tatsumi Suguro for advice on parasitoid wasps on spiders. We are also grateful to two anonymous reviewers, whose comments improved the manuscript.
Funding
This work was financially supported by JSPS KAKENHI Grant (Nos. 26650144) and JST PRESTO (JPMJPR16Q6) to H.T.
Availability of data and materials
The DNA sequencing data are available through DNA DataBank of Japan (DDBJ) (BioProject: no. PRJDB5193). The downstream community ecological data, OTU information, and UNIX commands used in this study are provided as Additional files.
Authors’contributions
HT designed the work. HT and YGB. conducted the fieldwork. HT performed the molecular experiments and analyzed the data. HT wrote the paper with YGB. Both authors read and approved the final manuscript.
Ethics approval and consent to participate Not applicable.
Consent for publication Not applicable.
Competing interests
The authors declare that they have no competing interests.
Publisher’s Note
Springer Nature remains neutral with regard to jurisdictional claims in published maps and institutional affiliations.
Author details
1Center for Ecological Research, Kyoto University, Hirano 2-509-3, Otsu, Shiga
520-2113, Japan.2Precursory Research for Embryonic Science and
Technology (PRESTO), Japan Science and Technology Agency, Honcho 4-1-8, Kawaguchi, Saitama 332-0012, Japan.3Institute for Agro-Environmental
Sciences, NARO, Kannondai 3-1-3, Tsukuba, Ibaraki 305-8604, Japan.
Received: 18 October 2017 Accepted: 6 February 2018
References
1. Bardgett RD, van der Putten WH. Belowground biodiversity and ecosystem functioning. Nature. 2014;515:505–11.
2. van der Putten WH, Bardgett RD, De Ruiter P, Hol W, Meyer K, Bezemer T, Bradford M, Christensen S, Eppinga M, Fukami T. Empirical and theoretical challenges in aboveground–belowground ecology. Oecologia. 2009;161:1–14. 3. Wardle DA, Bardgett RD, Klironomos JN, Setälä H, van der Putten WH, Wall
DH. Ecological linkages between aboveground and belowground biota. Science. 2004;304:1629–33.
4. Högberg MN, Högberg P. Extramatrical ectomycorrhizal mycelium contributes one-third of microbial biomass and produces, together with associated roots, half the dissolved organic carbon in a forest soil. New Phytol. 2002;154:791–5.
5. Högberg P, Nordgren A, Buchmann N, Taylor AF, Ekblad A, Högberg MN, Nyberg G, Ottosson-Löfvenius M, Read DJ. Large-scale forest girdling shows that current photosynthesis drives soil respiration. Nature. 2001; 411:789–92.
6. Hunt H, Coleman D, Ingham E, Ingham RE, Elliott E, Moore J, Rose S, Reid C, Morley C. The detrital food web in a shortgrass prairie. Biol Fertility Soils. 1987;3:57–68.
7. Johnson D, Krsek M, Wellington EM, Stott AW, Cole L, Bardgett RD, Read DJ, Leake JR. Soil invertebrates disrupt carbon flow through fungal networks. Science. 2005;309:1047.
8. Halaj J, Wise DH. Impact of a detrital subsidy on trophic cascades in a terrestrial grazing food web. Ecology. 2002;83:3141–51.
9. Chen B, Wise DH. Bottom-up limitation of predaceous arthropods in a detritus-based terrestrial food web. Ecology. 1999;80:761–72.
10. Miyashita T, Niwa S. A test for top-down cascade in a detritus-based food web by litter-dwelling web spiders. Ecol Res. 2006;21:611–5.
11. Miyashita T, Takada M, Shimazaki A. Experimental evidence that aboveground predators are sustained by underground detritivores. Oikos. 2003;103:31–6.
12. Harwood JD, Bostrom MR, Hladilek EE, Wise DH, Obrycki JJ. An order-specific monoclonal antibody toDipterareveals the impact of alternative prey on spider feeding behavior in a complex food web. Biol Control. 2007; 41:397–407.
13. McNabb DM, Halaj J, Wise DH. Inferring trophic positions of generalist predators and their linkage to the detrital food web in agroecosystems: a stable isotope analysis. Pedobiologia. 2001;45:289–97.
14. Scheu S. Plants and generalist predators as links between the below-ground and above-ground system. Basic Appl Ecol. 2001;2:3–13.
15. Nyffeler M, Sunderland KD. Composition, abundance and pest control potential of spider communities in agroecosystems: a comparison of European and US studies. Agri Ecosyst Env. 2003;95:579–612. 16. Schmitz OJ, Hambäck PA, Beckerman AP. Trophic cascades in terrestrial
systems: a review of the effects of carnivore removals on plants. Amer Nat. 2000;155:141–53.
17. Miyashita T. Direct evidence of food limitation for growth rate and body size in the spiderNephila clavata. Acta Arachnologica. 1991;40:17–21. 18. Agusti N, Shayler SP, Harwood JD, Vaughan IP, Sunderland K, Symondson
WOC. Collembola as alternative prey sustaining spiders in arable ecosystems: prey detection within predators using molecular markers. Mol Ecol. 2003;12:3467–75.
20. Wirta HK, Hebert PD, Kaartinen R, Prosser SW, Várkonyi G, Roslin T. Complementary molecular information changes our perception of food web structure. Proc Natl Acad Sci U S A. 2014;111:1885–90.
21. Hrcek J, Miller SE, Quicke DL, Smith M. Molecular detection of trophic links in a complex insect host–parasitoid food web. Mol Ecol Res. 2011;11:786–94. 22. Hata H, Tanabe AS, Yamamoto S, Toju H, Kohda M, Hori M. Diet disparity
among sympatric herbivorous cichlids in the same ecomorphs in Lake Tanganyika: amplicon pyrosequences on algal farms and stomach contents. BMC Biol. 2014;12:1.
23. Clare EL, Symondson WO, Broders H, Fabianek F, Fraser EE, MacKenzie A, Boughen A, Hamilton R, Willis CK, Martinez-Nuñez F. The diet ofMyotis lucifugusacross Canada: assessing foraging quality and diet variability. Mol Ecol. 2014;23:3618–32.
24. Brown DS, Burger R, Cole N, Vencatasamy D, Clare E, Montazam A, Symondson WOC. Dietary competition between the alien Asian musk shrew (Suncus murinus) and a re-introduced population of Telfair's skink (Leiolopisma telfairii). Mol Ecol. 2014;23:3695–705.
25. Thomas AC, Jarman SN, Haman KH, Trites AW, Deagle BE. Improving accuracy of DNA diet estimates using food tissue control materials and an evaluation of proxies for digestion bias. Mol Ecol. 2014;23:3706–18. 26. Pompanon F, Deagle BE, Symondson WO, Brown DS, Jarman SN, Taberlet P.
Who is eating what: diet assessment using next generation sequencing. Mol Ecol. 2012;21:1931–50.
27. Piñol J, San Andrés V, Clare E, Mir G, Symondson WOC. A pragmatic approach to the analysis of diets of generalist predators: the use of next-generation sequencing with no blocking probes. Mol Ecol Res. 2014;14:18–26. 28. Krehenwinkel H, Kennedy S, Pekár S, Gillespie R. A cost efficient and simple
protocol to enrich prey DNA from extractions of predatory arthropods for large scale gut content analysis by Illumina sequencing. Methods Ecol Evol. 2017;8:126–34.
29. Wirta HK, Weingartner E, Hambäck PA, Roslin T. Extensive niche overlap among the dominant arthropod predators of the high Arctic. Basic Appl Ecol. 2015;16:86–92.
30. Miyashita T. Life-history variation in closely related generalist predators living in the same habitat: a case study with threeCyclosaspiders. Funct Ecol. 1999;13:307–14.
31. Vestheim H, Jarman SN. Blocking primers to enhance PCR amplification of rare sequences in mixed samples–a case study on prey DNA in Antarctic krill stomachs. Frontiers Zool. 2008;5:1.
32. Clarke LJ, Soubrier J, Weyrich LS, Cooper A. Environmental metabarcodes for insects: in silico PCR reveals potential for taxonomic bias. Mol Ecol Res. 2014;14:1160–70.
33. Deagle BE, Jarman SN, Coissac E, Pompanon F, Taberlet P. DNA metabarcoding and the cytochrome c oxidase subunit I marker: not a perfect match. Biol Lett. 2014;10:20140562.
34. Yao H, Song J, Liu C, Luo K, Han J, Li Y, Pang X. Xu H, Zhu Y, Xiao P: use of ITS2 region as the universal DNA barcode for plants and animals. PLoS One. 2010;5:e13102.
35. Katoh K, Misawa K, Kuma Ki MT. MAFFT: a novel method for rapid multiple sequence alignment based on fast Fourier transform. Nucleic Acids Res. 2002;30:3059–66.
36. White TJ, Bruns T, Lee S, Taylor J. Amplification and direct sequencing of fungal ribosomal RNA genes for phylogenetics. PCR Protoc Guide Methods Appl. 1990;18:315–22.
37. Ono H. The spiders of Japan with keys to the families and genera and illustrations of the species. Kanagawa: Tokai University Press; 2009. 38. Toju H, Tanabe A, Ishii H. Ericaceous plant–fungus network in a harsh
alpine–subalpine environment. Mol Ecol. 2016;25:3242–57.
39. Lundberg DS, Yourstone S, Mieczkowski P, Jones CD, Dangl JL. Practical innovations for high-throughput amplicon sequencing. Nat Methods. 2013;10:999–1002. 40. Stevens JL, Jackson RL, Olson JB, Slowing PCR. Ramp speed reduces
chimera formation from environmental samples. J Microbiol Methods. 2013; 93:203–5.
41. Hamady M, Walker JJ, Harris JK, Gold NJ, Knight R. Error-correcting barcoded primers allow hundreds of samples to be pyrosequenced in multiplex. Nat Methods. 2008;5:235–7.
42. Tanabe AS, Toju H. Two new computational methods for universal DNA barcoding: a benchmark using barcode sequences of bacteria, archaea, animals, fungi, and land plants. PLoS One. 2013;8:e76910.
43. Li W, Fu L, Niu B, Wu S, Wooley J. Ultrafast clustering algorithms for metagenomic sequence analysis. Briefings Bioinformatics. 2012;13:656–68.
44. Rognes T, Flouri T, Nichols B, Quince C, Mahé F: VSEARCH: a versatile open source tool for metagenomics. Peer J. 2016;4:e2584.
45. Huson DH, Auch AF, Qi J, Schuster SC. MEGAN analysis of metagenomic data. Genome Res. 2007;17:377–86.
46. Edgar RC, Haas BJ, Clemente JC, Quince C, Knight R. UCHIME improves sensitivity and speed of chimera detection. Bioinformatics. 2011;27:2194–200. 47. Oksanen J, Blanachet FG, Kindt R, Legendre P, Minchin PR, O'Hara RB,
Simpson GL, Solymos P, Stevens MHH, Wagner H. Vegan: community ecology package. R package version 2.0-3 available athttp://CRAN.R-project. org/package=vegan: 2008. 2012;10
48. Toju H, High-throughput DNA. Barcoding for ecological network studies. Popul Ecol. 2015;57:37–51.
49. Dormann CF, Fründ J, Blüthgen N, Gruber B. Indices, graphs and null models: analyzing bipartite ecological networks. Open Ecol J. 2009;2:7–24. 50. Chikuni Y. Pictorial encyclopedia of spiders in Japan. Tokyo: [In Japanese]:
Kaisei-sha; 1989.
51. Hairston NG, Smith FE, Slobodkin LB. Community structure, population control, and competition. Amer Nat. 1960;94:421–5.
52. Gauld ID, Dubois J. Phylogeny of thePolysphinctagroup of genera (hymenoptera: Ichneumonidae; Pimplinae): a taxonomic revision of spider ectoparasitoids. Syst Entomol. 2006;31:529–64.
53. Eberhard WG. Spider manipulation by a wasp larva. Nature. 2000;406:255–6. 54. Gauld ID. Evolutionary patterns of host utilization by ichneumonoid
parasitoids (hymenoptera: Ichneumonidae and Braconidae). Biol J Linnean Soc. 1988;35:351–77.
55. Godfray HCJ. Parasitoids: behavioral and evolutionary ecology. Princeton: Princeton University Press; 1994.
56. Polis GA, Myers CA, Holt RD. The ecology and evolution of intraguild predation: potential competitors that eat each other. Ann Rev Ecol Evol Syst. 1989;20:297–330.
57. Polis GA, Holt RD. Intraguild predation: the dynamics of complex trophic interactions. Trends Ecol Evol. 1992;7:151–4.
58. Sanders D, Platner C. Intraguild interactions between spiders and ants and top-down control in a grassland food web. Oecologia. 2007;150:611–24. 59. Denno RF, Mitter MS, Langellotto GA, Gratton C, Finke DL. Interactions
between a hunting spider and a web-builder: consequences of intraguild predation and cannibalism for prey suppression. Ecol Entomol. 2004;29:566–77. 60. Hrček J, Godfray HCJ. What do molecular methods bring to host–parasitoid
food webs? Trends Parasitol. 2015;31:30–5.
61. Laughlin S, Blest AD, Stowe S. The sensitivity of receptors in the posterior median eye of the nocturnal spider,Dinopis. J Comp Physiol A. 1980;141:53–65. 62. Fenk L, Hoinkes T, Schmid A. Vision as a third sensory modality to elicit
attack behavior in a nocturnal spider. J Comp Physiol A. 2010;196:957–61. 63. Buckley R. Ants protect tropical Homoptera against nocturnal spider
predation. Biotropica. 1990;22:207–9.
64. Toju H, Yamamichi M, Guimarães Jr PR, Olesen J, Mougi A, Yoshida T, Thompson J. Species-rich networks and eco-evolutionary synthesis at the metacommunity level. Nature Ecol Evol. 2017;1:0024.
65. Birkhofer K, Wise DH, Scheu S. Subsidy from the detrital food web, but not microhabitat complexity, affects the role of generalist predators in an aboveground herbivore food web. Oikos. 2008;117:494–500. 66. Athey KJ, Dreyer J, Kowles KA, Penn HJ, Sitvarin MI, Harwood JD. Spring
forward: molecular detection of early season predation in agroecosystems. Food Webs. 2016;9:25–31.
67. Settle WH, Ariawan H, Astuti ET, Cahyana W, Hakim AL, Hindayana D, Lestari AS. Managing tropical rice pests through conservation of generalist natural enemies and alternative prey. Ecology. 1996;77:1975–88.
68. O’rorke R, Lavery S, Jeffs A. PCR enrichment techniques to identify the diet of predators. Mol Ecol Res. 2012;12:5–17.
69. Folmer O, Black M, Hoeh W, Lutz R, Vrijenhoek R. DNA primers for amplification of mitochondrial cytochrome c oxidase subunit I from diverse metazoan invertebrates. Mol Marine Biol Biotech. 1994;3:294–9.
70. Geller J, Meyer C, Parker M, Hawk H. Redesign of PCR primers for mitochondrial cytochrome c oxidase subunit I for marine invertebrates and application in all-taxa biotic surveys. Mol Ecol Res. 2013;13:851–61. 71. Leray M, Yang JY, Meyer CP, Mills SC, Agudelo N, Ranwez V, Boehm JT,
Machida RJ. A new versatile primer set targeting a short fragment of the mitochondrial COI region for metabarcoding metazoan diversity: application for characterizing coral reef fish gut contents. Frontiers Zool. 2013;10:1. 72. Hebert PD, Cywinska A, Ball SL. Biological identifications through DNA
73. Schoch CL, Seifert KA, Huhndorf S, Robert V, Spouge JL, Levesque CA, Chen W, Bolchacova E, Voigt K, Crous PW. Nuclear ribosomal internal transcribed spacer (ITS) region as a universal DNA barcode marker for fungi. Proc Natl Acad Sci U S A. 2012;109:6241–6.
74. China-Plant-BOL-Group, Li D-Z, Gao L-M, Li H-T, Wang H, Ge X-J, Liu J-Q, Chen Z-D, Zhou S-L, Chen S-L. Comparative analysis of a large dataset indicates that internal transcribed spacer (ITS) should be incorporated into the core barcode for seed plants. Proc Natl Acad Sci U S A. 2011;108:19641–6.
75. Meyer CP, Paulay G. DNA barcoding: error rates based on comprehensive sampling. PLoS Biol. 2005;3:e422.
76. Sota T, Ishikawa R, Ujiie M, Kusumoto F, Vogler A. Extensive trans-species mitochondrial polymorphisms in the carabid beetlesCarabussubgenus Ohomopteruscaused by repeated introgressive hybridization. Mol Ecol. 2001;10:2833–47.
• We accept pre-submission inquiries
• Our selector tool helps you to find the most relevant journal
• We provide round the clock customer support
• Convenient online submission
• Thorough peer review
• Inclusion in PubMed and all major indexing services
• Maximum visibility for your research
Submit your manuscript at www.biomedcentral.com/submit