R E S E A R C H
Open Access
Temperature tolerance of different larval stages
of the spider crab
Hyas araneus
exposed to
elevated seawater
PCO
2
Melanie Schiffer
1*, Lars Harms
2, Magnus Lucassen
1, Felix Christopher Mark
1, Hans-Otto Pörtner
1and Daniela Storch
1Abstract
Introduction:Exposure to elevated seawaterPCO2limits the thermal tolerance of crustaceans but the underlying mechanisms have not been comprehensively explored. Larval stages of crustaceans are even more sensitive to environmental hypercapnia and possess narrower thermal windows than adults.
Results:In a mechanistic approach, we analysed the impact of high seawater CO2on parameters at different levels of biological organization, from the molecular to the whole animal level. At the whole animal level we measured oxygen consumption, heart rate and activity during acute warming in zoea and megalopa larvae of the spider crab Hyas araneusexposed to different levels of seawaterPCO2. Furthermore, the expression of genes responsible for acid–base regulation and mitochondrial energy metabolism, and cellular responses to thermal stress (e.g. the heat shock response) was analysed before and after larvae were heat shocked by rapidly raising the seawater temperature from 10°C rearing temperature to 20°C. Zoea larvae showed a high heat tolerance, which decreased at elevated seawaterPCO2, while the already low heat tolerance of megalopa larvae was not limited further by hypercapnic exposure. There was a combined effect of elevated seawater CO2and heat shock in zoea larvae causing elevated transcript levels of heat shock proteins. In all three larval stages, hypercapnic exposure elicited an up-regulation of genes involved in oxidative phosphorylation, which was, however, not accompanied by increased energetic demands. Conclusion:The combined effect of seawater CO2and heat shock on the gene expression of heat shock proteins reflects the downward shift in thermal limits seen on the whole animal level and indicates an associated capacity to elicit passive thermal tolerance. The up-regulation of genes involved in oxidative phosphorylation might compensate for enzyme activities being lowered through bicarbonate inhibition and maintain larval standard metabolic rates at high seawater CO2levels. The present study underlines the necessity to align transcriptomic data with physiological
responses when addressing mechanisms affected by an interaction of elevated seawaterPCO2and temperature extremes.
Keywords:Hyas araneus, Larvae, Ocean acidification, Climate change, Thermal tolerance, Gene expression
* Correspondence:melanie.schiffer@awi.de 1
Integrative Ecophysiology, Alfred-Wegener-Institute for Polar and Marine Research, Am Handelshafen 12, 27570 Bremerhaven, Germany Full list of author information is available at the end of the article
© 2014 Schiffer et al.; licensee BioMed Central. This is an Open Access article distributed under the terms of the Creative Commons Attribution License (http://creativecommons.org/licenses/by/4.0), which permits unrestricted use, distribution, and reproduction in any medium, provided the original work is properly credited. The Creative Commons Public Domain Dedication waiver (http://creativecommons.org/publicdomain/zero/1.0/) applies to the data made available in this article, unless otherwise stated.
Introduction
The surface waters of the worlds’ ocean are affected by anthropogenic warming and accumulating atmospheric CO2. Sea surface temperatures are predicted to reach 1.5 to 8°C above preindustrial values by the year 2300 [1],
and the concentration of atmospheric CO2 may reach
levels of 2000 ppm by 2300, leading to a drop in surface water pH by up to 0.8 pH units [2]. Marine organisms will thus have to cope with concomitant changes in sea-water temperature and pH. Combined or interactive ef-fects of these environmental factors on the physiology of marine organisms can result from the same physiological mechanisms being affected by both factors [3].
To address the question of how organisms deal with thermal challenges, the concept of oxygen and capacity limited thermal tolerance (OCLTT) has been developed [4]. The observations supporting the concept include those in temperate zone crustaceans, among others, and led to the hypothesis that a mismatch between oxygen de-mand and oxygen supply results from limited capacity of ventilatory and circulatory systems at temperature ex-tremes. The resulting limits in aerobic performance are the first lines of limitation in thermal tolerance [5]. These earliest, ecologically relevant, thermal tolerance limits are called pejus temperatures (Tp). Beyond the pejus range critical temperatures (Tc) indicate the transition to anaer-obic metabolism. Within the pejus temperature range, heartbeat and ventilation increase with temperature sup-porting the rising oxygen demand in the warmth [5] as well as a scope for aerobic performance such as growth.
Beyond the Tp, haemolymph oxygen partial pressure
de-creases as a result of limited capacities of ventilation and circulation indicating a progressive mismatch between oxygen demand for maintenance and oxygen supply. In warm temperate species, hypoxia occurs on both flanks of the thermal performance curve and, finally, anaerobic me-tabolism sets in at the critical temperature. Survival be-yond the Tc is time-limited [5]. At the upper end of the thermal tolerance window, denaturation temperature might elicit a loss of protein function, the heat shock re-sponse and oxidative stress [4].
The interactions of elevated seawater PCO2 and
temperature extremes have been proposed to cause a narrowing of the thermal tolerance window of an or-ganism exposed to high CO2levels [6]. With rising
sea-water CO2 concentration, upper thermal tolerance
limits have been observed to be lowered by several °C in adult crustaceans and coral reef fishes [7-9]. Zittier et al. [10] found elevated seawaterPCO2and heat stress to act synergistically reducing the righting response in the spider crabHyas araneus.
To understand the synergistic effects of increasing sea-waterPCO2and temperature at population level, it is im-portant to include the most vulnerable life cycle stages.
Early developmental stages are suggested to be most sensi-tive to environmental hypercapnia [11] and to possess nar-row thermal windows [12,13]. They might, thus, be a bottleneck for successful survival and viability of a species
in a warm and high CO2ocean. Embryos of the Sydney
rock oyster, Saccostrea glomerata yielded in a reduced
number of D-veligers with a greater percentage of abnor-malities as well as reduced size when exposed to high CO2 and high temperature during both fertilization and embry-onic development compared to embryos that were ex-posed to the treatments for embryonic development only [14]. In temperate sea urchin larvae concomitant exposure to high temperature and highPCO2reduced larval metab-olism and led to a down-regulation of histone encoding genes [15]. However, in tropical sea urchin larvae during
concomitant exposure to elevated temperature andPCO2
effects of acidification on larval size were dominant [16].
Additive effects of increased temperature and CO2 were
recorded for survival, development, growth, and lipid syn-thesis of larvae and juveniles of Northwest Atlantic bivalves
[17]. At ambient temperature, elevated CO2 (3100 ppm)
resulted in increased mortality and prolonged developmen-tal time accompanied with a decrease in oxygen consump-tion rates of developing zoea I ofHyas araneus, when they
were exposed to CO2during their embryonic development
[18,19]. So far, there is limited data available on the thermal tolerance of larval stages exposed to elevated seawater PCO2.
The aim of the paper is to investigate the effect of ele-vated seawaterPCO2on the heat tolerance of the three larval stages of the spider crab Hyas araneus. Hyas ara-neus is a benthic shelf species and has a wide distribu-tion range from temperate to Arctic waters [20]. Larvae go through two zoea stages and one megalopa stage be-fore settling into the adult habitat. In a mechanistic ap-proach, we analysed parameters on different levels of functional hierarchy, from the whole animal to the
mo-lecular level. As temperature tolerance of adult Hyas
araneushas been shown to be reduced by high CO2[8] and larvae are supposed to be more sensitive to
synergis-tic effects of CO2 and temperature [12], larvae were
exposed to high seawater CO2 of 3300 μatm and
temperature extremes (10°C above rearing temperature) to study mechanisms affected by both factors and the interaction between these factors. For the identification of affected mechanisms it is necessary to use high levels
of CO2 and high temperatures followed by subsequent
studies of these mechanisms at intermediate levels of physico- chemical parameters [6]. At the whole organ-ism level, we measured active metabolic rate, heart rate and larval activity during continuous warming in the three larval stages reared at different seawater PCO2to identify differences in heat tolerance between CO2 treat-ments and stages.
CO2and temperature induced shifts in gene expression were studied in batches of larvae of each stage by sampling directly from the different CO2treatments and after ex-posure to short term heat shock. Expression levels of genes responsible for cellular stress phenomena including the heat shock response as a protection process, for acid– base regulation as an important energy consuming process [21] and for mitochondrial energy metabolism as an en-ergy supplying process, were analysed. These processes are hypothesized to be of central importance for a limita-tion in thermal tolerance during hypercapnic exposure. Previous studies reported differential responses of heat shock protein expression in larval and adult marine ecto-therms. Responses ranged from a reduced expression [22,23], to an up-regulation of heat shock protein expres-sion at low pH [24].
The capacities to regulate hypercapnia-induced blood
acid–base disturbances by means of ion transporters
might prevent strong acid–base disturbances that could lead to reduced protein function and lower temperature tolerance. Systemic hypercapnia also causes metabolic depression by lowering pH [25] accompanied by increas-ing gas partial pressure gradients [26] and will reduce the organisms’capacity to increase its rate of aerobic en-ergy turnover [3]. Metabolic depression may also be reflected at gene expression level. Hypoxia caused the repression of genes of the mitochondrial citric acid cycle and the electron transport system in gills of adult zebra-fish [27].
With our data, we have been able to align whole or-ganism performance to molecular responses and to re-veal mechanisms affected by the combined action of elevated CO2and temperature levels.
Results Larval mortality
There was no significant difference in larval mortality be-tween the treatments for both zoea I and zoea II larvae. Mortality of zoea I larvae was 15.5 ± 5% in larvae exposed
to 420μatm and 21.6 ± 6% in larvae exposed to 3300μatm (t-test,p= 0.413), while zoea II larvae showed 14.7 ± 11% mortality in the control treatment and 32.3 ± 13% in the high CO2treatment (t-test,p= 0.320).
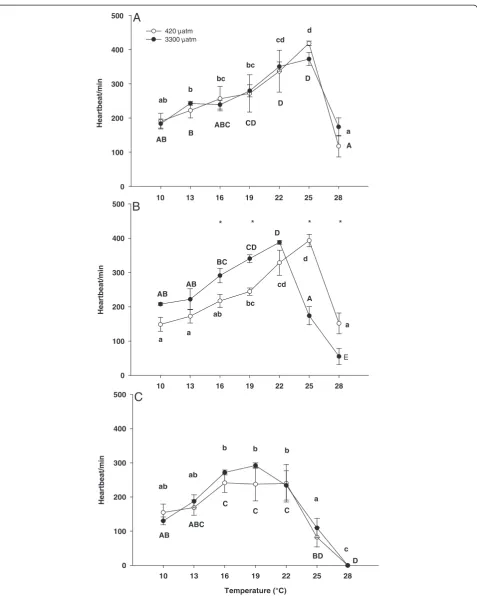
Determination of the larval thermal tolerance window Oxygen consumption
Oxygen consumption of zoea I larvae increased signifi-cantly with temperature, while no effect of seawater
CO2 concentration on metabolic rate was detected (2
way-ANOVA, Table 1, Figure 1A). At high temperature extremes a posteriori tests identified peaks in oxygen
consumption at 25°C in control larvae (2.3 ± 0.3 μO2
mg DW−1* h−1) and at 22°C in high CO2larvae (2.2 ± 0.4μO2mg DW−1* h−1(Figure 1A). At 28°C larval oxy-gen consumption showed a significant decrease even
below values observed at 10°C for control and CO2
treatments (Figure 1A). Oxygen consumption was
sig-nificantly lower under high seawater PCO2 at 25°C in
comparison to oxygen consumption of control larvae. Oxygen consumption patterns of zoea II revealed a
significant interaction between temperature and CO2
levels (Table 1, Figure 1B). Oxygen consumption of con-trol larvae increased between 10°C and 19°C, remained constant between 19°C and 25°C followed by a signifi-cant decrease at 28°C (Figure 1B). In contrast, oxygen
consumption of larvae reared at elevated CO2increased
between 10°C and 22°C and showed a sharp decrease already at 25°C.
There was also a significant interaction between
temperature and CO2in the oxygen consumption rates
of megalopa larvae (Table 1). A posteriori tests found an increase in respiration rates between 10°C and 22°C and a significant decrease between 22°C and 28°C for megalopa kept under control conditions (Figure 1C).
Under high PCO2oxygen consumption increased only
between 10°C and 13°C and was significantly lower at 22°C than in control larvae. The highest oxygen con-sumption was found at 22°C in control larvae (1.9 ± 0.5
Table 1 Results of two-way repeated measures ANOVAs
Stage Response variable CO2effect Temperature effect Interaction
F df p F df p F df p
Zoea I Oxygen consumption 0.723 1 0.411 32.838 6 < 0.001 1.709 6 0.133
Zoea II Oxygen consumption 5.229 1 0.041 51.374 6 < 0.001 11.025 6 0.001
Megalopa Oxygen consumption 0.965 1 0.345 7.595 6 < 0.001 2.769 6 0.022
Zoea I Heart rate 0.000 1 0.978 32.255 6 < 0.001 0.712 6 0.642
Zoea II Heart rate 0.001 1 0.974 41.980 6 < 0.001 18.755 6 < 0.001
Megalopa Heart rate 0.136 1 0.723 28.959 6 < 0.001 0.419 6 0.862
Megalopa Maxilliped beat rate 1.277 1 0.295 4.789 6 < 0.001 0.433 6 0.852
Zoea II Maxilliped beat rate 1.109 1 0.333 18.092 6 < 0.001 1.289 6 0.288
ANOVAs were conducted to investigate effects of CO2and temperature on oxygen consumption (Figure1A-C), heart rate (Figure2A-C) and maxilliped beat rate (Figure3A and B) ofHyas araneuszoea and megalopa larvae. Bold values indicate statistical significance.
Temperature (°C)
10 13 16 19 22 25 28
0.0 0.5 1.0 1.5 2.0 2.5 3.0 3.5
420 µatm CO2 3300 µatm CO2
*
a ab
ab bc
c c
d A
A AB
AB B
AB
C
10 13 16 19 22 25 28
Oxygen consumption (µ
g
O
2
mgDW
-1 *h
-1
)
0.0 0.5 1.0 1.5 2.0 2.5 3.0 3.5
*
a
ab b
c c
c
d AB
BC CD
DE E
A
A
Temperature (°C)
10 13 16 19 22 25 28
0.0 0.5 1.0 1.5 2.0 2.5 3.0
*
ab ab
b b
b
ab
a
A
B
C
A B
AB
AB
AB AB
AB
Figure 1(See legend on next page.)
μO2 mg DW−1*h−1) and at 13°C under elevated PCO2 (1.6 ± 0.7μO2mg DW−1*h−1).
Heart rate
The heart rate of zoea I larvae was significantly affected
by temperature, but not by CO2 (two-way-ANOVA,
Table 1). Heart rate of zoea I reared under control con-ditions increased between 10°C and 25°C with highest heart rates at 25°C (418 ± 14 beats min−1, Figure 2A). A similar increase between 10°C and 25°C could be seen
under high PCO2 with highest rates of 353 ± 54 beats
min−1at 25°C. Upon further warming to 28°C there was
a significant decrease of heart rate in both treatments to
133 ± 70 beats min−1 under control and 153 ± 46 beats
min−1under highPCO2conditions.
There was a significant interaction between temperature and CO2 in zoea II larvae (Table 1). A posteriori tests identified a significant increase of zoea II heart rates be-tween 10°C and 25°C in control larvae and bebe-tween 10°C and 22°C in high CO2larvae, respectively. Subsequently, heart rates decreased at 28°C in zoea II kept at control seawater PCO2, whereas a significant decrease of heart rates already occurred at 25°C in larvae reared at elevated PCO2, followed by a further decrease at 28°C (Figure 2B). Larvae showed higher heart rates at 16°C and 19°C and lower heart rates at 25°C and 28°C when kept at high CO2 (Figure 2B).
The heart rate of megalopa larvae was significantly
af-fected by temperature, but not by CO2(two-way-ANOVA,
Table 1). Heart rates remained constant between 10°C and 22°C followed by a significant decrease between 22°C and 28°C in control larvae and larvae from the high CO2 treat-ment (Figure 2C). At 28°C no heart beat could be detected at either treatment.
Maxilliped beat rate
The maxilliped beat rate of zoea I larvae was
signifi-cantly affected by temperature, but not by CO2
(two-way-ANOVA, Table 1). A posteriori Tukey tests revealed constant maxilliped beat rates between 10°C and 25°C and a decrease upon further warming to 28°C, which was significant between 16°C and 28°C in zoea I larvae reared under control conditions and between 19°C and
28°C at high CO2. There was no significant difference
between maxilliped beat rates of zoea I larvae reared at control or high CO2level (Figure 3A).
A two-way ANOVA revealed a significant effect of
temperature but not of CO2on maxilliped beat rates of
zoea II larvae (Table 1). Rates decreased upon warming in both, control and CO2treatments (a posteriori Tukey tests) (Figure 3B). There was no significant difference between rates at 22°C and 25°C in control larvae, whereas a significant drop occurred in larvae reared at elevated seawater PCO2. All zoea II stopped maxilliped beating at 28°C under control conditions while beating ceased already at 25°C at high seawaterPCO2.
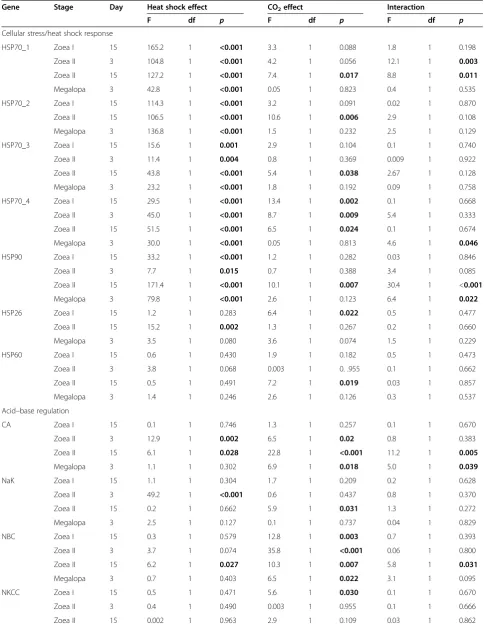
Gene expression patterns
For the purpose of clarity only significant changes in gene expression of proteins involved in the cellular stress/heat shock response, acid–base regulation and mitochondrial energy metabolism are reported and discussed (Tables 2, 3 and 4). Significant differences of heat shock refer to the gene expression in larvae kept at 10°C compared to those exposed to a heat shock at 20°C of control and CO2 treat-ments. Significant effects of CO2refer to the gene expres-sion of larvae reared at control and high CO2levels within each temperature treatment (10°C (control larvae) and 20°C (heat shocked larvae)). We presumed a combined effect when both factors, heat shock and seawater CO2, significantly affected larval gene expression (up- or down-regulation) (Tables 2, 3 and 4).
Cellular stress/heat shock response
Seven different sequences, identified as heat shock pro-teins (HSP) by Blastx (E-Value cut-off of 1E−3), were
se-lected to investigate effects of elevated seawater CO2
and heat shock on HSP gene expression in the different larval stages, among those were 4 representatives of the HSP 70 family (HSP70_1-4), 1 HSP 90, 1 HSP 26 and 1 HSP 60.
Exposure to heat shock (20°C) for 5 h affected the gene expression of HSP70_1-4, HSP90 and HSP26 in
lar-vae of Hyas araneus (Table 2). Significant interactions
were detected between heat shock and seawater CO2
concentration for the expression of HSP70_1 in zoea II larvae on day 3 and day 15, HSP70_4 in zoea II on day 3 and in megalopa larvae on day 3 as well as for HSP90 in zoea II larvae on day 15 and in megalopa larvae on day 3 (Table 5).
On day 0 expression of HSP70_1 (unpaired t-test: p= 0.020), HSP_2 (p= 0.016) and HSP_3 (p= 0.010) in zoea I larvae was twice or even for times higher after a heat shock of 20°C. A strong increase in the gene ex-pression of HSP70_1-4 and HSP90 (Table 2) could also be observed on day 15 after heat shock in control and
(See figure on previous page.)
Figure 1Temperature dependent oxygen consumption of zoea I (A), zoea II (B) and megalopa larvae (C) ofHyas araneus.Larvae were reared at two different seawaterPCO2(open circle: controls, 420μatm CO2; closed circle: 3300μatm CO2; Mean ± SE, N = 5-8). Asterisks indicate
significant differences between treatments at the same experimental temperature. Different letters indicate significant differences between temperatures within one treatment (lowercase letters: 420μatm CO2; uppercase letters: 3300μatm CO2).
Temperature (°C)
10 13 16 19 22 25 28
Heartbeat/min
0 100 200 300 400 500
ab ab
b b b
a
c
10 13 16 19 22 25 28
Heartbeat/min
0 100 200 300 400 500
a a
ab bc
cd d
a AB
AB BC
CD D
A
E
10 13 16 19 22 25 28
Heartbeat/min
0 100 200 300 400 500
420 µatm 3300 µatm
ab b
bc bc
cd d
a
AB B
ABC CD
D D
A
A
B
C
* * * *
AB
ABC C
C C
BD
D
Figure 2Temperature dependent heart rate of zoea I (A), zoea II (B) and megalopa larvae (C) ofHyas araneus.Larvae were reared at two different seawaterPCO2(open circle: controls, 420μatm CO2; closed circle: 3300μatm CO2; Mean ± SE, N = 5-6). Different letters indicate significant
differences between temperatures within one treatment (lowercase letters: 420μatm CO2; uppercase letters: 3300μatm CO2).
CO2 treatments (p <0.05, a posteriori analysis). The strongest increase in HSP expression of all stages was observed in zoea I on day 15. HSP 70_1 expression in-creased from 0.4 to 2.0 within the CO2group.
In zoea II larvae HSP70_1 and HSP70_4 expression
doubled after heat shock in control and CO2treatments
on day 3 (Table 2). A similar pattern could be observed for the gene expression of heat shock protein 70_3 and 90 (Table 5) with higher expression at 20°C in control
larvae and high CO2 larvae and in those reared at
ele-vated PCO2, respectively (p<0.05, a posteriori analysis). In zoea II on day 15 and in the megalopa stage on day 3 expression of HSP70_1-4 and HSP90 was strongly
up-regulated after 5 h heat shock of 20°C independent of PCO2(p<0.05, a posteriori analysis) (Table 2).
HSP26 was the only heat shock protein, which was sig-nificantly down-regulated after heat shock. A Tukey test revealed a significantly lower gene expression in zoea II on day 15 independent ofPCO2.
Considered as isolated factor, hypercapnia affected HSP gene expression only at 10°C in zoea I on day 15. Hypercapnic exposure doubled the gene expression of HSP70_4 and HSP26 (Table 5, Table 2).
In several larval stages of Hyas araneus, a combined
effect of high CO2and heat shock on the gene
expres-sion of heat shock proteins could be observed (Tables 2, Temperature (°C)
10 13 16 19 22 25 28
Maxiliped (beats min
-1 )
0 100 200 300 400 500 600 700
A A A
A
A
B B
ab bc
bc
bc
bcd cd
d
10 13 16 19 22 25 28
Maxiliped (beats min
-1 )
0 100 200 300 400 500 600
CO2 420 µatm 3300 µatm CO2
ab ab b ab
ab
ab
a
A
B
ABAB
AB B AB
AB A
Figure 3Temperature dependent maxilliped beat rate of zoea I (A) and zoea II (B) ofHyas araneus.Larvae were reared at two different seawaterPCO2(open circle: controls, 420μatm CO2; closed circle: 3300μatm CO2. Mean ± SE, N = 4-6). Asterisks indicate significant differences
between treatments at the same experimental temperature. Different letters indicate significant differences between temperatures within one treatment (lowercase letters: 420μatm CO2; uppercase letters: 3300μatm CO2).
Table 2 Gene expression analysis: gene expression (quantities) in zoea and megalopa larvae ofHyas araneusat different time points in development classified according to their function in cellular stress/heat shock response
Cellular stress/heat shock response
Zoea I day 0 Zoea I day 15 Zoea II day 3 Zoea II day 15 Megalopa day 3
Gene C C C CO2 C CO2 C CO2 C CO2 C CO2 C CO2 C CO2 C CO2
10°C 20°C 10°C 10°C 20°C 20°C 10°C 10°C 20°C 20°C 10°C 10°C 20°C 20°C 10°C 10°C 20°C 20°C
HSP 70_1 0.39 ±0.02 1.85 ±0.29 0.36 ±0.03 0.42 ±0.06 1.72 ±0.10 2.09 ±0.20 0.77 ±0.07 0.66 ±0.10 1.31 ±0.08 1.76 ±0.07 0.27 ±0.03 0.25 ±0.01 1.00 ±0.16 1.51 ±0.11 0.19 ±0.01 0.24 ±0.03 1.04 ±0.10 0.94 ±0.21 HSP 70_2 0.92 ±0.14 2.14 ±0.38 0.84 ±0.07 1.01 ±0.11 1.97 ±0.15 2.19 ±0.08 0.47 ±0.01 0.40 ±0.02 1.11 ±0.13 0.88 ±0.06 0.69 ±0.05 0.83 ±0.04 1.46 ±0.14 1.91 ±0.11 0.71 ±0.05 0.73 ±0.04 1.59 ±0.08 1.40 ±0.09 HSP 70_3 0.39 ±0.10 1.19 ±0.19 0.56 ±0.07 1.03 ±0.25 1.55 ±0.25 1.87 ±0.29 0.85 ±0.03 0.77 ±0.10 1.18 ±0.13 1.08 ±0.07 0.64 ±0.12 0.71 ±0.04 1.15 ±0.04 1.56 ±0.12 0.44 ±0.05 0.64 ±0.03 1.05 ±0.17 1.17 ±0.16 HSP 70_4 0.94 ±0.27 2.17 ±0.41 0.84 ±0.05 1.56 ±0.24 1.87 ±0.17 2.43 ±0.19 0.75 ±0.04 0.81 ±0.10 1.23 ±0.15 1.81 ±0.11 0.69 ±0.04 0.88 ±0.07 1.31 ±0.03 1.58 ±0.13 0.51 ±0.03 0.89 ±0.10 1.71 ±0.23 1.41 ±0.18
HSP 90 1.01 ±0.32 1.82 ±0.29 0.94 ±0.09 1.10 ±0.16 1.90 ±0.22 2.13 ±0.19 1.26 ±0.05 1.11 ±0.22 1.41 ±0.16 1.84 ±0.04 0.81 ±0.04 0.69 ±0.03 1.19 ±0.04 1.63 ±0.07 0.55 ±0.02 0.66 ±0.07 1.89 ±0.19 1.40 ±0.11
HSP 26 1.18 ±0.24 2.16 ±0.37 1.08 ±0.18 2.00 ±0.29 0.97 ±0.22 1,48 ±0.36 1.47 ±0.09 1.68 ±0.37 0.80 ±0.07 1.16 ±0.09 2.23 ±0.10 2.03 ±0.13 1.69 ±0.08 1.61 ±0.12 1.28 ±0.08 1.57 ±0.05 1.22 ±0.13 1.28 ±0.09
HSP 60 1.40 ±0.10 1.98 ±0.43 1.56 ±0.12 2.08 ±0.43 1.94 ±0.05 2.10 ±0.18 1.32 ±0.15 1.25 ±0.24 0.90 ±0.08 0.99 ±0.18 1.11 ±0.13 1.53 ±0.12 1.24 ±0.02 1.61 ±0.18 1.08 ±0.05 0.91 ±0.08 1.40 ±0.31 1.01 ±0.12
Larvae were reared at controlPCO2(C) and highPCO2(CO2) at control temperature (10°C) or exposed to a heat shock for 5 h at 20°C. Arrow direction indicates significantly higher (upwards) or lower (downwards)
gene expression between CO2treatments at the same temperature or between temperatures within the same CO2treatment. Black arrows: CO2effect at the same temperature (10°C or 20°C). White arrows: heat shock
effect. White/Black arrows in one direction indicate a combined effect of CO2and heat shock.
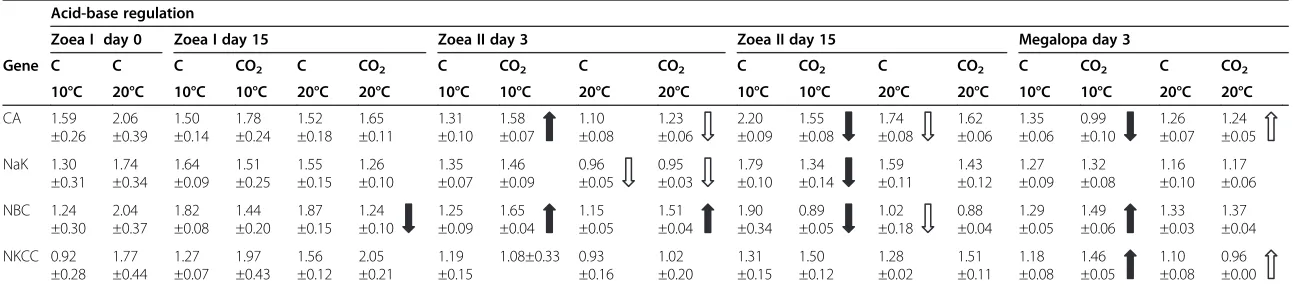
Table 3 Gene expression analysis: gene expression (quantities) in zoea and megalopa larvae ofHyas araneusat different time points in development classified according to their function in acid-base regulation
Acid-base regulation
Zoea I day 0 Zoea I day 15 Zoea II day 3 Zoea II day 15 Megalopa day 3
Gene C C C CO2 C CO2 C CO2 C CO2 C CO2 C CO2 C CO2 C CO2
10°C 20°C 10°C 10°C 20°C 20°C 10°C 10°C 20°C 20°C 10°C 10°C 20°C 20°C 10°C 10°C 20°C 20°C
CA 1.59 ±0.26 2.06 ±0.39 1.50 ±0.14 1.78 ±0.24 1.52 ±0.18 1.65 ±0.11 1.31 ±0.10 1.58 ±0.07 1.10 ±0.08 1.23 ±0.06 2.20 ±0.09 1.55 ±0.08 1.74 ±0.08 1.62 ±0.06 1.35 ±0.06 0.99 ±0.10 1.26 ±0.07 1.24 ±0.05 NaK 1.30 ±0.31 1.74 ±0.34 1.64 ±0.09 1.51 ±0.25 1.55 ±0.15 1.26 ±0.10 1.35 ±0.07 1.46 ±0.09 0.96 ±0.05 0.95 ±0.03 1.79 ±0.10 1.34 ±0.14 1.59 ±0.11 1.43 ±0.12 1.27 ±0.09 1.32 ±0.08 1.16 ±0.10 1.17 ±0.06 NBC 1.24 ±0.30 2.04 ±0.37 1.82 ±0.08 1.44 ±0.20 1.87 ±0.15 1.24 ±0.10 1.25 ±0.09 1.65 ±0.04 1.15 ±0.05 1.51 ±0.04 1.90 ±0.34 0.89 ±0.05 1.02 ±0.18 0.88 ±0.04 1.29 ±0.05 1.49 ±0.06 1.33 ±0.03 1.37 ±0.04 NKCC 0.92 ±0.28 1.77 ±0.44 1.27 ±0.07 1.97 ±0.43 1.56 ±0.12 2.05 ±0.21 1.19 ±0.15 1.08±0.33 0.93 ±0.16 1.02 ±0.20 1.31 ±0.15 1.50 ±0.12 1.28 ±0.02 1.51 ±0.11 1.18 ±0.08 1.46 ±0.05 1.10 ±0.08 0.96 ±0.00
Larvae were reared at controlPCO2(C) and highPCO2(CO2) at control temperature (10°C) or exposed to a heat shock for 5 h at 20°C. Arrow direction indicates significantly higher (upwards) or lower (downwards)
gene expression between CO2treatments at the same temperature or between temperatures within the same CO2treatment. Black arrows: CO2effect at the same temperature (10°C or 20°C). White arrows: heat shock
effect. White/Black arrows in one direction indicate a combined effect of CO2and heat shock.
Table 4 Gene expression analysis: gene expression (quantities) in zoea and megalopa larvae ofHyas araneusat different time points in development classified according to their function in mitochondrial energy metabolism
Mitochondrial energy metabolism
Zoea I day 0 Zoea I day 15 Zoea II day 3 Zoea II day 15 Megalopa day 3
Gene C C C CO2 C CO2 C CO2 C CO2 C CO2 C CO2 C CO2 C CO2
10°C 20°C 10°C 10°C 20°C 20°C 10°C 10°C 20°C 20°C 10°C 10°C 20°C 20°C 10°C 10°C 20°C 20°C
PDH 1.29 ±0.29 1.33 ±0.29 1.76 ±0.09 1.76 ±0.35 1.20 ±0.23 1.47 ±0.13 1.51 ±0.04 1.49 ±0.12 0.98 ±0.14 1.35 ±0.09 1.74 ±0.18 1.76 ±0.08 1.78 ±0.18 1.65 ±0.10 1.28 ±0.08 1.05 ±0.01 1.26 ±0.11 0.91 ±0.04 IDH 1.52 ±0.20 2.13 ±0.37 1.70 ±0.04 2.75 ±0.37 1.79 ±0.09 2.25 ±0.07 2.02 ±0.12 1.89 ±0.07 1.83 ±0.15 1.66 ±0.06 1.45 ±0.10 1.53 ±0.05 1.17 ±0.06 1.64 ±0.05 1.45 ±0.08 1.39 ±0.04 1.54 ±0.06 1.29 ±0.07 NAD 1.19 ±0.15 1.34 ±0.16 0.98 ±0.14 1.34 ±0.26 1.05 ±0.05 1.83 ±0.35 0.83 ±0.02 0.48 ±0.11 0.73 ±0.18 0.37 ±0.09 0.20 ±0.04 1.80 ±0.15 1.17 ±0.08 1.69 ±0.21 0.82 ±0.27 1.46 ±0.08 0.98 ±0.11 1.26 ±0.19 SDH 1.55 ±0.15 2.07 ±0.41 1.69 ±0.10 2.31 ±0.29 1.84 ±0.12 2.14 ±0.14 1.37 ±0.08 1.58 ±0.06 1.11 ±0.09 1.34 ±0.03 1.77 ±0.15 1.54 ±0.05 1.60 ±0.06 1.60 ±0.06 1.29 ±0.02 1.35 ±0.09 1.38 ±0.04 1.31 ±0.07 CCR 1.27 ±0.28 2.04 ±0.37 1.49 ±0.15 2.12 ±0.32 1.68 ±0.13 1.72 ±0.11 1.43 ±0.12 1.36 ±0.12 0.99 ±0.07 1.56 ±0.05 1.28 ±0.12 1.46 ±0.05 1.65 ±0.14 1.64 ±0.08 1.43 ±0.11 1.37 ±0.08 1.57 ±0.12 1.16 ±0.05 COX 1.38 ±0.27 2.07 ±0.38 1.73 ±0.11 2.47 ±0.45 0.85 ±0.13 1.33 ±0.10 1.38 ±0.12 1.18 ±0.08 0.53 ±0.04 1.00 ±0.10 1.37 ±0.21 2.36 ±0.09 1.60 ±0.19 1.56 ±0.07 1.16 ±0.15 1.53 ±0.14 1.00 ±0.09 0.79 ±0.04 atpA 1.44 ±0.27 2.10 ±0.28 1.81 ±0.03 2.68 ±0.38 2.72 ±0.04 2.09 ±0.09 1.49 ±0.06 1.49 ±0.04 1.14 ±0.05 1.56 ±0.08 1.93 ±0.13 2.12 ±0.09 1.89 ±0.14 1.79 ±0.05 1.62 ±0.06 1.61 ±0.08 1.65 ±0.06 1.52 ±0.11
Larvae were reared at controlPCO2(C) and highPCO2(CO2) at control temperature (10°C) or exposed to a heat shock for 5 h at 20°C. Arrow direction indicates significantly higher (upwards) or lower (downwards)
gene expression between CO2treatments at the same temperature or between temperatures within the same CO2treatment. Black arrows: CO2effect at the same temperature (10°C or 20°C). White arrows: heat shock
effect. White/Black arrows in one direction indicate a combined effect of CO2and heat shock.
Table 5 Results of two-way ANOVAs
Gene Stage Day Heat shock effect CO2effect Interaction
F df p F df p F df p
Cellular stress/heat shock response
HSP70_1 Zoea I 15 165.2 1 <0.001 3.3 1 0.088 1.8 1 0.198
Zoea II 3 104.8 1 <0.001 4.2 1 0.056 12.1 1 0.003
Zoea II 15 127.2 1 <0.001 7.4 1 0.017 8.8 1 0.011
Megalopa 3 42.8 1 <0.001 0.05 1 0.823 0.4 1 0.535
HSP70_2 Zoea I 15 114.3 1 <0.001 3.2 1 0.091 0.02 1 0.870
Zoea II 15 106.5 1 <0.001 10.6 1 0.006 2.9 1 0.108
Megalopa 3 136.8 1 <0.001 1.5 1 0.232 2.5 1 0.129
HSP70_3 Zoea I 15 15.6 1 0.001 2.9 1 0.104 0.1 1 0.740
Zoea II 3 11.4 1 0.004 0.8 1 0.369 0.009 1 0.922
Zoea II 15 43.8 1 <0.001 5.4 1 0.038 2.67 1 0.128
Megalopa 3 23.2 1 <0.001 1.8 1 0.192 0.09 1 0.758
HSP70_4 Zoea I 15 29.5 1 <0.001 13.4 1 0.002 0.1 1 0.668
Zoea II 3 45.0 1 <0.001 8.7 1 0.009 5.4 1 0.333
Zoea II 15 51.5 1 <0.001 6.5 1 0.024 0.1 1 0.674
Megalopa 3 30.0 1 <0.001 0.05 1 0.813 4.6 1 0.046
HSP90 Zoea I 15 33.2 1 <0.001 1.2 1 0.282 0.03 1 0.846
Zoea II 3 7.7 1 0.015 0.7 1 0.388 3.4 1 0.085
Zoea II 15 171.4 1 <0.001 10.1 1 0.007 30.4 1 <0.001
Megalopa 3 79.8 1 <0.001 2.6 1 0.123 6.4 1 0.022
HSP26 Zoea I 15 1.2 1 0.283 6.4 1 0.022 0.5 1 0.477
Zoea II 15 15.2 1 0.002 1.3 1 0.267 0.2 1 0.660
Megalopa 3 3.5 1 0.080 3.6 1 0.074 1.5 1 0.229
HSP60 Zoea I 15 0.6 1 0.430 1.9 1 0.182 0.5 1 0.473
Zoea II 3 3.8 1 0.068 0.003 1 0. .955 0.1 1 0.662
Zoea II 15 0.5 1 0.491 7.2 1 0.019 0.03 1 0.857
Megalopa 3 1.4 1 0.246 2.6 1 0.126 0.3 1 0.537
Acid–base regulation
CA Zoea I 15 0.1 1 0.746 1.3 1 0.257 0.1 1 0.670
Zoea II 3 12.9 1 0.002 6.5 1 0.02 0.8 1 0.383
Zoea II 15 6.1 1 0.028 22.8 1 <0.001 11.2 1 0.005
Megalopa 3 1.1 1 0.302 6.9 1 0.018 5.0 1 0.039
NaK Zoea I 15 1.1 1 0.304 1.7 1 0.209 0.2 1 0.628
Zoea II 3 49.2 1 <0.001 0.6 1 0.437 0.8 1 0.370
Zoea II 15 0.2 1 0.662 5.9 1 0.031 1.3 1 0.272
Megalopa 3 2.5 1 0.127 0.1 1 0.737 0.04 1 0.829
NBC Zoea I 15 0.3 1 0.579 12.8 1 0.003 0.7 1 0.393
Zoea II 3 3.7 1 0.074 35.8 1 <0.001 0.06 1 0.800
Zoea II 15 6.2 1 0.027 10.3 1 0.007 5.8 1 0.031
Megalopa 3 0.7 1 0.403 6.5 1 0.022 3.1 1 0.095
NKCC Zoea I 15 0.5 1 0.471 5.6 1 0.030 0.1 1 0.670
Zoea II 3 0.4 1 0.490 0.003 1 0.955 0.1 1 0.666
Zoea II 15 0.002 1 0.963 2.9 1 0.109 0.03 1 0.862
3 and 4 see arrows of column CO2/20°C). Expression of HSP70_1 and HSP70_4 were significantly higher in zoea I on day 15 and zoea II on day 3 after heat shock in lar-vae reared at elevatedPCO2. On day 15 of high CO2 ex-posure in zoea II larvae expression of HSP70_1-3 and HSP90 was also higher than in controls.
Acid–base regulation
Four different sequences, among them carbonic anhy-drase (CA), sodium potassium ATPase (NaK), sodium bicarbonate cotransporter (NBC) and sodium potassium chloride cotransporter (NKCC) were down-regulated under heat shock (Table 3). In zoea II larvae on day 3
CA expression was lower in high CO2 treatment and
NaK was down-regulated in both heat-shocked control
and high CO2 zoea II larvae (Table 3). On day 15 a
significantly lower CA expression was observed after the heat shock in control zoea II larvae. In megalopa larvae expression of NKCC decreased from 1.1 to 0.9, while CA was up-regulated in heat-shocked larvae at elevated seawaterPCO2.
A stronger response in gene expression of transporters relevant for acid–base regulation was found at high CO2 in comparison to the levels found after heat shock (Table 5, Table 3). Expression of NBC was reduced in zoea I larvae on day 15 (Table 3) after heat shock at
ele-vated PCO2. On day 3, CO2 caused significantly
in-creased NBC expression (Table 3) in high CO2larvae at
10°C and 20°C and higher CA expression in high CO2
zoea II at 10°C (Table 3). On day 15, lower CA and NaK
expression in the high CO2treatment was found at 10°C
in zoea II larvae (Table 3). In megalopa larvae CA
Table 5 Results of two-way ANOVAs(Continued)
Megalopa 3 18.3 1 <0.001 1.0 1 0.333 9.7 1 0.007
Mitochondrial energy metabolism
PDH Zoea I 15 3.2 1 0.093 0.3 1 0.578 0.3 1 0.582
Zoea II 3 9.0 1 0.009 2.5 1 0.134 3.0 1 0.101
Zoea II 15 0.07 1 0.794 0.1 1 0.69 0.3 1 0.577
Megalopa 3 1.1 1 0.297 14.3 1 0.002 0.6 1 0.438
IDH Zoea II 3 4.9 1 0.045 2.4 1 0.144 0.03 1 0.862
Zoea II 15 1.2 1 0.285 13.8 1 0.002 6.9 1 0.019
Megalopa 3 0.01 1 0.915 5.7 1 0.029 2.0 1 0.170
NAD Zoea I 15 1.4 1 0.247 6.0 1 0.025 0.8 1 0.379
Zoea II 3 0.7 1 0.388 9.1 1 0.008 0.003 1 0.953
Zoea II 15 6.8 1 0.021 42.9 1 <0.001 11.2 1 0.005
Megalopa 3 0.01 1 0.919 6.3 1 0.023 0.9 1 0.348
SDH Zoea I 15 0.005 1 0.943 6.6 1 0.020 0.7 1 0.388
Zoea II 3 14.5 1 0.002 10.7 1 0.005 0.03 1 0.848
Zoea II 15 0.3 1 0.565 1.6 1 0.221 1.6 1 0.221
Megalopa 3 0.1 1 0.704 0.02 1 0.881 1.2 1 0.276
CCR Zoea I 15 0.2 1 0.604 2.9 1 0.105 2.2 1 0.155
Zoea II 3 1.7 1 0.210 7.2 1 0.016 11.2 1 0.004
Zoea II 15 8.6 1 0.011 0.7 1 0.405 1.0 1 0.314
Megalopa 3 0.1 1 0.721 6.1 1 0.025 3.4 1 0.082
COX Zoea I 15 16.7 1 <0.001 6.1 1 0.025 0.3 1 0.589
Zoea II 3 32.2 1 <0.001 2.0 1 0.168 13.7 1 0.002
Zoea II 15 4.2 1 0.060 11.6 1 0.005 13.6 1 0.003
Megalopa 3 15.9 1 0.001 0.4 1 0.491 6.4 1 0.022
atpA Zoea II 3 5.0 1 0.041 11.9 1 0.003 12.5 1 0.003
Zoea II 15 3.4 1 0.088 0.2 1 0.661 2.1 1 0.169
Megalopa 3 0.1 1 0.710 0.7 1 0.387 0.5 1 0.454
ANOVAs were conducted to investigate the effects of heat shock and seawater CO2on the gene expression ofHyas araneuszoea and megalopa larvae (significant differences are indicated by arrows in Tables2,3and4). Data for the expression of HSP70_2 and HSP26 in the zoea II larvae (day 3) and IDH and atpA in the zoea I larvae (day 15) were excluded as they did not meet the assumptions for a two-way ANOVA. Bold values indicate statistical significance.
expression was down-regulated, while NKCC and NBC expression was up-regulated at 10°C in larvae exposed to elevatedPCO2(p<0.05, a posteriori analysis).
In all larval stages, fold-changes of acid–base relevant genes were smaller than that of cellular response and no
combined effect of high CO2 and heat shock became
obvious.
Mitochondrial energy metabolism
Seven different sequences were identified as enzymes of the mitochondrial energy metabolism by Blastx (E-Value
cut-off of 1E−3), among them pyruvate dehydrogenase
(PDH), isocitrate dehydrogenase (IDH), NADH dehydro-genase (NAD), succinate dehydrodehydro-genase (SDH), cyto-chrome c reductase (CCR), cytocyto-chrome c oxidase (COX) and ATP synthase (atpA).
Larvae of Hyas araneus responded to the heat shock
mainly with a down-regulation of genes relevant for mitochondrial energy metabolism (Table 4). After heat shock the expression of COX in zoea I larvae on day 15
(Table 5) was reduced regardless of CO2 concentration
(p <0.5, a posteriori analysis). The strongest response was observed in zoea II larvae on day 3. Five of seven in-vestigated genes were down-regulated in larvae reared at
control PCO2. However, only SDH was significantly
down-regulated by heat shock at high seawater PCO2.
(Table 4). A contrary pattern was recorded in zoea II on day 15. In control larvae a higher CCR, NAD and IDH
expression was found in heat shocked larvae at 20°C
compared to expression at 10°C (Table 4). COX
expres-sion was down-regulated in high CO2larvae exposed to
a heat shock of 20°C as it could be observed in megalopa larvae (Table 4).
In contrast to heat shock, exposure to elevated
sea-water PCO2 led mainly to an up-regulation of genes
relevant for mitochondrial energy metabolism (Table 4). NAD, SDH and COX genes were up-regulated in zoea I larvae on day 15 (Table 5). NAD expression was higher at 20°C, while SDH and COX were up-regulated in high CO2zoea I larvae at 10°C (Table 4).
Again, the strongest response could be observed in zoea II on day 3 with six out of seven genes responding
to a treatment with high seawater PCO2. However,
changes in gene expression were only recorded after heat shock. While PDH, SDH, CCR, COX and atpA were slightly up-regulated at 20°C, NAD expression
de-creased in larvae exposed to high PCO2. On day 15,
NAD expression was elevated 9-fold from control to hy-percapnic conditions. Higher NAD and COX expression
due to elevated seawater CO2 at 10°C and an
up-regulation of IDH and NAD in heat shocked high CO2
zoea II larvae was recorded (Table 4).
In the megalopa stage seawater CO2concentration influ-enced PDH, IDH, NAD and CCR expression significantly,
but differentially (Table 5). PDH, IDH and CCR
expres-sion levels were lowered by elevated PCO2 in heat
shocked larvae, while NAD expression was higher in
high CO2megalopa at the control temperature of 10°C
(p<0.5, a posteriori analysis) (Table 4).
Discussion
Determination of the larval thermal tolerance window In the present study, the concept of oxygen and capacity limited thermal tolerance [4] was applied to determine the thermal tolerance and putatively synergistic effects of elevated seawater PCO2 in different larval stages of
the crustacean Hyas araneus. We could show that the
three different larval stages ofHyas araneus display dif-ferent upper critical thermal tolerance limits, 25°C in zoea I and zoea II and 22°C in megalopa larvae. Accord-ing to Frederich and Pörtner [5], limited capacities of ventilation and circulation lead to a progressive mis-match between oxygen supply and oxygen demand for maintenance and finally lead to hypoxemia and anaer-obic metabolism beyond the upper critical limit. Upon further warming, standard metabolic rate and heart beat rate decreased. A corresponding decrease in heart rate
and oxygen consumption could also be observed inHyas
araneuslarvae with maximal values for both parameters detected at 25°C in zoea I and zoea II larvae and at 22°C in megalopa larvae and a decrease at 28°C in zoea and at 25°C, in megalopa larvae, respectively. The sharp drop in oxygen consumption of the zoea larvae was correlated with ceased maxilliped beating rates. The concomitant de-crease in heart rates of zoea larvae strongly suggests syn-chronous limitation or onset of failure of both ventilatory and circulatory systems. Different optimum temperature ranges in different larval stages have also been reported
for the kelp crab Taliepus dentatus with the narrowest
window found in the megalopa [13]. The high sensitivity of megalopae to environmental stressors suggests that this larval stage is a physiologically sensitive bottleneck within the life cycle of decapod crustaceans [13,28].
Exposure to elevated seawater PCO2 constrained the
thermal tolerance of zoea stages of Hyas araneusand re-sulted in a downward shift of upper thermal limits that was less pronounced in zoea I larvae than in zoea II larvae. In zoea I larvae, a decrease in thermal tolerance involves a higher oxygen consumption rate reached in control larvae
at 25°C than in those under elevated CO2 indicating an
earlier metabolic depression under elevated CO2. Oxygen
supply (O2 concentration in the hemolymph) was not
measured, however, the collapse in respiration in high
CO2 zoea I larvae was not accompanied by significantly
lower heart rates and maxilliped beating rates. Increasing heart rates at concomitantly decreasing oxygen consump-tion rates, could also be seen in warming larval stages of
two populations of the kelp crabTaliepus dentatus and
were attributed to a progressive mismatch between oxygen demand and oxygen supply [13]. Such pattern of limita-tion was more pronounced in the second zoea stage. The two-way ANOVA detected a significant interaction of
CO2concentration and experimental temperature for the
second zoea stage. At both CO2 concentrations oxygen
consumption increased with increasing temperature. This pattern changed at 25°C with a strong drop of oxygen con-sumption rates of larvae reared at 3300μatm CO2leading to a significant interaction. When larvae were reared at
control CO2 concentration, oxygen consumption
in-creased until 25°C suggesting a reduced thermal tolerance
with increase of CO2concentration. The drop in oxygen
consumption between 22°C and 25°C was accompanied by an earlier decrease in heart rate and ceased maxilliped beating rate at 25°C. In zoea I larvae maxilliped beating rates did not stop until 28°C. Albeit not statistically sig-nificant, a higher resilience of zoea I than in zoea II also becomes visible under hypercapnia where mortality of zoea II larvae doubled compared to controls while dif-ferences in mortality were less pronounced in zoea I larvae (Additional file 1: Figure S1). In the study by Walther et al. [8] on thermal tolerance of adultHyas araneusunder elevated seawaterPCO2, a CO2induced rise in Q10values of heart rate has been proposed to cause the narrowing of thermal window under CO2. Our data are in line with those findings, showing a steep rise in the Q10 values of respir-ation between rearing and critical temperatures in zoea II larvae exposed to high CO2. Higher tissue oxygen demands with increasing temperature might be compensated for to some extent by higher heart rates (albeit not statistically sig-nificant), observed in zoea II larvae under elevated CO2.
The two-way ANOVA also detected a significant
interaction of CO2 concentration and experimental
temperature for the megalopa stage. Patterns of oxygen consumption with increasing temperature were dependent
on seawater CO2concentration. Oxygen consumption of
megalopa reared at 3300μatm started to decrease at 16°C while oxygen consumption of control megalopa continued to increase leading to the significant interaction. In mega-lopa larvae significant higher oxygen consumption rates in
larvae under control compared to high CO2 conditions
were seen at 22°C. These patterns indicate a downward shift of the upper thermal limit at high seawater CO2 at even lower temperatures than found for the zoea stages. This is emphasized by the finding that maximum oxygen consumption rates were reached at 22°C in untreated
megalopa but already at 13°C under CO2. However, no
significant difference between respiration rates of control
and high CO2 megalopa was seen across temperatures
below the critical temperature. Here elevated seawater
PCO2 affected oxygen consumption but not heart rate,
reflecting the CO2 induced mismatch between the two
processes.
Gene expression patterns
The three physiological parameters (oxygen consump-tion, heart rate and maxilliped beat rate) were measured in 9-13-day old zoea I and zoea II larvae and can, thus, be tentatively aligned with the gene expression data for physiological processes like cellular stress/heat shock
re-sponse, acid–base regulation and mitochondrial energy
metabolism studied in zoea I and zoea II at day 15. The gene expression data measured on other developmental
days support a comparison of CO2responses during the
time course of development in the different larval stages.
Cellular stress/heat shock response
A 5 h heat shock of 20°C caused a strong upregulation
of heat shock proteins HSP 70 (1–4) and heat shock
protein 90 in all three larval stages at any developmental time point. However, there was a stronger response to thermal stress in 15 day old than in 3 day old zoea I and zoea II larvae. Around 70% of all investigated HSPs were up-regulated after the heat shock in zoea I and zoea II on day 15, while around 50% were up-regulated on day 3 in zoea II. These findings indicate that larvae in the early stage phase might be less responsive to the stress than in the late stage phase (Table 2), possibly reflecting a narrowing of thermal tolerance or improved resilience with progressive development (see below). Heat shock proteins help to prevent denaturation of proteins and to refold denatured proteins. The high degree of
up-regulation of HSP 70 and HSP 90 inHyas araneuslarvae
suggests that 20°C is close to the upper thermal limits seen in the physiological data of both zoea stages.
There was a combined effect of temperature and
PCO2 on HSP70 and HSP90 expression in both zoea
stages ofHyas araneus, resulting in higher HSP expres-sion at 20°C in larvae reared at high CO2(Table 2). This finding was more pronounced in the second zoea stage on day 15 in comparison to the first zoea stage on day 15. In the first zoea stage, high CO2 in synergy with a heat shock of 20°C resulted in an up-regulation of around 30% of all investigated HSPs, while around 60% of all HSPs were up-regulated in the second zoea stage.
This reflects the CO2 induced downward shift in the
upper thermal limit seen in oxygen consumption and heart rate data (see above).
Although there might be a difference between HSP tran-scription and translation, we assume that the strong in-crease in HSP expression inHyas araneusshould result in increased protein levels. HSP70 is an ATP-dependent chaperone and the prevention of heat-induced protein de-naturation is a highly ATP-demanding process. Increased
expression of HSPs starts at some temperature (Ton or
threshold temperature) above the acclimation temperature and increases until a maximum is reached (Tpeak) and ex-pression starts to drop (Toff) [29]. In marine organisms,
Tonwas found to be close to the upper pejus temperature at which mortality starts to rise [30], whileToff was close to the upper critical temperature at which survival was strongly compromised [29]. There was a correlated de-crease of heart rate and HSP expression in three decapod crustaceans [31]. The heat shock response and threshold temperature for HSP induction is highly plastic respond-ing to acclimation and habitat [29,32]. Higher threshold temperatures for heat shock protein production as found in warm-acclimatized or summer animals reflect the shifted limits of thermal tolerance and also a trade-off between costs for passive thermal tolerance and costs of thermal denaturation of the protein pool at low HSP levels [32,33]. Again, the synergistic effects of elevated
PCO2and heat shock leading to higher HSP expression
in high CO2zoea larvae could indicate a left shift of the three key characteristics of the heat-shock response, Ton, Tpeak and Toff, equivalent to the left-shift of the OCLTT thresholds.
An up-regulation of HSP70 in response to more alka-line or acidic seawater conditions than experienced in their natural environment could also be seen in the Antarctic bivalve Laternula elliptica [34], indicating a central role of HSPs in stabilizing enzymes outside their pH optimum. This function might become especially evident when pH changes are extreme or occur together with other stressors. CO2sensitivities of different marine taxa seem to be highly dependent on their capacities to regulate blood acid–base disturbances at elevated sea-waterPCO2[35]. The capacity to regulate acid–base dis-turbances might become limited when organisms are exposed to temperature extremes. As elevated seawater CO2and temperature concomitantly affect the acid–base status, strong acid–base disturbances leading to reduced protein function may be responsible for an up-regulation
of HSP at high CO2and elevated temperature.
There was no combined effect of elevated seawater
PCO2 and heat shock on the gene expression of heat
shock proteins in megalopa larvae. Previous studies already suggested a stronger response of the megalopa
stage of Arctic Hyas araneus to thermal stress than to
enhanced CO2levels [28]. CO2effects also tend to
van-ish in Hyas araneus megalopa larvae from a temperate
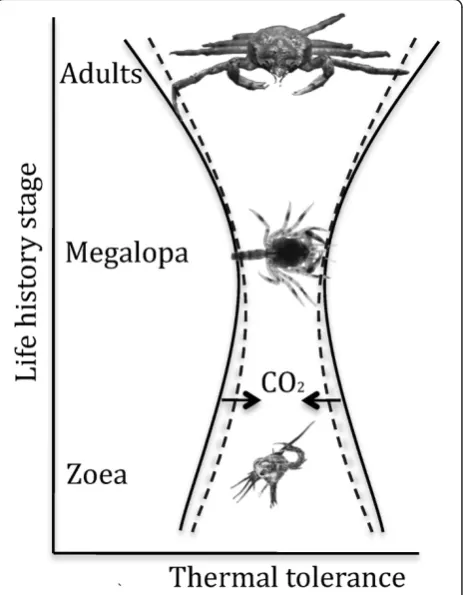
population around Helgoland (North sea) [28]. The nar-row thermal window of the megalopa indicates distinct stenothermy of this larval stage, which might prevent further narrowing under hypercapnia-exposure or re-duce the possibility to detect any small differences in its thermal tolerance. High thermal sensitivity of the mega-lopa under control conditions is then paralleled by the limited capacity of stress response mechanisms to shift thermal limits or enhance the capacity for passive ther-mal tolerance, emphasizing the inflexibility or bottleneck characteristics of this larval stage (Figure 4).
Neither exposure to 20°C nor high CO2 concentration
induced an elevated expression of HSP60 in allHyas ara-neuslarval stages. HSP60 is a mitochondrial matrix protein and is involved in the folding of polypeptides into complex mitochondrial enzymes [36]. In crustaceans, HSP60 was found to respond to bacterial infections and contaminant exposures [37,38] and might play a more important role in the immune response than during heat stress. Heat shock protein 26 was the only heat shock protein down regulated at increased temperature. These findings are in line with those of Al-Fageeh et al. [39] and Colinet et al. [40] who
found that HSP26 was induced by cold inDrosophila
mel-anogaster and mammalian cells. This indicates a greater significance of HSP 26 during cold exposure.
Acid–base regulation and mitochondrial energy
metabolism
Hyas araneuslarvae displaying limited thermal tolerance at elevated seawaterPCO2mirrors findings in adult speci-mens of edible and spider crabs [7,8]. This limitation might be attributed to the elevation in CO2levels or an in-complete compensation of extracellular acidosis. It is
known that elevated seawater PCO2 leads to decreasing
Figure 4Conceptual model of ontogenetic changes in the thermal tolerance ofHyas araneus.High seawater CO2concentration
mainly narrows the thermal tolerance of adults and zoea stages (dashed line), while the low thermal tolerance of megalopa larvae might not be further limited at high CO2.
extracellular pH inHyas araneusadults [10] which might cause metabolic depression in tissues and cells as found in invertebrates and fish [25,41]. Metabolic depression might concomitantly decrease the capacity to increase aerobic energy turnover at increasing temperatures. In our study, gene expression of acid–base related transporters and en-zymes as well as enen-zymes from mitochondrial pathways
were examined to determine whether or not acid–base
regulation and/or metabolism respond to elevated sea-waterPCO2at a transcriptomic level.
Acid–base regulation under elevated CO2 mainly
in-volves active ion transporters like H+-ATPase or trans-porters (sodium potassium chloride cotransporter NKCC; sodium bicarbonate co-transporter NBC), depending on the ion gradient maintained by sodium potassium ATPase (NaK). Carbonic anhydrase (CA) facilitates the formation of bicarbonate [35,42]. Transcript sequences related to ion and acid–base regulation and responding to thermal stress
(CA, NaK, NKCC), were down regulated inHyas araneus
larvae from both CO2treatments (Table 3), reflecting ther-mal compensation as higher specific enzyme activities in the warmth might allow for reduced gene expression. This is in line with findings by Edge et al. [43] on coral gene ex-pression associated with stressful temperature conditions. Coral carbonic anhydrase also showed a decrease in expres-sion at elevated temperatures. Conversely, fish responded to cold acclimation by enhancing Na+K+-ATPase gene ex-pression [44]. InHyas araneusthermal compensation takes priority over CO2acclimation as all larval stages showed no strong response in the expression of transporters and en-zymes to high seawater CO2levels.
In gills of adult zebrafish metabolic depression ob-served during hypoxia was indicated by the repression of genes in the citric acid cycle and in the electron
transport system [27]. InHyas araneuslarvae gene
ex-pression of various genes from the citric acid cycle and the electron transport system gave no indication of
CO2 induced metabolic depression. Again the
down-regulation of genes was mainly associated with an in-crease in temperature and in line with effects typically seen in warm acclimated eurytherms [45].
The majority of genes from mitochondrial metabolic
pathways responding to CO2 stress were up-regulated
(Table 4). Up-regulation of enzymes of the electron transport system and the citric acid cycle in larvae
reared at elevated seawater PCO2 could indicate
com-pensation for elevated demand on mitochondrial energy or compensation for reduced mitochondrial capacities
under elevated CO2 levels. The latter seems to be the
case. An increased energy demand in high CO2 larvae
should be reflected in higher metabolic rates, which was
not observed in Hyas araneus. It seems that a larger
number of enzymes was necessary for the maintenance
of standard metabolism in the high CO2 treatment,
possibly caused by lowered enzyme activities at elevated seawater PCO2. Strobel et al. [46] reported lower cyto-chrome c oxidase activity in the Antarctic fishNotothenia rossii exposed to seawater CO2levels of 2000 μatm. Fur-thermore, bicarbonate inhibits citrate synthase in mouse kidney mitochondria [47] and activates adenylyl cyclase, which produces the second messenger cAMP involved in enzyme regulation by phosphorylation and also transcrip-tion factor regulatranscrip-tion [48,49]. As bicarbonate levels rise in parallel to rising CO2 levels in intracellular as well as extracellular compartments in marine organisms [46,50], it might inhibit enzymes of the mitochondrial metabolic pathways. An up-regulation of these enzymes, as we found inHyas araneuslarvae, could be a compensatory measure to maintain standard metabolic rates and aerobic scope at high seawater CO2levels.
Interestingly, these regulatory shifts in ion transport and metabolism were mainly seen in 3 day old zoea II, paralleled by a lower heat shock response than in 15 day old zoea II. 63% and 27% of the corresponding genes
were up-regulated in zoea II reared at high CO2on day
3 and day 15, respectively. This may again indicate a lower resilience in the earlier developmental stages and a lower capacity to maintain cellular homeostasis. A de-creased heat shock response results in a lower protec-tion of proteins, thus the identified decrease in gene expression of the analysed corresponding proteins might also indicate a destruction of the proteins, which cannot be seen in the 15 day old zoea II. Alternatively and more likely, 3 day old zoea II may be more thermally tolerant and still within their thermal window such that they are able to compensate for high seawater CO2levels by the up and down regulation of enzymes supporting cellular homeostasis and/or metabolic pathway fluxes. In contrast, less thermally tolerant 15 day old zoea II would already be forced to protect their proteins by an increased HSP re-sponse for passive survival indicating that they are beyond the temperature where regulatory mechanisms can main-tain cellular functioning. Further research needs to test these alternative hypotheses.
Conclusion
Our findings reveal differences in thermal tolerance be-tween the three larval stages of the spider crabHyas
ara-neus with the narrowest window found in the megalopa.
Exposure to elevated seawater PCO2narrowed the
ther-mal tolerance window of zoea larvae causing a breakdown in respiration and heart rate at a lower temperature than under control conditions. The distinct stenothermy of the megalopa stage might prevent further limitation of ther-mal tolerance during hypercapnic exposure.
In previous studies, effects of elevated seawaterPCO2 on thermal tolerance of marine organisms focused on whole animal performance, showing synergistic effects
of high CO2and high temperature [8-10]. However, our knowledge of mechanisms affected by both factors and shaping sensitivities of an organism to ocean acidifica-tion and warming is far from complete and further stud-ies are necessary. In the present study, we were able to unravel mechanisms at the molecular level that are
af-fected by high temperature, high CO2and the combined
action of both factors. In different larval stages of the spider crabHyas araneus, we found a strong CO2effect with an up-regulation of genes involved in oxidative phosphorylation indicating potential compensation for enzyme activities being limited by bicarbonate inhibition. A strong increase in HSP expression in zoea stages of Hyas araneus under heat stress and CO2reflects an ex-acerbation of thermal stress and the capacity to adjust tolerance at the edges of the thermal window. Our study underlines the importance of integrative approaches to link molecular and cellular to whole organism responses to understand the biological consequences of ocean warming and acidification.
Methods
Larval collection and maintenance
Ovigerous females ofHyas araneuswere collected by local fishermen in Gullmarsfjorden (west coast of Sweden, at 32 PSU and 15°C) in September 2010 and transferred to the Alfred Wegener Institute in Bremerhaven. They were maintained in flow-through aquaria at 10°C, 32 PSU and a constant dark: light cycle (12 h: 12 h). During larval hatch-ing, which started in June 2011, twelve females were placed individually in 2 l aquaria to collect larvae of each female separately. Equal numbers of newly hatched larvae of the twelve females were pooled and subsequently trans-ferred into 0,5 l enclosed culture vessels at a density of 30 individuals per vessel for the zoea larvae. The density was reduced to 15 larvae for the bigger megalopa stage. All ex-periments were conducted with larvae that had hatched within 24 h. They were reared in enclosed culture vessels filled with seawater of different CO2 concentrations at a constant temperature of 10.0 ± 0.5°C and a salinity of 31.8 PSU (450 μatm: control treatment; 3300 μatm: high CO2 treatment). Zoea I that moulted into the zoea II stage or zoea II that moulted into the megalopa stage at the same day were pooled together into another culture vessel at a maximum of 30 zoea larvae or 15 megalopa larvae, respect-ively. Seawater was provided from reservoir tanks (60 l) at 10.0 ± 0.5°C and a salinity of 31.8 PSU, continuously bubbled with an air/CO2mixture using a mass flow controller (HTK
Hamburg GmbH, Germany). Seawater in culture vessels and food (freshly hatchedArtemiasp. nauplii, Sanders Brine Shrimp Company, Ogden, Utah, USA) were changed daily and dead larvae and moults were removed. Water physico-chemistry was monitored by measuring temperature, salinity and pH (NBS scale, pHNBS, corrected by Dixon buffered sea-water) and the collections of water samples for the deter-mination of dissolved inorganic carbon (DIC). WaterPCO2 was calculated from DIC, pHNBS, temperature and salinity using the program CO2SYS [51] (Table 6).
Larval mortality
About 200 zoea I and 120 zoea II larvae per treatment were used for investigating the effect of elevated CO2on the larval mortality. Mortality (number of dead zoea) were recorded on a daily basis until all larvae were either dead or moulted into the zoea II. Dead larvae and zoea II were removed. Larval total mortality were calculated and expressed as percentage.
Determination of the larval thermal tolerance window All experiments were conducted during the middle of larval development with 9-13-day old zoea I and zoea II larvae and 14-18-day old megalopa larvae as thermal tol-erance might change with development time. Measure-ments started at the rearing temperature of 10°C. After each measurement temperature was increased to the next experimental temperature by 3°C in 30 min. Experi-mental temperatures were 10°C, 13°C, 16°C, 19°C, 22°C, 25°C and 28°C. At each temperature, oxygen consump-tion, heart rate and maxilliped beat rate were measured in the various larval stages.
Oxygen consumption
Oxygen consumption rates of individual larvae were measured in closed, double-walled respiration chambers (OXY041 A, Collotec Meßtechnik GmbH, Niddatal, Germany). Chambers were connected via tubing to a thermostatted water bath to control temperature. Oxygen saturation was recorded by oxygen micro-optodes (NTH-PSt1-L5-TF-NS*46/0,80-YOP, PreSens GmbH, Regensburg, Germany), connected to a Microx TX3 oxygen meter (PreSens GmbH, Regensburg, Germany).
For measurements, the larvae were transferred into the respiration chamber. After each measurement, the next ex-perimental temperature was established within half an hour. Between each measurement during adjustment of the new experimental temperature, larvae were maintained
Table 6 Seawater parameters measured during incubation
Incubation Temperature (C°) pHT DIC (μmol/kg) PCO2(μatm) Salinity (PSU)
Control 10.0 ± 0.5 8.04 ± 0.03 2277 ± 25 428 ± 35 31.8 ± 0.3
High CO2 10.0 ± 0.5 7.18 ± 0.03 2473 ± 67 3390 ± 169 31.8 ± 0.3
Values are given in mean ± SD. N = 5 pHT: pH total scale; DIC: dissolved inorganic carbon;PCO2: partial pressure of CO2.
in culture vessels containing seawater of the
correspond-ing CO2 concentration, which were placed in the
thermostatted water bath to increase the temperature ac-cording to the experimental protocol. Afterwards larvae were allowed to acclimate for half an hour before being transferred to the respiration chamber. The plunger of the chamber lid was inserted and the volume of the chamber
was reduced to 150 μl. The needle of the micro-sensor
was inserted into the chamber through a hole in the lid and the sensitive tip of the optode was placed in the mid-dle of the chamber. Respiration measurements were car-ried out for thirty minutes. Before each measurement, blanks were run to consider bacterial oxygen consump-tion. Larval oxygen consumption was expressed asμgO2* mg DW−1*h−1to allow for treatment-specific differences in larval dry weight. For all larval stages, at least six larvae
from each CO2treatment were used to measure oxygen
consumption. Individual larvae were measured at each ex-perimental temperature.
After respiration measurements at the highest experi-mental temperature of 28°C, larvae were removed from the chamber and briefly rinsed with deionized water and blotted dry. For dry weight determination, larvae were
stored at −20°C in pre-weighed tin cartridges,
freeze-dried over night and subsequently weighed on a high precision balance (Mettler Toledo AG, Greifensee, CH-8606, CH).
Heart rate and maxilliped beat rate
Heart rates of individual larvae were measured according to Storch et al. [13]. Heart rate was recorded using a digital camera (AxioCam MRm, Carl Zeiss, Mikroimaging GmbH, Göttingen, Germany) mounted onto a microscope (Axio Observer A1, Carl Zeiss). Larvae were placed under the scope in a temperature-controlled flow-through micro-chamber (built at Alfred Wegener Institute, Bremerhaven,
Germany) filled with seawater of the corresponding CO2
concentration, which allowed changing the temperature according to the experimental protocol without disturbing the larvae. Temperature controlled seawater (10°C, 32PSU) was provided from a reservoir vessel placed in the thermostatted water bath and was pumped through the chamber with a flow rate of 5 ml/min to avoid a decrease in oxygen concentration due to larval respiration. Before closing the chamber, larvae were positioned in the centre of the micro-chamber by gluing the carapace to a thin glass spine, which itself was attached to a glass table. Larvae were left for 1 h to recover from handling stress and were videotaped for 1 min. Afterwards temperature was changed according to the protocol described above and at each ex-perimental temperature the larvae were videotaped for 1 min. The video sequence was analysed for heart and maxilliped beat rates, respectively, by counting the beats min−1. The beating heart can easily be seen through the
transparent carapace. Heart rate and maxilliped beat rate was calculated for each larva as the mean number of beats min−1± SE from three 10s intervals. For all larval stages, five larvae from each CO2treatment were used to measure heart rates. The same five individual larvae were used to calculate maxilliped beat rates. Individual larvae were mea-sured at each experimental temperature. Unfortunately, no data on pleopod beat rate of the megalopa stage could be obtained, as pleopod beating was too inconsistent for calculations.
Gene expression patterns Sampling
Samples were taken on day 0 and day 15 post hatching in zoea I larvae, on day 3 and day 15 post moulting in zoea II and on day 3 in megalopa larvae. These time points were chosen to analyse hypercapnia-induced changes in gene expression at different time point within the larval
devel-opment as CO2sensitivities might change with
develop-ment time. On day 15, gene expression can be aligned to whole organism performance. Unfortunately, no data on gene expression could be obtained for the megalopa stage on day 15 due to loss of samples during RNA isolation. At each time point batches of 15 to 20 larvae (depending on larval stage) were transferred into 1.5 ml Eppendorf tubes containing RNAlater (Ambion, Austin, TX) and stored at
−80°C. One batch of larvae from each CO2treatment was sampled directly from the culture vessel, while a second batch from each CO2treatment was heat shocked by trans-ferring the larvae from the rearing temperature of 10°C into a 2 l glass jar containing seawater of 20°C and the corre-sponding CO2concentration. The glass jar was placed in a thermostatted water bath to keep the temperature constant. After 5 hours at 20°C larvae were sampled and frozen as
described above. Each treatment (control/high CO2
con-centration at 10°C and 20°C, respectively) was replicated five times and for each replicate isolation of RNA and real-time PCR was conducted.
Isolation of RNA
Frozen samples were thawed and larvae were transferred from RNAlater into homogenisation buffer (Qiagen, Hilden, Germany). Larvae were homogenized in a Precellys homogenizer (Bertin Technologies, France) using 2 ml homogenisation tubes. Afterwards total RNA was ex-tracted using the RNeasy kit (Qiagen, Hilden, Germany) following the manual. Extracted RNA was solubilized in 0.1 mM EDTA and 10 mM Tris and RNA purity and con-centration were determined using a Thermal Scientific Nanodrop 2000 spectrometer.
Quantitative real-time PCR
10μg of total RNA was treated with DNAse (Turbo
DNA-free, Ambion) in order to digest genomic DNA remnants
Table 7 Primers of 21 genes used for RT-qPCR
Primer ID Protein description Primer sequence Primer efficiency
Cellular stress/heat shock response
HSP 26 Heat shock protein 26 F_AGGCAAGAGGCCGACAGA 1.98
B_AAGCGGCGGTTGAAACG
HSP 60 Heat shock protein 60 F_GCCAACGGCACCTTCGT 1.99
B_CCTTGGTGGGATCGATGATT
HSP 70_1 Heat shock protein 70 F_AGCACTTCGTCGGCTAAGGA 2.01
B_CCTGGGCAGATGATGAAAGAG
HSP 70_2 Heat shock protein 70 F_GTGTGGGCGTGTTCAAGAATG 2.03
B_CGGTTGCCCTGGTCGTT
HSP 70_3 Heat shock protein 70 F_CAACGTGCTCATCTTCGATCTG 1.98
B_CTCGATGGTCAGGATGGATACA
HSP 70_4 Heat shock protein 70 F_CCAACATGTCGGGAGAGATGA 2.00
B_CATGAGCGTTCCCCTAGGAA
HSP 90 Heat shock protein 90 F_GACACATCCACCATGGGATACA 2.03
B_TGCTGTGGTCTGGGTTGATC
Acid–base regulation
CA Carbonic anhydrase F_TACGTGTCGGCCGATAGCA 1.92
B_AAAGTCCGACCCGCTTCAC
NBC Sodium bicarbonate cotransporter F_CCGCCGTCATTGTCAACAG 2.01
B_TGGTATCCGCCACCCTTCT
NKA Sodium potassium ATPase F_CCCCGAGAGGATCCTTGAAC 2.06
B_AGGCTTCTCCTCGCCATTC
NKCC Sodium potassium chloride cotransporter F_GGGCAAGGACATCAGAAAGG 1.96
B_TCTACTTCACGGCGGAGCTT
NHE Sodium hydrogen exchanger F_GCGGAGACCTGCTGGCTAT 1.99
B_CGACTTGGCTAACACGTATTGG
VA V1-ATPase F_CACCCCATCCCCGATCTC 1.96
B_CTGCCGCTCCACGTAGATTT
Mitochondrial energy metabolism
atpA ATP synthase F_GGTGAATACTTCCGCGACAAC 1.96
B_TGCTTGGACAGATCGTCGTAGA
CCR Cytochrome C reductase F_GATCAGACCCAGACCAGTCCTT 1.99
B_CATAGCGCCGGAGGTGTT
COX Cytochrome C oxidase F_CGCTGCAGATGTTATTCACTCAT 1.99
B_TCCAGGGATAGCATCAGCTTTT
IDH Isocitrate dehydrogenase F_TGGCTCAAAAGAGGACCTATGCA 1.95
B_CCACCACCGGGTTCTTCAC
NAD NADH dehydrogenase F_CCCATAATTAACATCTCGGCAA 1.98
B_CTGCCCACATTGATTTAGCTTTT
SDH Succinate dehydrogenase F_CTCCGAGGAGAGGCTCAAGA 2.02
B_GGTGTGGCAGCGGTATACG