Abstract—In the study of the urban heat island, the correlation between surface temperature and air temperature near the ground remains an interesting topic, especially under the different underlying surfaces. This paper investigates such correlations based on the data collected in 7 matrixes, each with 24 sets of data, in Wuhan in August 2015. Regression analysis method is used with Ts and Ta of different times and different underlying surfaces, and this analysis can help to explore the mechanism of the differences. The paper comes to the following conclusions: 1). On different underlying surfaces, Ts and Ta are not consistent. The coefficient of determination of the degree of fitting of hard paving and open space is better, then, arbor, bush and meadow, in turn reducing. Water space is least. 2). On the same time node, with the increase of solar radiation, the difference between Ts and Ta reduces and the rate of Ts is higher than Ta. 3. On different underlying surfaces and time nodes, Ts changes faster than Ta and the difference of Ta and Ts is maximized at 14 o'clock of the day, among which the difference of hard pavement is the greatest, followed by open space, meadow, bush, arbor and water. In the process of urbanization, the heat island will increasingly evolve with road-hardening and building density increasing. Therefore, we should make effort to increase the area of underlying surfaces of greenbelt and water in order to reduce the heat island effect and to enhance human body comfort.
Index Terms—Surface temperature, near-surface air temperature, correlations, Wuhan.
I. INTRODUCTION
In current study, the correlations between surface temperature and air temperature near the ground remain an interesting topic. However, Researchers often encounter some difficulties. The near-surface air temperature data is also needed on the research of human comfort and energy saving. According to the opinion of regional surface energy balance, there must be energy ties between the surface temperature and the near-surface temperature. Some study quantitatively investigated the ratio of the radiant flux densities of surface temperature and air temperature [1]. A model simulation was established for the relationship between terrestrial deep soil temperature (TDST) and surface temperature (SAT) [2], Sea-surface temperature and air temperature are also studied [3], [4].
In the study of urban heat island, remote sensing inversion is frequently used, but it lacks effective formula for the
Manuscript received June 3, 2016; revised December 16, 2016. The authors are with School of Resources and Environmental Science of Hubei University, Wuhan 430062, P.R. China (e-mail:[email protected], [email protected]).
inversion of air temperature through surface temperature and the correlation-building is necessary. Some study used monitoring data of meteorological stations, but there are three problems: firstly, the meteorological station layout does not take temperature and other factors into account. Secondly, the meteorological station height is unscientific, which means that there is no unified sign for meteorological monitoring data of Ta and Ts, and then the correlations could not be established. Finally, Ta and Ts are transient data, which is hard to be accurately monitored by meteorological stations. Most of the previous researches have been done using the data from satellite and meteorological stations, without the support of on-site measured data [5]-[8]. There are a few researches involving the surface temperature and near-surface temperatures of meadows [9], [10]).
To sum up, few practice has been observed to use the on-site measured data to establish the correlations by Ts and Ta, especially on different underlying surfaces, which should be studied in-depth. It is of great significance for researchers to conduct urban heat island study to enhance human body comfort and to make the cities more livable.
This paper, based on the on-site measurement data in central area of Wuhan in August 2015, makes the regression analysis using SPSS model. The main purpose of the study is to analysis correlations between Ts and Ta on different underlying surfaces and different time nodes, in order to reduce the heat and to increase the human body comfort in Wuhan. Near-surface air temperature directly affects the human body temperature feeling and comfort. In big cities affected by heat islands, it is hard to reduce the surface temperature, but we can try to reduce the near-surface air temperature to improve human body comfort by reducing hard pavement and bare lands and increasing meadow and water surface.
II. METHODS
A. Overview of the Study Area
Wuhan is located in the east of Jianghan plain in the middle reaches of Yangtze River. It’s the central city of central China, 113°41'E-115°05'E and 29°58'N -31°22′N. The area of Wuhan reaches 8494.41 square kilometers, with the built-up area of 552.61 square kilometers (Fig. 1). Forest covers 27.31% and green land covers 39.09%. Wuhan is known as the "heart" at the economic geography in China.
With the accelerating process of urbanization, the effect of urban heat island increases gradually. As we know, Wuhan is
Study on the Correlations between Surface Temperature
and Near-Surface Air Temperature on Different
Underlying Surfaces in City of Wuhan, China
also called "Blast furnace". On one hand, Wuhan is surrounded by special geographical environment, exposing "concave"-shaped terrain. As located in the middle reaches of the Yangtze River, Wuhan is often controlled by the subtropical anticyclone in summer, with air sinking and warming, insufficient cloud cover, strong solar radiation. What is more, there are massive evaporation of water vapor, making it like a "steamer". On the other hand, spatial distribution of surface temperature in Wuhan shows typical characteristics of the urban heat island. According to the research, "heat island" area covers 27.7% and 39.1% of the city in 1987 and 2013 [11].
The average annual temperatures and minimum temperature is on the rise in the last century, respectively by 0.014 ℃/10a and 0.0260 ℃/10a. From the annual temperature curve, as controlled by the subtropical, the average high temperature of Wuhan is up to 33 ℃ in August. When resident population reaching 1060.77 million in Wuhan, it is particularly important to study the correlations between temperature and the habitat.
Fig. 1. Location of the study area.
B. Study Design
With net radiation on the ground increasing, Ta and Ts is rising. Earth’s surface transports energy and storage it in the soil, which making the peak time of temperature lag. Average daily temperature is generally higher than the air temperature because the heating source of atmospheric is Earth’s surface. We chose summer to measure because summer heat-island effect on the human body largest.
1) Preparation: Research group prepared for survey, including selecting, table making. Researchers should be familiar with the instruments and obtained permission before July 2015.
2) Fieldwork investigation: We measured in August for one-week continuous sunny day was chosen to measure in August. During this time, the weather continued sunny. Among this, average temperature was 32.5 ℃, the maximum temperature reached 36.5 ℃, average wind speed reached 0.8m/s and average daily humidity reached 70%. The weather condition is stable, which can better reflect summer weather conditions in Wuhan. Time was measured in 6:00, 9:00, 12:00, 13:30, 15:00, 19:00 and 21:00.
3) Research: Researchers are divided into four groups, each measuring 7 matrix (Fig. 2). There are park, water area, residential community, commercial district, mountain, suburbs and industrial area. Seven typical matrixes were selected in the city proper of Wuhan. Zhongshan Park provides a good place for the surrounding residents. East Lake is the largest lake in area in Wuhan. Among them, Shenjiawan community and lakeside community, representing high-level residential area and average residential area, are chosen to represent the case of residential areas. Hankou's most bustling international financial center is selected to present commercial district. Vegetation cover is better in Ma'anshan mountain. Jiufeng village represents suburban areas. Wuhan Iron and Steel Co. is selected to represent industrial zones, where environmental quality are poor.
Fig. 2. Locations of the investigation sites.
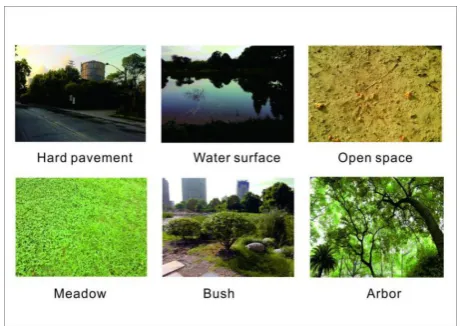
A matrix contains 24 sets of data, two places by each surveying group and each place with 3 sets of data. Each set of data contains 6 kinds of underlying surfaces: hard paving, water surface, open space, meadow, bush and arbor (Fig. 3). We chose road to represent hard pavement, lakes for water surface, bare ground for open space, turf for meadow, low shrubs for bush and tall trees for arbor, which are on behalf of urban surface properties.
Fig. 3. Six types of underlying surfaces.
During the investigation, the weather condition is stable. Four groups conducted the measurement at the same time to ensure the reasonableness of data. Three sets of data were averaged for each location to reduce measurement error.
Existing near-surface air temperatures are frequently measured at meteorological stations, which may not represent the actual temperatures. This paper reveals the correlations between Ts and Ta by measured data.
In this paper, the research data comes from the on-site measurement of seven matrixes, each with 24 sets of data in Wuhan in August. Ta and Ts is required for this study and the remaining data are measured to monitoring weather conditions. Three instruments are used in the surveys. The model of thehandheld weather station is NK4500, measuring 1.5M temperature, air humidity, wind speed, air pressure and thermal stress index. Model of the infrared thermometer is UT300A, measuring the surface temperature. And model of the plant canopy analyzers is ECA-GG01, measuring tree coverage.
Sunny summer was selected for survey. The survey avoided interference of anthropogenic heat, such as air conditioning and car exhaust. Typical underlying surfaces of the city were selected to measure, such as hard pavement, water space, open space, meadow, bush and arbor. Observation points stay away from high buildings to reduce the effecting of environment infrared radiation. There was no water in observation points, and no human watering on grass to avoid surface evaporation endothermic effecting on observation value. With handheld weather station and infrared thermometer, air temperature and surface temperature were simultaneous observed.
This paper makes the regression analysis using SPSS model. Firstly, different underlying surfaces for the surface temperature and near-surface air temperature data were sorted and eliminated manual errors. Then, the regression analysis with Ts and Ta at different time nodes and on different underlying surfaces is done and Pearson correlation analysis can help to explore the mechanism of differences between them. Finally, the fitted curve and the goodness-of-fit were found to solve the problem.
III. RESULTS
A. Ts and Ta on Different Underlying Surfaces
Underlying surface is the earth surface which contact with lower atmosphere, such as sand, grass, cultivated land, snow and marine. The absorption and reflection of the sun reflection ratio is different on different underlying surfaces. The regression analysis with Ts and Ta of different time nodes were done on different underlying surfaces, such as hard paving, water surface, open space, meadow, bush and arbor. The fittest model is selected to make the curve fitting and it can help to explore the mechanism of the differences between Ta and Ts.
Hard pavement includes road, marble flooring, concrete floor, tiled floor, stamping ground and grass bricks, generally used for outdoor landscape. Under the bilateral inspection of 1%, the relevance of hard pavement surface reaches 90.0%. It shows that Ta and Ts have strong spatial correlation up to 0.912 (Fig. 4). During the urbanization, large areas of hard impermeable paving bring the rising of surface temperature, which cause the air temperature to rise too.
Water surface is a surface consisting of various types of
coverings, and can affect the synthesis of water balance and hydrological processes. Under the bilateral inspection of 1%, the degree of correlation is 53.2% and the correlation coefficient is 0.535 (Fig. 4). Due to the large heat capacity of water, the correlation between Ta and Ts is small.
After the Earth’s surface receiving solar radiation, open space, with no shelter to cover, reflects the greater energy into the air and the correlation of Ts and Ta is high goodness-of-fit (Fig. 4). There are less open spaces of urban landscape, mostly caused by improper human activities.
(a) Hard pavement
(b) Water surface
(c) Open space
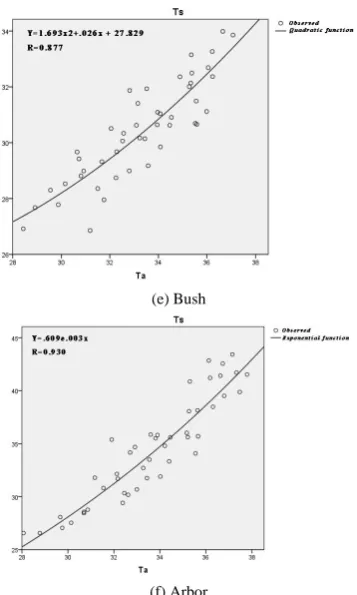
(e) Bush
(f) Arbor
Fig. 4. Different underlying surface temperature and air temperature fitting.
Fig. 5. The correlation between surface temperature and air temperature at different points.
Greenbelt included the meadow, bush and arbor. The correlations in arbor, bush and meadow decreased by order (Fig. 4), which is related with the canopy density, vegetation cover and canopy height. For example, forest canopy can absorb solar radiation to promote transpiration and photosynthesis, so that its temperature is increased less.
On condition of quadratic term, linear model, reciprocal model and S model, their degree of fit are more than 85% (except for water surface). The degree of fit in hard pavement, water surface are better. Greenbelt (meadow, arbor and bush) are moderate and water surface poor.
B. Ts and Ta at the Same Time Nodes
At 6 o’clock, from the mean value, near-surface air temperature is higher than the Earth’s surface temperature. With the increasing in solar radiation, Ta and Ts are the same at 9 o'clock. Solar radiation continues to increase and surface temperature is higher than the near-surface temperature. The difference of temperature reaches maximum at 13 o'clock. Then, both temperatures gradually decreased and they are the same at 18 o'clock. At night, Ts is lower than Ta.
By comparing with Ta and Ts in various periods of the day, we can easily find that Ta is higher than Ts at night. With the increase of solar radiation, the surface temperature catches up with near-surface temperature, which implies that solar radiation is the main reason. On the same time node, Ta changes slowly, while Ts changes greatly (Fig. 5). The rate of change in Ta and Ts are inconsistent.
C. Ts and Ta on Different Underlying Surfaces at Different Time Nodes
1) Comparative analysis of different underlying surfaces Underlying surfaces are difference due to different thermal properties of substances, which result in the diurnal variation of surface temperature. The difference directly affects the diurnal variation of air temperature and humidity, making different distribution in Ta and Ts.
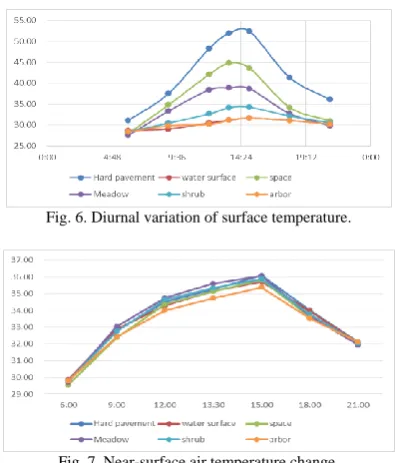
Fig. 6. Diurnal variation of surface temperature.
Fig. 7. Near-surface air temperature change.
Surface temperature reaches the minimum value before sunrise. After sunrise it increases till up to the maximum in the afternoon. Temperature of hard pavement and open space is high, while that of meadow, bush, arbor and water surface descends in order (Fig. 6). After sunset, the temperature drops rapidly. Due to tree's high leaf area index, leave's strong transpiration, water's large specific heat capacity, the temperature of bush, arbor and water surface have the slowest heating rate and cooling rates. Open space and hard pavement warm fast and cool fast, too. The thermal capacity of hard pavement is larger than that of open space, so its warming rate is lower than that of open space. Its surface temperature reached the highest value, slower than that of open space, and cooling rate also slower. But the surface temperature of hard pavement is higher than that of open
space, much higher than those of meadow and water surface. After approximately 20:00, the surface temperature of hard pavement is higher. The above mentioned reasons lead to the urban heat island phenomenon at night.
The change in near-surface temperature is similar to that of the surface temperature because solar radiation has smaller effect on air temperature. Under the direct radiation of the sun, the surface temperature of hard pavement and open space are 9.87 ℃ and 3.67 ℃ higher than that of grass respectively. While the near-surface temperature, 1.5 meters above the grass, is 0.23 ℃ and 0.37℃ higher than that of the hard pavement and open space respectively (Fig. 7). The near-surface temperatures on difference underlying surfaces vary greatly.
2) Correlations between different surface temperature and near-surface temperature
Near-surface temperature is one of the most important factors affecting the air temperature.
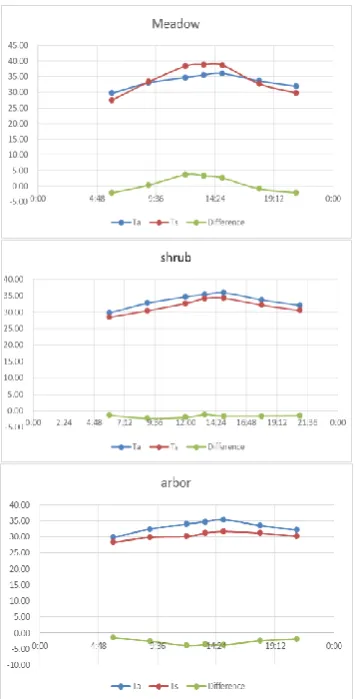
Fig. 8 shows the correlations between Ts and Ta on different underlying surfaces. The surface temperature is a key parameter in the climate system. Ta and Ts have significant influence on ground-air interface energy and water vapor flux exchange.
Fig. 8. Correlations between near-surface air temperatures and surface temperatures on different underlying surfaces.
The correlations are different in six kinds of underlying surfaces. Hard pavement and water surface have the same distribution. Open space is smaller than hard pavement and water space. Ta and Ts distribution are more consistent in meadow because of its heat radiation absorbing performance. Difference in shrub and arbor are small.
To sum up, the variation trend of surface temperature is greater than that of the near-surface air temperature. Surface temperature is low after the sunrise and before sunset, and higher at noon. Underlying surface plays a greater impact on the correlation between Ts and Ta. The difference between hard pavement and open space is very large, and the difference among arbor, bush and meadow is very small (Fig. 8).
IV. CONCLUSION AND DISCUSSION
Underlying surfaces directly affect the temporal and spatial distribution of temperature. As the city expanding, hard pavement gradually replaced the open space. Changes in underlying surfaces have a significant impact on urban temperature. Based on the measured temperature in Wuhan, the correlations between Ta and Ts on different underlying surfaces and different time nodes are analyzed to explore how to reduce urban heat islands, and to increase body comfort. The paper comes to the following conclusions: 1) Underlying surfaces factor
There is a strong correlation between Ts and Ta of the city, but their distribution is not consistent. Six types of
underlying surfaces are described to analyze the difference and reason. Without artificial cooling effects, different underlying surfaces, with different heat capacity, thermal conductivity, thermal inertia, result in the different changing rate of Ta and Ts.
The correlation in hard pavement reaches 90.0%. It shows that Ta and Ts have strong spatial correlation up to 0.912. Under the bilateral inspection of 1%, the degree of correlation is 53.2% and the correlation coefficient is 0.535. Due to the large heat capacity of water, the correlation between Ta and Ts is small. After the Earth’s surface receiving solar radiation, open space, with no shelter to cover, reflect the greater energy into the air and the correlation of Ts and Ta is high. Greenbelt includes the meadow, bush and arbor. The correlation in arbor, bush and meadow, decreases by order, on account of the canopy density, vegetation cover and canopy height.
2) Time factor
Different time nodes are selected to compare different underlying surface air temperature and ground temperature. At 6 o'clock, there are maximum temperature differences on different underlying surfaces. With the increase in solar radiation, the differences reduce. After 18 o'clock, surface temperature and temperature differences are smaller on the six kinds of surfaces. On the same time node, Ta changes slowly, while Ts changes greatly. The rates of change in Ta and Ts are inconsistent.
3) The underlying surfaces and times
Under different surfaces and times, the correlation in Ta and Ts are not consistent. With the increasing in solar radiation, differences increase on different underlying surfaces. Solar radiation directly heats the Earth’s surface. Thermal radiation affects the correlation between Ta and Ts. The changing trend of surface temperature is greater than the air temperature. Surface temperature is small after the sunrise and before sunset, and larger surface temperature at noon. Underlying plays a greater impact on the correlation between Ts and Ta. The difference in hard pavement and open space are larger and those in arbor, bush and meadow are similar.
In accordance with the results of the analysis, the paper proposes some suggestions in urban development: The underlying surfaces are important factors in the correlations in Ta and Ts. In the process of urbanization, the heat island will increasingly evolve with road-hardening and higher building density. On one hand, to maintain a comfortable micro-climate environment, greenbelt should be planted on both sides of rigid pavements, supplemented by bush and meadow. Green roof or green walls can be the additional good choices. One the other hand, speaking of the human feelings, we should pay attention to increasing the area of greenbelt and water surface in order to increase surface heat capacity and enhance human comfort.
cities. These remain for further study. ACKNOWLEDGMENT
I would like to express my gratitude to all those who helped me during the writing of this paper. My deepest gratitude goes first and foremost to Professor Run Wang, Associate Professor Daohua Hu and Qijiao Xie, for their constant encouragement and guidance. Secondly, I would like to thank the project team and the Regional Planning and Environment Institute. Thank you all for your contribution.
REFERENCES
[1] A. Kitamura, T. Izumi, and H. Matsuyama, “Relationship among surface temperature estimated by surface energy budget, ground air temperature and brightness temperature of landsat-5 TM,” Journal of
Geography, vol. 113, no. 4, pp. 495-511, 2004.
[2] F. G. Rouco, H. V. Storch, and E. Zorita, “Deep soil temperature as proxy for surface air-temperature in a coupled model simulation of the last thousand years,” Geophysical Research Letters, vol. 30, no. 21, CLM 4-1, 2003.
[3] C. J. Lolis, A. Bartzokas, and B. D. Katsoulis, “Spatial and temporal 850 hPa air temperature and sea-surface temperature covariances in the Mediterranean region and their connection to atmospheric circulation,”
International Journal of Climatology, vol. 22, no. 6, pp. 663-676, 2002.
[4] V. D. P. R. Silva, F. D. A. S. Sousa, E. P. Cavalcanti et al., “Teleconnections between sea-surface temperature anomalies and air temperature in northeast Brazil,” Journal of Atmospheric and
Solar-Terrestrial Physics, vol. 68, no. 7, pp. 781-792, 2006.
[5] B. Lin and Y. M. Hsu, “Contrast surface temperature and air temperature based on Landsat / TM data analysis,” Chinese Meteorological Society Annual Meeting s18 New Meteorological Satellite Data, 2015.
[6] Y. Yao, “Division of Han Fang analysis based on estimated temperature and temporal variations of the surface temperature of Modis Hengduan Mountains,” Geographical Science, vol. 66, no. 7, pp. 917-927, 2011.
[7] W. Min and Y. Li, “Correlation MODIS LST synchronized with the ground temperature, ground temperature,” Chinese Meteorological Society.
[8] K. Jiang, S. Liao, and Y. B. Jiang, “Statistical relationship between ground and air temperature,” Chinese Agricultural Meteorology, vol. 25, no. 3, pp. 1-4, 2004.
[9] C. Li and T. Hou, “Such as late interest, and other comparative study underlying surface and near surface temperature grassland surface temperature,” Optical Technology, vol. 35, no. 4, pp. 635-639, 2009. [10] L. Hao, C. L. Gu, and L. Zhao, “Characteristic analysis on grass surface
temperature, ground temperature and temperature variation in lianyungang,” Journal of Meteorological Research & Application,
2015.
[11] Q. J. Xie, “Wuhan urban heat island characteristics and its influencing factors,” Resources and Environment in the Yangtze River Basin, 2016.
Ailing Cai was born in March, 1995. She is a student in
the major of urban and rural planning with School of Resources and Environmental Science of Hubei University, Wuhan 430062, P.R. China, double degree in Business Administration of Business School and was just admitted in the master's program of Peking University. Her current research interest is about environmental planning and human geography.
Daohua Hu was born in October 1969. He is an