Vision Based for Classification of MIG Butt Welding
Joint Defect Using Occurrence Matrices and Gray
Absolute Histogram
Hairol Nizam Mohd Shah, Marizan Sulaiman, Ahmad Zaki Shukor, Zalina Kamis, Mohd Zamzuri Ab Rashid Center for Robotics and Industrial Automation
Faculty of Electrical Engineering Universiti Teknikal Malaysia Melaka
76100 Durian Tunggal, Melaka MALAYSIA
Email: [email protected]
Abstract— This paper will introduced a new approach of vision which is enable to overcome the problems in the vision inspection systems. This system uses 2D gray pixels coocurrence matrix and gray absolute histogram of edge amplitude as the input features extract from the MIG butt welding joints. Images of the welding surfaces are captured using one CCD camera that is mounted on the top which is parallel with the work benches. The images are segmented and the 2D gray value coocurrence matrix consists of energy, correlation, homogeneity and contract, and absolute histogram of the characteristic feature in these images will be calculated. The same process will be applied in zooming image factor by 0.5 to calculated the next characteristic feature values. Finally both feature value is used as the input value in GMM and MLP classifier to classify the welds defect into three categories which are good weld, excess weld and insufficient weld. Results are taken from the 18 MIG butt welding joints samples were tested in overall accuracy recognition rate for MLP is 94.4 % while for GMM is 83.3%. In terms of total computation time, the overall time for MLP is 1.96 m/s and GMM is 1.175 m/s.
Index Term— Occurrence Matrices, Gray Absolute Histogram, Multi-Layer Perceptrons (MLP), Gaussian Mixture Model (GMM), MIG Butt Welding Joint Defect
I. INTRODUCTION
The advanced technology needed in the automation of production processes and quality control inspection to solve welding quality problems has not yet been completely resolved. Because of these shortcomings, active research is needed on inspection and quality control. In industries it often uses X-ray test method for radiographic inspection inside the weld metal. Weld defects used human inspection is a hard and difficult task because many welds defects should be counted and inspected. The human experience and skill of specialized X-ray radiographs testing should be considered in the welds inspection because it affects the particular inspection task in time and human performance.
Recently, methods for welds defects detection and classification in X-ray film or a CCD camera automatically have been investigated to improve processing efficiency and quantify the inspection results. In the related works, we do not combine all the available feature parameter such as intensity,
geometry, texture and linguistic description from the segmented regions of the radiographs to solve the classification problem. A new approach will introduce vision systems using 2D gray pixels coocurrence matrix between the gray value of a pixel and its neighbors and gray absolute histogram of edge amplitude. The gray values is extracted form the MIG butt welding joint and then GMM and MLP classifier are used to classify the weld defects in three categories which are good weld, excess weld and insufficient weld. However the camera calibration process will not be discussed in this paper. This paper is organized as follows: Section 2 represent the related works of the systems, methodology is discussed in Section 3, followed by the test results in Section 4. Section 5 will discuss the conclusion of this research.
II. RELATED WORKS
There are many methods that can be applied to identify the welding joint defects done by the previous researchers. The method recently applied to classify the welding joint defects are fuzzy logic, statistical approach and neural networks. In the bootstrap method [1], MLP neural networks trained more accurately compare to fuzzy K-NN. Meanwhile a statistical interference technique using random selection data with (Bootstrap) and without repositioning was proposed by [2]. The results produced in this work are nearer to the true accuracy of the classifiers. The classes are undercut defect (UC), lack of fusion (LF) and porosity (PO), crack (CR) and slag inclusion (SI). In other works by [3], to improve the system in terms of classification accuracy, instated using all 12 features to 7 features can be done by genetic algorithm generate by better fuzzy expert.
artificial neural network (ANN) with back propagation (BP) and ANN with differential evolutionary algorithm (DEA) separately. Their system obtains the highest accuracy of welds defects using DEA. This vision-based inspection system could be further expanded for classification of images with different types of joints in the welding process.
[8] presented an adaptive-network-based fuzzy inference system (ANFIS) to reduce the number of features used in the input vector from 12 geometrical features to 4 geometrical features as input. This system is not suitable when a data set is unbalanced (number of samples in different classes vary greatly) and the correlation coefficient of a classifier does not represent the true performance of the classifier. Meanwhile [9] used nonlinear classifiers of patterns implemented by artificial neural networks to classify 5 classes case from 4 features weld defects. Hence the defect classes of crack and lack of fusion have not been evaluated by this technique yet.
Researchers in [10] has introduced the fitted line profiles of a weld image by using scale average gray value for each line image so that each profile has approximately the same size. The fuzzy recognition algorithm using a membership value tables by representing gray value variance and gray mean value difference was introduced by [11]. This system is able to meet the requirement of real-time detection speed which achieves 3.5 m/s equal to 3–4 frames/s.
The approach to classify weld defects based on EM and FCMI algorithms is introduced in [12].The system shows that the rate of classification using EM was much better between EM and FCMI by adding Bayes classifier because EM algorithm is very sensitive to the choice of the initial values of parameters. Because of that, the system needs to increase the size of the features vector and the data base in order to identify great classes of weld defects that existed in the industry.
Another approach is proposed by [13] using detection and classification into 7 different classes (including segmented non-defects) comparing some state of the art multi-class classification methods (Support Vector Machines and Neural Networks). Feature selection in the systems is used to limit processing to those features that are actually important for each different class avoiding information redundancy. Their system has lack of public dataset because it requires more images which it needs to be able to be used for algorithm evaluation.
Research in improving the surface and quality of defect has also been carried out in the past. For instance, the classifier methods that has been done by researcher are NEFCLASS [14], mixed fuzzy rule formation [15], naive bayes [14,16-17], decision tree [16], multi layer perceptrons [18], support vision machine (SVM) [19-21] and a multi features fuzzy [22]. The achieved accuracy improvements clearly showed that training set consistency and revising expert decisions during classifier design are of high importance when class labels are uncertain and likely to have errors.
In all the previous works in the identification and classification of welds defect, we have noticed that this issue
has been investigated widely in different ways. Many researchers have used radiographic image rather than CCD camera only as the input acquisition integrated with external light source or control the welding environment to reduce the noise. Most of the researchers used geometrical parameter in feature extraction which includes size, location, attribute and shape of the weld defects [23]. Otherwise they applied data interpreted such as gray value and linguistic description [24]. Perfect knowledge of the geometry of the welds defect is an important step which is essential to appreciate the quality of the weld. In term of how to categories the weld defects, some researcher normally categories the weld defects into type of welds, defect shape, welds flaw and defect information
III. METHODOLOGY
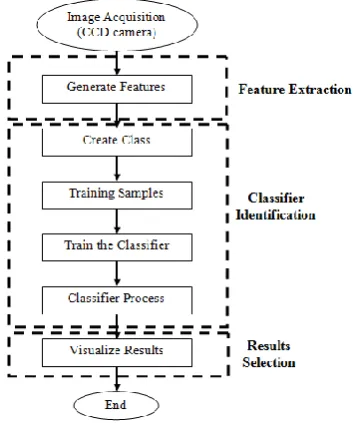
This basic step for our vision systems classification for MIG butt welding joint defect is shown in Fig. 1.The systems is divided into three main parts which are feature extraction, classifier identification and results selection. Feature extraction is the way to obtain the characteristic parameters [25-26] of the butt-welding. These features value that comes out with different classes of the observed object are determined by the classifiers. The classifier will be identify the correct classes depending on the input value from feature extraction and visualize the result according the classifier selection. The type of defects can be classified into three categories according to its joints shapes in MIG butt-welding joints. The sample classification category is based on the expert human eye visualization. Fig. 2 shows the different category of the MIG butt welding joint defect.
Fig. 2. The different category of the butt-welding joints defects
A. Generate Features
Feature is a set of value which is obtained from the description of the object in a numerical form where there many way to select the features. The features selection is important because this features affect the success of any classification algorithm. Many researchers used geometrical parameter in feature extraction which includes size, location, attribute and shape of the weld defects [23]. The other parameters that can be applied to interpret the data are gray value and linguistic description.
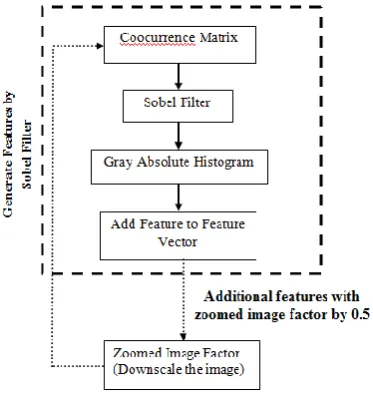
The process to choose the desirable features from the initial set of the features list is called features selection. In the current works, the feature selections uses the coocurrence matrix related and the gray value and absolute gray histogram. There are 72 features parameters defined in order to determine the highest probability of the correct MIG butt welding joint defect. Fig. 3 show the block diagram for generated features by using coocurrence matrix and absolute gray histogram.
Fig. 3. Block diagram for generate features
B. Coocurrence Matrix
The coocurrance matrix is describes the relationship between the gray value of a pixel and the values of its neighboors. This matrix contains two gray values of the probability that will appear next to each other. It is determined from the input regions how often the gray values i and j are located next to each other in a certain direction (0, 45, 90, 135
degrees) and stores this number in the co-occurrence matrix at the locations (i,j) and (j,i) (the matrix is symmetrical) then scales the matrix with the number of entries. The number of gray values to be distinguished is indicates as LdGray. Based on the cooccurrence matrix there are four features that can be computed which are energy, correlation, local homogeneity and contrast The formula for the features indicated by the parameters LdGray and direction as shown in Eq. 1 to 4 where width of coocurrence matrix as witdh and entry of coocurrence matrix as
c
ij.
width j i ij c Energy 0 ,2 (1)
width ji y ij
width j
i x ij
width j i ij width j i ij width j i ij c u i c u i c c j j c i i n Correlatio 0 , 2 0 , 2 0
, , 0 , 0 (2)
width j i ij c j i y Homogeneit 0 , 2 11 (3)
width j i ij c j i Contrast 0 ,2 (4)
C. Gray Absolute Histogram
In gray absolute histogram, the gray value distribution is calculated from the images within the regions. The region of the image is obtained from Sobel filtering [27-31] which is the edge amplitude. The result of absolute histogram contains absolute frequencies of the gray values with the quantization of neighbors gray value of 8 frequencies. The indices i of the frequency value are calculated from the gray values g and the quantization q as in Eq. 5 and 6 where MIN denotes the minimal gray value.
q g
i 0.5 for unsigned image types (5)
q MIN gi 0.5 for signed image types
(6)
D. Gaussian Mixture Model (GMM)
A Gaussian mixture model is the one of the basic theories when dealing with classification comprises the Bayes decision rules. Bayes rules can obtain the minimize probability of erroneously classifying a feature vector by appling the maximize probability for the feature vector x to belong to a class where is called ’a posteriori probability’. The Bayes decision rule can be expressed by Eq. 7 where a posteriori probability as P
wi|x
, a priori probability feature vector xprobability class
w
i as
i
w
P and probability feature vector x as P
x .
x P w P w x P x wP i i
i
|
| (7)
A GMM consist of number of center gaussian centers per class where is set by 1 number only. This center number is not only the exact number but depend on the number of parameter
is used. Each center represent the parameter center
m
j,covariance matrix
C
j and mixing coefficiantP
j. Theseparameter is calculated by using Expectation Maximization (EM) algorithms.
In this paper to calculate the arbitary probability density is acceptable by using only one centers per classes. Then the centers of density functions will be obtained by using a scalar multiple of the identity matrix Cj sjI
2
called as ‘spherical’ as show in Eq. 8. The probability density function
p
(
x
)
canbe calculated by mixing the probabilities
P
jand centers ofdensity functions p(x| j)for the number of sample features
comp
n
is shown in Eq. 9.
2 2 2 2 2 exp 2 1 | j j d j s m x s j x p (8)
nco mp
j j x p j P x p 1 ) | ( ) ( )
( (9)
E. Multi-Layer Perceptrons (MLP)
A multi-layer preceptron (MLP) can be used for classification or regression (function approximation) of the defects depending on output function set. Generally the MLP consists of a number of nodes arranged in multiple layers which is connected with the nodes in the adjacent layers by their weights. MLP has three layers which are an input layer that accepts the input variables (units or neurons), a hidden layer and an output layer. The MLP performs the following steps to calculate the activations
z
jof the hidden units fromthe input data
x
i (the so-called feature vector). The first andsecond layers for MLP model are shown in Eq. 10-12 where weights of input first layer as (1) (1)
, j ji b
w and weights of input
second layer as (2), (2).
k kj b
w
(1),
1 ) 1 ( ) 1 ( j n i i ji
j w x b
a
i
j1,...,nh (10)
z
j
tanh
a
(j1),
h
n
j1,..., (11)
(2),
1 ) 2 ( ) 2 ( k n j j kj j w z b a
h
k1,...,no (12)
The output function for common classification problems with multiple mutually exclusive lasses as output is called
‘softmax’ with number of input layers of 72, number of hidden layers is 100 and the number of output layers is 3 used in this paper. The output functions for ‘softmax’ is show in Eq. 13.
exp
,0 1 ) 2 ( ) 2 (
n k k k k a ay k1,...,no (13)
IV. RESULTS
A. Experimental Setup
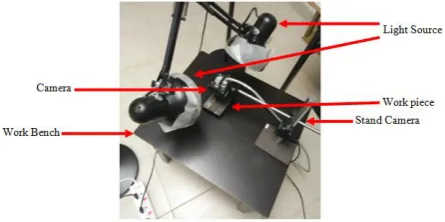
In this works, a system comprising a Basler camera with sensor which delivers 67 frames per second at 2 MP resolution, light of source and framegrabber was developed to digitize and interpret the images. The image of the MIG butt welding joints will be captured by the Basler camera that is fixed parallel with the welding work benches e within 5 cm. The work piece image acquired by the experimental equipment is show in Fig. 4. A total of 18 image of MIG butt welding joints were used for the traning and testing with different orientation but within the workspace area. 18 images will be divided by 6 images in each category. The categories are good weld, excess weld and insufficent weld. All the data from the MIG butt weldding joint images were used in the GMM and MLP classifiers as a input data.
Fig. 4. The work piece image acquired setup
B. Development of the Gaussian mixture model (GMM)
The GMM classifier was implemented using 72 input data with 3 numbers of classes and 1 number of centers per class. The first step to be taken in the development of this classifier was to select the best features vector values from the matrix occurrence and gray value histogram. The matrix occurence consist gray value of corelation, homogenuity, contrast and energy for both none zoomed and zoomed by 0.5. Some tests were carried out in terms of the MIG butt welding joint images quality, type of covariance matrices and type of preprocessing used to transform the feature vectors where the best result were found when adding two additional source on the welding joint images, spherical type on covariance matrices and by using normalization type on prepossessing.
class the feature vector for each category will be defined. The result of the GMM classification will be returned in Class Probability where it is determines by the result of classifying the feature vectors. Table 1 show the result of the class probability using GMM classifier in the butt-welding joint. In the class result, there were only 3 samples that does not meet the correct classes which are 1 sample in good weld and 2 samples in insufficient weld class.
Table I
Result of the class probability using GMM classifier
C. Development of the Multi-Layer Perceptrons (MLP)
The multi-layer perceptrons (MLP) were implemented using 72 numbers of input features with 100 numbers of hidden layers and 3 number of output classes. The important step was to optimize the number of neurons used in the hidden layers to obtain the best accuracy possible in test sets. From the tests carried out, the best function on output layers will be using softmax and the preprocessing to transform the feature vector is normalization type.
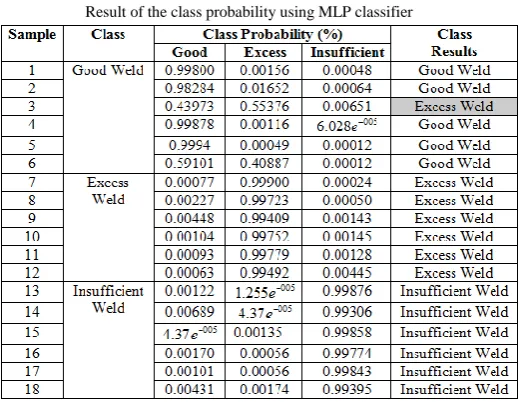
In training MLP classifier, the maximum number iterations of the expectation maximization algorithm are set to 200 and the threshold for the difference of the weights of the MLP between two iterations of optimization is set to 1.0. The result of the MLP classification will be returned in Class Probability where it is determined by the result of classifying the feature vectors with the MLP. In the class results, there is only 1 sample that does not meet the correct class which is in good weld class. Table 2 shows the result of the class probability using MLP classifier in the butt-welding joint.
Table II
Result of the class probability using MLP classifier
D. Performance between the MLP and GMM classifier
The performance of the MLP and GMM classification has been evaluated in term of recognition rate and execution time. The classification performance using occurrence matrix and gray absolute histogram based on feature vectors in MIG butt-welding joints is shown in Table 3. The results obtained in MLP classifier shows the highest accuracy is 100% for excess weld, insufficient weld and the lowest is 83.3% for good weld. The overall accuracy is 94.4%. In GMM classifier, the highest accuracy is 100% for excess weld, 83.8% for good weld and 66.7% for insufficient weld. The overall accuracy is 83.3%. Fig. 5 shows the detail of classification performances for MLP and GMM.
Table III
Classification performance using occurrence matrix and gray absolute histogram
In comparison of computation times, GMM classifier was shortest in computation time compared to MLP classifier. The computation time for GMM classifier is less than 0.07 m/s for each sample with the total computation time of 1.175 m/s. However in this case, even though the GMM classifier has shortest computation time but in terms of accuracy the MLP classifier is the best. Fig. 6 show the comparison of computation time for both classifiers for the classification system in butt-welding joint.
Fig. 6. Classification time for MLP and GMM classifiers
V. CONCLUSION
The vision classification of MIG butt-welding joints using 2D gray pixels coocurrence matrix and gray absolute histogram of edge amplitude as the input have been developed in this paper. The two additional sources light are used to overcome the lack of images characteristic information. The classification is based on MLP classifier and GMM classifier. The MLP classifier provides overall accuracy recognition rate of 94.4%. Whereas GMM classifier has overall accuracy recognition rate is 83.3%. In terms of the computation time, GMM classifier has overall computation time is 1.175 m/s faster compare to MLP classifiers 1.96 m/s. This vision classification could be further expended to more classes of MIG butt-welding joints not even only good weld, excess weld and insufficient weld.
ACKNOWLEDGMENT
The authors also would like to thank Ministry of Education Malaysia (MOE) and Center for Robotics and Industrial Automation, Faculty of Electrical Engineering, Universiti Teknikal Malaysia Melaka (UTeM) for the financial assistance.
REFERENCES
[1] Wang G and Liao T., Automatic identification of different types of welding defects in radiographic images, NDT & E International Journal, Vol. 35, pp. 519-528, (2002).
[2] Da Silva, Romeu R.,Siqueira M. H. S et al, Estimated accuracy of classification of defects detected in welded joints by radiographic tests, NDT & E International Journal, Vol. 38, pp. 335-343, (2004).
[3] Liao TW., Classification of welding flaw types with fuzzy expert systems. Expert Systems with Applications, Expert Systems with Applications, Vol. 25, pp. 101-111, (2003).
[4] Liao TW., Improving the accuracy of computer-aided radiographic weld
inspection by feature selection, NDT & E International Journal, Vol. 42, pp. 229-239, (2009).
[5] Rafael Vilar, Juan Zapta and Ramon Ruiz., An automatic system of classification of weld defects in radiographic images, NDT & E International Journal, Vol. 42, pp. 467-476, (2009).
[6] Senthil Kumar, G., Natarajan, U., Veerarajan, T., and Ananthan, S. S.,
Quality level assessment for imperfections in GMAW, NDT & E International Journal, pp. 85-97, (2009).
[7] Senthil Kumar, G., Natarajan, U., and Ananthan, S. S., Vision inspection system for the identification and classification of defects in MIG welding joints, International Journal of Advanced Manufacturing Technology (IJAMT), Vol. 61, pp. 923-933, (2012).
[8] Juan Zapta, Rafael Vilar and Ramon Ruiz, An adaptive-network-based fuzzy inference system for classification of welding defects, NDT \& E International Journal, Vol. 43, pp. 923-933, (2010).
[9] Da Silva R. R., Siqueira M. H. S et al. , Patterns nonlinear classifiers of weld defects in industrial radiographies, American Conferences for Nondestructive Testing, pp. 1-12, (2003).
[10] Liao, T. W. and Li, Y. M., An automated radiographic NDT system for
weld inspection Part II. Flaw detection, NDT & E International Journal, Vol. 31, No. 3, pp. 183-192, (1998).
[11] Sun, Peng Bai, Hong-yu Sun and Ping Zhou, Real-time automatic
detection of weld defects in steel pipe, NDT \& E International Journal, Vol. 38, pp. 522-528, (2005).
[12] M. Tridi, S. Belaifa and N. Nacereddine, Weld defect classification using EM algorithm for Gaussian mixture model, 3rd International Conferences Sciences of Electronic, Technologies of information and Telecommunications,(2005).
[13] Valavanis and Dimitrios Kosmopoulos, Multiclass defect detection and classification in weld radiographic images using geometric and texture features, Expert System with Applications Journal, pp. 7606-7614, (2010).
[14] A. Eichhorn, D. Girimonte and et al, Surface quality analysis with soft computing, Applied Soft Computing, Vol. 5, No. 3, pp. 303-313, (2005). [15] C. Doring, A. Eichhorn, X. Wang, and R. Kruse, Improving Surface Defect Detection for Quality Assessment of Car Body Panels, Mathware & Soft Computing, Vol. 11, pp. 163-177, (2004).
[16] A. Eichhorn, D. Girimonte, A. Klose and R. Kruse, Soft Computing for
Automated Surface Quality Analysis of Exterior Car Body Panels, Applied Soft Computing, Vol. 5, pp. 302-313, (2005).
[17] P. Kamani, A. Afshar et al., Automatic paint defect detection and classification of car body, 7th Machine Vision and Image Processing (MVIP), pp. 1-6, (2011).
[18] Lim TY, Ratnam MM, Khalid MA, Automatic classification of weld defects using simulated data and an MLP neural network, International Institute of Welding, Vol. 49, No. 3, pp. 154-159, (2007).
[19] Yan Wang, Yi Sun, Peng Lv and Hao Wang, Detection of line weld defects based on and support vector machine multiple thresholds, NDT & E International Journal, Vol. 41, pp. 517-524, (2008).
[20] P. Kamani, A. Afshar et al., Car body paint defect inspection using rotation invariant measure of the local variance and one-against-all support vector machine, 1st International Conferences on Informatics and Computational Intelligence, pp. 244-249, (2011).
[21] L. Jelen,T. Fevens and A. Krzyzak, Classification Of Breast Cancer Malignancy Using Cytological Images Of Fine Needle Aspiration Biopsies, International Journal Applied Mathematics Computer Sciences, pp. 75-83, (2008).
[22] Fei Goa, Zheng Li et al., An Online Inspection System of Surface Defects for Copper Strip Based on Computer Vision, 5th International Congress on image and signal Processing, pp. 1200-1204, (2012)..
[23] HNM Shah, M Sulaiman, AZ Shukor, MZA Rashid . Vision based
Identification and Classification of Weld Defects in Welding Environments: A Review. Indian Journals of Science and Technology. 2016, 9(20), pp. 1-5.
[24] Shah, M. H. N., Sulaiman, M., Shukor, A. Z., Ab Rashid, M.
Environment,” Modern Applied Science, Vol. 10, No 2, pp. 83–89, 2016.
[25] HNM Shah, MZA Rashid, Z Kamis, MN Kamarudin, MF Abdollah, A
Khamis. Implementation of Object Recognition Based on Type of Vehicle Entering Main Gate. Indonesian Journal of Electrical Engineering and Computer Science. 2016, 3(2).
[26] HNM Shah, MZA Rashid, MF Abdollah, MN Kamarudin, Z Kamis, A
Khamis. Detection of Mobile Object in Workspace Area. International Journal of Signal Processing, Image Processing and Pattern Recognition. 2016, 9(4), pp. 225-232.
[27] Shah, M. H. N., Sulaiman, M., Shukor, A. Z., Ab Rashid, M. Z. Vision
Based Identification and Detection of Initial, Mid and End Points of Weld Seams Path in Butt-Welding Joint using Point Detector Methods. Journal of Telecommunication, Electronic and Computer Engineering (JTEC), 2016, 8(7), pp. 57–61.
[28] Sulaiman, M., Shah, M. H. N., Harun, M. H., Lim., W. T., and Kazim,
M. N. F. M. A 3D Gluing Defect Inspection System Using Shape-Based Matching Application from Two Cameras. International Review on Computers and Software (IRECOS ). 2013, 8(8), pp. 1997–2004.
[29] Sulaiman, M., Shah, M. H. N., Harun, M. H., and Kazim, M. N. F. M.
Defect Inspection System For Shape-Based Matching Using Two Cameras. Journal of Theoretical and Applied Information Technology (JATIT). 2014, 61(2), pp. 288–297.
[30] Shah, M. H. N., Sulaiman, M., Shukor, A., Z., Ab Rashid, M., Z. Recognition Of Butt Welding Joints Using Background Subtraction Seam Path Approach For Welding Robot International Journal Of Mechanical & Mechatronic Engineering (IJMME). 2017, 17(1), pp. 57-62.
[31] Shah, M. H. N., Sulaiman, M., Shukor, A., Z. Autonomous detection and