Abstract— Creating of the empirical distribution for several independent random variables with a large number of values require the defining high degree polynomial by generating functions. Observation of mutual influence of random variables is equal to product of the corresponding high degree generative polynomial functions. At the example on prediction of malfunction in vehicles, this paper presents new approach for lowering degree of resulting polynomials, using the concentration of appropriate probability through generati ng functions without loosing of information’s.
Index Term— Polynomial function, concentration of probability, generating polynomial function, malfunction subclass, prediction of malfunction in vehicles
I. INT RODUCT ION
THE FEATURES of any system usually depends on several variables and therefore is defined by one or several functions of one or more variables. These functions, if sufficiently continuous, can in some range and with some accuracy, be approximated by polynomial functions. Mathematical examination of behavior of any system, regardless how complicated it is, start with the study of those functions.
This paper presents development of functions for experimental data for the prediction and planning of vehicle malfunction. Several polynomial functions will be represented such as for data for transmission, for injection, for motor etc.
The notion of concentration at low degrees for a polynomial was introduced by Beauzamy [1]. It represents quantitative results in several branches of mathematics, and g overns seemingly unrelated phenomena, such as the location of the zeroes, and the size of the polynomial in a given interval. Main conclusion is that the obtained estimates are independent of the polynomial degree.
This paper introduces several features of polynomial functions by its application on statistical problem of prediction
S.Lj. Radojević is with the Department of Mathematica and Computer Science, University of Belgrade, Faculty of Mechanical Engineering, Kraljice
Marije 16, 11120 Beograd, Serbia, e-mail: [email protected]. Z.A. Veljković is with the Department of Industrial Engineering, University of Belgrade, Faculty of Mechanical Engineering, Kraljice Marije
16, 11120 Beograd, Serbia, e-mail: [email protected] . D.P. Begović is with the Mercedes-Benz Serbia and Montenegro in
Belgrade, Omladinskih brigada 33, 11070 Belgrade, e-mail: [email protected] .
Manuscript received May 99, 2013; revised May 99, 2013.
of event occurrence in vehicle. Polynomial coefficients are obtained by observing the behavior of vehicle malfunction over a longer period.
II. THEORET ICAL BACKGROUND A. Definitions
Let ( ) be polynomial function with complex coefficients, where degree of polynomial as denoted as . Let ( ], and , than ( ) has concentration d at degree k if [1]:
n
0 j
j k
0 j
j d a
a (1)
In case when degree of the polynomial function is precisely k, then polynomial has concentration at this degree. The coefficient:
n
0 j
j k
0 j
j
f
a a
c
is denoted as a concentration factor of the polynomial ( ) at degree k. With introduction (1), actual degree of polynomial function could be replaced in order to obtain estimates that are independent of the actual degree of the polynomial [1].
Example: The polynomial ( ) has , but concentration 0.5 at degree 0. For some applications, it may be quicker to consider it as a polynomial with concentration 0.5 at degree 0 than as a polynomial of degree 100.
B. Product of polynomial functions
Main conclusion of Beauzamy et.al. [1] is that if polynomials P and Q both have concentration at low degree, their product is bounded from below, with a constant depending only on the concentration data and not on the degree. If:
M
0 m
m m J
0 j
j
jz , Qz a z
a z
P (2)
is written:
J M
0 n
n nz c z Q
P (3)
and satisfy:
Reduction of High Degree Polynomial
Functions Using Generating Functions
M 0 j j k 0 j j J 0 j j k 0 jj d a , b d b
a 2 1 (4) then:
M 0 j j J 0 j j 2 1n d,d;k ,k a b
c (5)
where ( ) depends only on d, d’, k1 , k2 and not on
the precise degrees of ( ) and ( ).
In Number Theory, Waldschmidt [7] presents Gelfond’s Theorem. Following the theorem, if in polynomials ( ) and ( ) are and , then:
Q e P Q
P J M (6)
where | | | |. Using (6) Beauzamy et.al. [1] further develop the results of Gelfond’s Theorem proving that if one of polynomial has a large coefficient and other some concentration at low degrees, their product has large coefficient. It means that if polynomials satisfy (3) and:
J 0 j j jj a d a
max (7) and
M 0 m 2 m k 0 m 2m d b
b (8) then:
M 0 m m J 0 j j jj c d,d;k a b
max (9)
where ( ) depends only on d, d’, k and not on the precise degrees of ( ) and ( ). Fabre [6] presents more precise result, i.e., if:
n 1 n1 n 1
0 az a z z
a z
P (10)
with ∑ | | thus ( ) satisfies (7) with , and:
mm 1 m 1 m
1z b z b z
b 1 z
Q (11)
with ∑ | | thus ( ) satisfies (8) with , , then the best constant in (9) is . Beliakov et.al. [3][4][5]
further studied and developed equations (9), (10) and (11).
C. Probability expressed as generative polynomial function If X is a discrete random variable taking values on some subset of the non-negative integers * + then probabilitycan be defined as generating functions of X such as:
0 X X X XX t Et p t
G (12)
where is probability mass function of X. Approaching a probability as a generating function is useful for dealing with functions of independent random variables. If X1, X2, ..., Xn is
some sequence of independent random variables and:
n 1 i i iX a Y (13)then resulting generating function is:
nn 2 2 1 1 n 1 i i i a X a X a X X a Y Y t G t G t G t E t E t G (14)
Coefficient with is probability of event * +. Calculating is the complex process that could be conducted in several ways.
III. THEORET ICAL BASE FOR RESEARCH
It is possible to select best constant for (9) using quasi probabilities defined by generative polynomial functions. Let is probability mass function of X, where * + and then quasi probability - generating functions of X defined as:
1 n 0 i X X X n 1 i X X X i i i i t p t G or t p t G (15)Equations (15) satisfied (7) and (8) so that equation (9) is also satisfied. It will be shown by example that events * + or * + also can be omitted.
Selection of the best constant for (9) enables decision for critical pair of events. Possible improvements of generative polynomial functions for observed variables are presented on empirical data. That emphases critical pair of events that is most influential on prediction and planning of vehicle service system.
When best constant is obtained, it is possible to formulate decision rule for selection of the critical pair of events in procedure for prediction and planning vehicle service system.
IV. COLLECT ION OF EMPIRICAL DATA FOR MALFUNCTIONS IN VEHICLES
Vehicle maintenance during the warranty period is monitored and documented. From 2003 to 2009, about 16000 vehicles are repaired with 36310 malfunctions and data are entered in database. This database contains more than 70000 records. The whole query in database is stand ardized in order to obtain decision-making process that can be expressed as [8]:
Based on the technical similarities of certain components of older and newer types of vehicles of the same class, it is possible to predict the behavior of malfunctions in tot ally new types of vehicles of the same class that use same components.
Criteria for collection and selection of data that are studied in this paper [3][8] were:
- vehicles were travel related,
- vehicle were purchased in Serbia or Montenegro, - repairs on vehicle where conducted during basic warranty period,
- scale samples for 2003 and 2009 are small and therefore statistically insignificant.
The data are divided by type of malfunction in classes. From available data in this study, two subclasses of malfunctions are selected:
MF1 - due breakdown of turbocharged diesel engines,
from class of malfunction of turbo compressor diesel engines, and
MF2 - due failure of high-pressure injectors, from class of
malfunction of injection system.
Identification and repair of those malfunctions depend to a large degree on engineering expertise. From mathematical and engineering perspective, subclasses MF1 and MF2 are mutually
independent, since they are not connected with the number of cylinders and their arrangement in vehicles. On the other hand there exists possibility of mutual engineering influence. During the period of collected data, number of vehicles with these malfunctions was 1316 in 8340 events. Obtained data are presented at Table I.
T ABLEI
TABLE OF MF1 AND MF2 SUBCLASSES OF
MALFUNCTIONS BY YEARS
Subclass Year Quarter
2004 1 2 3 4
MF1 33 6 13 9 5
MF2 25 1 3 13 8
2005 1 2 3 4
MF1 13 1 2 5 5
MF2 11 2 4 4 1
2006 1 2 3 4
MF1 19 6 8 2 3
MF2 13 1 5 5 2
2007 1 2 3 4
MF1 5 2 0 2 1
MF2 0 0 0 0 0
2008 1 2 3 4
MF1 1 0 0 1 0
MF2 2 1 0 1 0
For both MF1 and MF2 subclasses, distributions of
malfunctions are unknown. Equality of those distributions is conducted by Kolmogorov-Smirnov test, resulting with:
0.69811
0.2722Q (16)
at significance . It follows that there are no reasons to reject hypothesis of equality of distributions of malfunctions between subclasses MF1 and MF2. It should be noted that
critical values are obtained in 2008.
V. DEVELOPMENT OF POLYNOMIAL FUNCT IONS AND INT ERPRET AT ION OF RESULT S
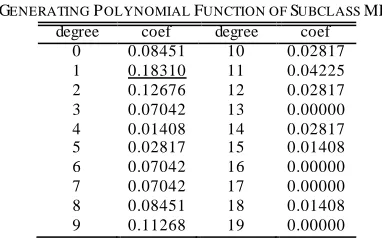
Construction of empirical distribution for malfunction for subclass MF1 results with generating function with 19 degrees
polynomial. Polynomial function coefficients are presented at Table II.
TABLEII
GENERATING POLYNOMIAL FUNCTION OF SUBCLASS MF1 degree coef degree coef
0 0.08451 10 0.02817 1 0.18310 11 0.04225 2 0.12676 12 0.02817 3 0.07042 13 0.00000 4 0.01408 14 0.02817 5 0.02817 15 0.01408 6 0.07042 16 0.00000 7 0.07042 17 0.00000 8 0.08451 18 0.01408 9 0.11268 19 0.00000
Malfunctions of MF2 subclass results also with generating
function with 19 degrees polynomial. Results for generating polynomial function coefficients are shown at Table III.
TABLEIII
GENERATING POLYNOMIAL FUNCTION OF SUBCLASS MF2 degree coef degree coef
0 0.01961 10 0.09804 1 0.05882 11 0.03922 2 0.25490 12 0.00000 3 0.15686 13 0.00000 4 0.03922 14 0.00000 5 0.07843 15 0.00000 6 0.07843 16 0.01961 7 0.01961 17 0.00000 8 0.01961 18 0.01961 9 0.09804 19 0.00000
As it explained above, malfunctions of subclasses MF1 and
MF2 are mathematically mutually independent variables and
they are not occurred in pairs. Therefore it is possible to formulate generating function for random variables MF1 and
MF2 as a:
YMF1MF2
(16)Variable Y corresponds to the mutual influence of a malfunction subclasses on the overall reliability over time for the technical system. Random variable Y is a carrier - subclass percentage share of malfunction that has been formed. In this case, it is suitable to use generative polynomial functions that represent quasi probabilities. Quasi probabilities are introduced since they enable omit of events at the beginning and at the end due their small values, without loosing information’s.
Generating function for Y can be obtained by extracting (13) and (14) and multiplying, i.e.:
t G
t G
t G
tGY MF1 MF2 MF1MF2 (16)
TABLEIV
GENERATING POLYNOMIAL FUNCTION FOR Y=MF1+MF2 degree coef degree coef
0 0.001657 20 0.021541 1 0.008561 21 0.013808 2 0.034797 22 0.007457 3 0.068766 23 0.007180 4 0.068766 24 0.008285 5 0.053024 25 0.006352 6 0.043634 26 0.003038 7 0.043630 27 0.004419 8 0.049434 28 0.002486 9 0.058271 29 0.001381 10 0.075946 30 0.001105 11 0.090307 31 0.000276 12 0.069594 32 0.000552 13 0.048605 33 0.000276 14 0.040597 34 0.000276 15 0.032312 35 0.000000 16 0.035073 36 0.000276 17 0.037835 37 0.000000 18 0.033416 38 0.000000 19 0.027064
Based on data presented at Table IV it is possible to predict of volume of reparation work, defined by variables MF1 and
MF2. Therefore, from Table IV practical conclusion can be
derived that in malfunction for both subclasses can be expected in 3, 4 and 5 quarter of the warranty period. Other critical warranty period is 10 to 12 quarter with high probability of malfunction for both subclass variables [8]. Table IV also indicates that resulting Y is high degree polynomial function, which is increasing during th e time. Goal is to reduce this high degree of polynomial function. This reduction of the polynomial function degree for Y is possible, since generating function for Y meets conditions (7), (8) and (9) i.e.
d 18310 . 0 1 d 18310 . 0 a
max j
j
The polynomial functions defining MF1 and MF2 have the
same concentrations, due equal distributions (16). Therefore resulting with:
004344 . 0 b 359952
. 0 d b
k
0 m
2 m k
0 m
2
m
(18)
From (18) and generating functions for subclass MF1 and MF2
it is possible to generate values for number k.
For example, in Table V for generating function of MF2
subclass maximal value of coefficient is 0.2549 for polynomial function of second degree. Therefore, from Table V, for follows:
004344 .
0 06881 . 0 b 2
0 m
2
m
(19)
TABLEV
GENERATING FUNCTION FOR MF2
degree coef coef2 degree coef coef2 0 0.01961 0.00038 10 0.09804 1 0.05882 0.00346 11 0.03922 2 0.25490 0.06497 12 0.00000
3 0.15686 13 0.00000
4 0.03922 14 0.00000
5 0.07843 15 0.00000
6 0.07843 16 0.01961
7 0.01961 17 0.00000
8 0.01961 18 0.01961
9 0.09804 19 0.00000
According (19) and Table V it can be extracted generative polynomial function for MF2 subclass representing quasi
probabilities (Table VI).
TABLEVI
QUASI GENERATIVE POLYNOMIAL FUNCTION FOR MF2 degree coef
0 0.01961 1 0.05882 2 0.25490
Let GMF2 be generating functions of MF2 representing
quasi probabilities, then:
t G
t G
t G
tGY MF1 MF2 MF1MF2 (20)
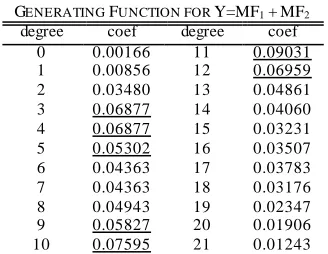
Generative function for variable using quasi probabilities defines polynomial function shown at Table VII. By using quasi probabilities, generative polynomial function is reduced for 17 degrees (Table VII) without losing information.
TABLEVII
GENERATING FUNCTION FOR Y=MF1+MF2 degree coef degree coef
0 0.00166 11 0.09031 1 0.00856 12 0.06959 2 0.03480 13 0.04861 3 0.06877 14 0.04060 4 0.06877 15 0.03231 5 0.05302 16 0.03507 6 0.04363 17 0.03783 7 0.04363 18 0.03176 8 0.04943 19 0.02347 9 0.05827 20 0.01906 10 0.07595 21 0.01243
For given example | ̅ | is:
d,d;k
11 cmax j
j
and if the constant is also chosen so that:
k' d , d max k
; d ,
d
It is possible to calculate low bound of significant coefficient by:
maxd,d'
0.18310 0.033525 09031. 0 c
max j k 2
j
VI. CONCLUSION
of independent random variables that have the same unknown distribution.
Main idea behind this research is analysis of the value of resulting probability represented by generative polynomial coefficients. Those coefficients are obtained by multiplying probabilities represented by generative polynomial functions generative polynomial coefficients that were made by multiplying the generative probability functions of particular random variables.
The problem may arise when the acquired data generate the empirical distribution with great number of values. This result with generative polynomial functions has high degree. Consequence is that resulting generative polynomial function have much higher degree then component generative polynomial functions.
This paper presents one way to lower the level of generative polynomial function by transforming these functions with quasi probabilities. Transformation is conducted in such way that resulting generative function retains all information’s. Transformed generative polynomial function is obtained by using consequence that defines concentration of polynomial functions.
This approach enables to simplify decision making process in prediction and planning of vehicles repairs in warranty period.
REFERENCES
[1] Beauzamy, Bernard - Enflo and Per, “ Estimations de produits de polynmes,” Journal of Num ber Theory, 21 - 3, pp. 390–412, 1985. [2] Beauzamy, Bernard - Bombieri, Enrico - Enflo, Per - Montgomery and Hugh, “ Products of polynomials in many variables,” Journalof Number Theory, 36 - 11, pp. 219–245, 1990.
[3] G. Beliakov, “ How to Build Aggregation Operators from Data,” in
International Journal of Intelligent Systems, Hong Kong, 2003, pp. 903-923.
[4] G. Beliakov, “Fuzzy clustering using global optimization,” in 5th Int Conf Optim ization: Techniques and Applications, Hong Kong, 2001, pp. 72-79.
[5] G. Beliakov, “ Shape preserving approximation using least squares splines,” in Approximation Theory Application, Hong Kong, 2000, pp. 80-98.
[6] C. Fabre, “ Le meilleure constante dans un produit de polynmes,” Note Comptes Rendus, Acad. Sci. Paris, nov. 1988
[7] M. Waldschmidt , “ Nombres Transcendentas,” Springer Verlag, Lecture Notes, 1978
[8] D. Begović, “ Development of the method for engineering and economical analysis of motor vehicles maintenance,” Ph.D. dissertation, Faculty of Mechanical Engineering, University of Belgrade, 2011.
Slobodan Lj. Radojević is associate professor of Mathematics and Computer
Science in Department of Mathematic and Computer Scinece, at Faculty of Mechanical Engineering, University of Belgrade, Serbia. His research interests include software engineering, databases and statistics. Radojević received PhD in Computer Science from Faculty of Mathematics, University of Belgrade, Serbia. Contact him at [email protected].
Zorica A. Ve ljkovi ć is assistant professor of Industrial Statistics and Quantitative Methods in Department of Industrial Engineering, at Faculty of Mechanical Engineering, University of Belgrade, Serbia. Her research interests include design of experiments, T aguchi methods and applied statistics for industry. Veljković received a PhD in Mechanical Engineering from Faculty of Mechanical Engineering, University of Belgrade, Serbia. Contact her at [email protected]
Danijel P. Begović is manager at Mercedes-Benz Serbia and Montenegro.