e-ISSN: 2278-7461, p-ISSN: 2319-6491
Volume 5, Issue 8 (Sep 2016 PP: 48-55)
X-Ray Diffraction
And Mineralogical
Analysis Of Expansive Soils
In Kibaha, Tanzania
Prof. Charles Lucian
Ardhi University (ARU)Box 35176, Dar es SalaamTANZANIA
ABSTRACT:- This paper describes the chemical and mineralogical aspects of the expansive soils in Kibaha,
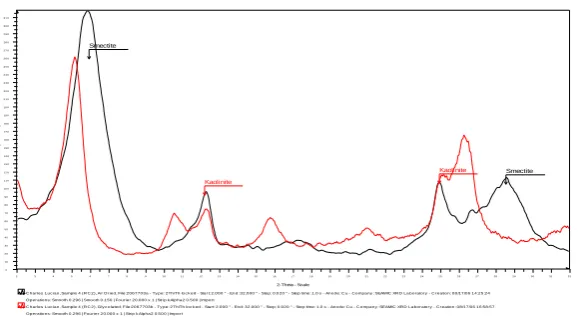
Tanzania. It starts by giving general overview of the structure and composition of the expanding clay minerals together with their chemical properties. The identification of the presence of expanding clay minerals by using different x-ray diffraction is explained. Thereafter, soil samples were analyzed for whole-rock and clay sized fractions using XRD. The whole-rock XRD analysis indicated that the rocks are composed of predominantly quartz, albite and montmorillonite. For mineralogical composition, clay size fractions were prepared by sedimentation techniques. The sample was scanned with a 1-s step time at 0.02 2 increments between 2 and 32, thus well-crystallised clay minerals were verified an all particle-sized fraction by the presence of clear peaks in the diffractograms. To determine the major clay mineral components, the samples were then glycolated with a few drops of ethylene glycol and equilibrated overnight and X-rayed. The proportions of kaolinite and smectite were determined by fitting the XRD patterns of ethylene-glycol-saturated samples where smectite minerals was calculated to be 57-65% with average of 60%) and kaolinite content with average content less than 10%. Each clay-mineral group has its own particular physical properties and characteristics in the system. A high swell potential was indicated by the sharp maximum in percent smectite and a minimum in percent kaolinite. The vast majority of the expandable smectite clay minerals is attributed to the complex sequence of late mesozoic and early cenozoic sediments.
Keywords:- Clay minerals, Kaolinite, Smectite, Illites and X-ray diffraction (XRD)
I.
INTRODUCTION
Expansive soils owe their specific properties to the presence of swelling clay minerals, mainly smectite. The term ‘clay minerals’ refers to hydrous aluminium phyllosilicates minerals that are fine grained (<0.002 mm) with sheet-like structures and very high surface areas (Cameron, 1992, Velde & Druc 1999 and Uddin, 2008). The clay minerals consist of silcon-oxygen tetrahedral ((Si4O16)2-) layer and aluminium (Al2(OH)6) or
magnesium (Mg3(OH)6), the brucite or gibbsite sheet in the octahedral layer (Grim, 1968 and Van Olphen,
1991). The most common clay minerals include kaolinite group minerals (kaolinite, dickite, halloysite and nactrite), chlorite group, illite group (clay-micas), and smectite (pyrophyllite, talc, vermiculite, sauconite, saponite, nontronite and montmorrillonite) and mixed-layer phases (Net et al., 2001, Mukherjee, 2013, Guggenheim et al., 2006 and Jackson & Richardson, 2007).
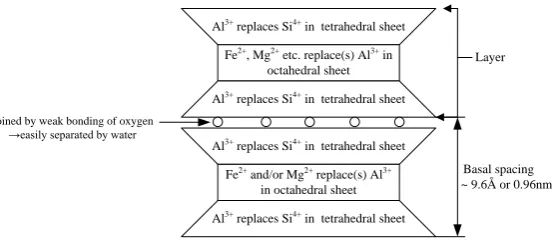
The most common smectite characterized by its expandable properties is montmorillonite (Na,Ca)x(Al,Mg)2(Si4O10)(OH)2·nH2O). The term smectite (generally used to refer montmorillonite) represents a
Al3+ replaces Si4+ in tetrahedral sheet
Fe2+, Mg2+ etc. replace(s) Al3+ in
octahedral sheet
Joined by weak bonding of oxygen →easily separated by water
Layer
Basal spacing ~ 9.6Å or 0.96nm Al3+ replaces Si4+ in tetrahedral sheet
Al3+ replaces Si4+ in tetrahedral sheet
Fe2+ and/or Mg2+ replace(s) Al3+
in octahedral sheet Al3+ replaces Si4+ in tetrahedral sheet
Figure 1: Schematic diagram of smectite (montmorillonite) crystals (Sivakugan, 2001).
Usually, the substitution of Al3+ by Mg2+ in octahedral sheet in montmorillonite creates net negative charges on the clay structure that cause the interlayer space to shrink or expand with change in humidity or moisture content in contact (Tambach et al., 2004 and Burzo, 2007). The three-layer clay mineral as shown in Figure 1 has a structural configuration and chemical makeup, which permits a large amount of water to be adsorbed in the interlayer and peripheral positions on the clay crystalline, resulting in the remarkable swelling of soil (Patrick and Snethen, 1976). As the water molecules are pulled into gaps between the clay plates, the plates are forced further apart, leading to an increase in soil pore pressure and volume. Expanding soils have been a cause for concern in construction because of the damages they cause on structures directly supported on them. Unless identified and rectified before construction, expansive soils may results in significant structural damage over time.
Undeniably, expansive soils comprise expanding clay minerals of varied structural groups and structural varieties coexisting without niche differentiation. Structurally minerals of different composition show characteristic differences in intensities of their X-ray diffraction effects. The presence of various minerals such as montmorillonite in the expansive soils is determined by the use of x-ray diffraction (XRD), cation exchange capacity (CEC), thermal gravimetric analysis (TGA), infrared spectroscopy (IR), specific surface area etc. The basal spacing values (in Angstroms) determined by XRD, specific surface area and cation exchange capacity (CEC) for different clay mineral groups are given in Table 1
Table 1: Some of clay minerals characteristics (Mitchell, 1993). Mineral Interlayer bond Basal
spacing
Specific surface area (m2/gm)
Cation exchange capacity (meq/100 g)
Kaolinate Hydrogen; Strong
7.2Å 10-20 3-15
Montmorillonite Oxygen-oxygen; Very weak
9.6 Å 700-840 80-150
Illite K ions; Strong 10 Å 65-100 10-40
Vermiculite Weak 10.5-14
Å
870 100-150
Chlorite Strong 14 Å 80 10-40
II.
OBJECTIVE
The objective of this study was to identify both chemical and mineralogical quantitative phases of the expansive soil mineral assemblage in Kibaha, Tanzania. The objective had two targets: (i) whole-rock XRD analysis that allows identification of the mineral because each mineral has a set of unique d-spacings and (ii) basic soil description with identification of major clay forming minerals by sedimentation techniques. Quantitative mineralogical analyses are instrumental in the delineation of the geochemical behaviours of expansive soils in the area. Both whole rock and clay fraction X-ray diffraction analysis provide detailed information about the precise mineralogical information of the sample including the semi-quantitative estimates of the major mineral abundances.
III.
MATERIALS AND METHODS
west of Dar es Salaam (the commercial capital city of Tanzania), along the Dar Es Salaam-Morogoro highway (Figure 2). It’s positioned at an altitude of about 155 m above sea level and located approximately by geographic latitude and longitude of 06º46'S and 38º55'E respectively. The region comprises a complex autochthonous and allochthonous sequence of late mesozoic and early cenozoic sediments. The indigenous and non-indigenous sediment fillings are composed of lacustrine, fluviatile, residual, pluvial and alluvial deposits that include micaceous materials (micaceous schists, clay shale, siltstones, silty mudstones etc), calcareous sandstones, limestones, marine marls, shells, organic materials and conglomerates. By the processes of chemical and physical weathering, these conglomerates converted to soils rich in clay. Typically, the deposits are reddish brown, grey brown and grey in colour (Lucian, 2008).
The retrieved samples were wrapped in cellophanes and aluminium foils, logged and transported to the laboratory at African Minerals and Geosciences Centre (AMGC) formerly known as Southern and Eastern African Mineral Centre (SEAMIC). The samples were then ground by hand using a mortar and pestle for whole rock analyses. Clay size fractions were collected from each of the whole rock samples by sedimentation techniques. A portion of each sample was jaw crushed and 25g from each taken. The samples were mixed with the dispersing agent (sodium pyrophosphate) in a 500 ml bottle. 100 ml standard raw water solution was added to the mixture and well shaken. The mixture was sieved through a 63m sieve while pouring the mixture into a 1-litre cylinder and adding distilled water up to the 1000 ml mark. The mixture was left to settle overnight. A long glass tube was taken and a mark put at 20.9 cm. The tube was then immersed in the measuring cylinder until the 20.9 cm mark touched the water level. The sample was drawn through the tube using a teristatic pump. Thereafter, the sample was dried in an oven at 105C. 80 mg of the dry sample was weighed and mixed with 1 ml distilled water in a test tube. The test tube with the sample was placed in an ultrasonic bath and agitated for 1 hr so that the clay can be well dispersed. The resulting slurry was drawn, spread on a clean glass slide and left to dry overnight. The sample was scanned with a 1-s step time at 0.02 2 increments between 2 and 32 by the use of x-ray diffraction (XRD) patterns following the method of Brown and Brindley (1984).
After recording of the air-dried trace the samples were glycolated for 4 hours using the vapor-glycolation technique to determine the presence of expandable clay minerals. The glycol entered the interlayer spaces, expanded them and replaced the water on the intermellar surfaces, thus aiding the XRD in identification of clay minerals.
IV.
RESULTS
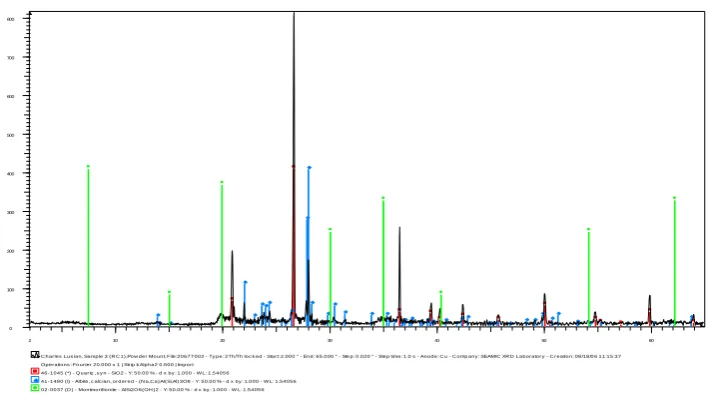
Both whole rock and clay-fraction samples were examined for their major mineral phases by XRD. The whole-rock XRD analysis of the samples indicated that the rocks are composed of predominantly quartz, albite and montmorillonite (Figures 3 to 5). The relative abundance of these three predominant minerals varies slightly from sample to sample. Sample S2 (Figure 3) was taken near the regional office block (Kibaha) at the depth of 1 m. The XRD analysis indicates that the sample has high quartz content because of quartize on which the soil was formed. The patterns show that the only present clay mineral is montmorillonite.The next sample S3 (Figure 4) was taken in the vicinity of the Roman Catholic Church in Kibaha down at the depth of 1 metre from the ground level. The patterns show that the sample has high quartz content, similar to that of S3. However, the clay mineral (montmorillonite) present is much greater.Another sample S4 (Figure 5) was taken once again near the Roman Catholic Church (Kibaha). Like sample S3, the patterns confirm the presence of quartz and considerable amount of montmorillonite. Further, the identification indicates a minor composition of albite, calcian-ordered - (Na,Ca)Al(Si,Al)3O8 in all 3 samples. The presence of albite, calcian-ordered in the sample
swell potential. Furthermore, the analysis showed a stepwise decrease in percentage of smectite and increase in amount of kaolinite with depth.
Figure 2: Location map of Kibaha (Wikipedia, http://en.wikipedia.org/wiki/Kibaha).
Sampl e 2 (S 2)
36- 0426 (*) - D olomite - C aMg(C O3)2 - Y: 50.00 % - d x by : 1.000 - WL: 1.54 056 34- 0517 (D ) - D olomite, ferr oan - Ca (Mg,Fe)(C O3)2 - Y: 50.00 % - d x b y : 1.000 - WL: 1.54056 03- 0009 (D ) - Montmor illonite - Si3.74Al2.0 3Fe0.03Mg 0.20O11 - Y: 50.0 0 % - d x b y : 1.000 - WL: 1.5 4056 41- 1480 (I) - Albite, c alc ian, order ed - (N a,Ca) Al(Si,Al) 3O8 - Y: 50.00 % - d x by : 1.000 - WL: 1.54056 46- 1045 (*) - Quar tz , s y n - SiO2 - Y: 50.00 % - d x by : 1.000 - WL: 1.54056 Operations : Fo urier 20.000 x 1 | Str ip k Alpha2 0.500 | Import
C harles Luc ian, Sample 2 (S2) , Pow der Mount, File:20 677001 - Ty pe: 2 Th/Th loc k ed - Start: 2 .000 ° - End : 65.000 ° - Step: 0.020 ° - Step time: 1.0 s - Anode: C u - C ompany : SEAMIC XRD Labor ator y - Cr eation : 08/18/06 10:15 :52
L
in
(
C
o
u
n
t
s
)
0 10 20 30 40 50 60 70 80 90 10 0 11 0 12 0 13 0 14 0 15 0 16 0 17 0 18 0 19 0 20 0 21 0 22 0 23 0 24 0 25 0 26 0 27 0 28 0 29 0 30 0 31 0 32 0 33 0 34 0 35 0 36 0 37 0 38 0 39 0
2-Theta - Scale
2 10 20 30 40 50 60
S am pl e 3 (RC1) 02- 0037 (D ) - Montmor illonite - AlSi2O6(OH )2 - Y: 50.00 % - d x by : 1.00 0 - W L: 1.54056
41- 1480 (I) - Albite, c alc ian, order ed - (N a,C a) Al(Si,Al) 3O8 - Y: 50.00 % - d x by : 1.000 - W L: 1.54056 46- 1045 (*) - Quar tz , s y n - SiO2 - Y: 50.00 % - d x by : 1.000 - W L: 1.54056
Operations : Fo urier 20.000 x 1 | Str ip k Alpha2 0.500 | Import
C harles Lus ian, Sample 3 (R C 1),Pow der Mount, File:20677 002 - Ty pe: 2Th /Th loc k ed - Start: 2.000 ° - End: 65.000 ° - Ste p: 0.020 ° - Step time: 1.0 s - Anode: C u - C omp any : SEAMIC XR D Laborator y - C r eation: 08/18/0 6 11:15:37 0
100 200 300 400 500 600 700 800
2 10 20 30 40 50 60
Figure 4: XRD pattern for whole-rock sample S3.
S am pl e 4 (RC2)
03- 0014 (D ) - Montmor illonite - MgO·Al2O3·5SiO2·x H 2O - Y: 50.00 % - d x by : 1.0 00 - W L: 1.54056 41- 1480 (I) - Albite, c alc ian, order ed - (N a,C a) Al(Si,Al) 3O8 - Y: 50.00 % - d x by : 1.000 - W L: 1.54056 46- 1045 (*) - Quar tz , s y n - SiO2 - Y: 50.00 % - d x by : 1.000 - W L: 1.54056 Operations : Fo urier 20.000 x 1 | Str ip k Alpha2 0.500 | Import
C harles Luc ian, Sample N o. 4 (R C 2), Pow der Mount, File:206770 03 - Ty pe: 2Th/Th loc k ed - Start: 2.000 ° - End: 65.0 00 ° - Step : 0.020 ° - Step time: 1.0 s - An ode: C u - C omp any : SEAMIC XR D Laborator y - C r eation: 08/18/06 13:01:05 0
100 200 300 400 500 600
2 10 20 30 40 50 60
Figure 5: XRD pattern for whole-rock sample S4.
S am pl e 2 (S 2)
Operations : Smooth 0.296 | Four ier 2 0.000 x 1 | Strip k Alpha2 0.50 0 | Impor t
C harles Luc ian, Sample 2 (S2) , Gly c olated, File:2067701b - Ty pe : 2Th/Th lo c k ed - Star t: 2.000 ° - End: 32 .000 ° - Step: 0.0 20 ° - Step time: 1.0 s - Anode : C u - C ompany : SEAMIC XR D La boratory - C reation: 08 /17/06 16:05:13 Operations : Smooth 0.296 | Four ier 2 0.000 x 1 | Strip k Alpha2 0.50 0 | Impor t
C harles Luc ian, Sample 2 (S2) , Airdr ied, File:2067701 a - Ty pe: 2Th/Th loc k ed - Start: 2.000 ° - End: 32.00 0 ° - Step: 0.020 ° - Ste p time : 1.0 s - Ano de: C u - C o mpan y : SEAMIC XR D Laboratory - C re ation: 08/17 /06 13:10:37
L
in
(
C
o
u
n
ts
)
0 10 20 30 40 50 60 70 80 90 10 0 11 0 12 0 13 0 14 0 15 0 16 0 17 0 18 0 19 0 20 0 21 0 22 0 23 0 24 0 25 0
2-Theta - Scale
2 3 4 5 6 7 8 9 10 11 12 13 14 15 16 17 18 19 20 21 22 23 24 25 26 27 28 29 30 31 32
Smectite
Kaolinite
Kaolinite
Smectite
S am pl e 3 (RC1) Operations : Smooth 0.296 | Four ier 2 0.000 x 1 | Strip k Alpha2 0.50 0 | Impor t
C harles Luc ian, Sample 3 (R C 1) , Gly c ola ted, File:2067702 b - Ty pe: 2Th/Th loc k ed - Start: 2.000 ° - End: 32.00 0 ° - Step: 0.020 ° - Ste p time : 1.0 s - Ano de: C u - C o mpan y : SEAMIC XR D Laboratory - C re ation: 08/17 /06 16:32:48 Operations : Smooth 0.296 | Four ier 2 0.000 x 1 | Strip k Alpha2 0.50 0 | Impor t
C harles Luc ian, Sample 3 (R C 1), Air D ried, File:2067702a - Ty pe : 2Th/Th lo c k ed - Star t: 2.000 ° - End: 32 .000 ° - Step: 0.0 20 ° - Step time: 1.0 s - Anode : C u - C ompany : SEAMIC XR D La boratory - C reation: 08 /17/06 13:38:58
L in ( C o u n ts ) 0 1 0 2 0 3 0 4 0 5 0 6 0 7 0 8 0 9 0 10 0 11 0 12 0 13 0 14 0 15 0 16 0 17 0 18 0 19 0 20 0 21 0 22 0 23 0 24 0 25 0 26 0 27 0
2-Theta - Scale
2 3 4 5 6 7 8 9 1 0 1 1 1 2 1 3 1 4 1 5 1 6 1 7 1 8 1 9 2 0 2 1 2 2 2 3 2 4 2 5 2 6 2 7 2 8 2 9 3 0 3 1 3 2
Smectite
Kaolinite
Kaolinite
Smectite
Figure 7: X-ray diffraction scans of a soil sample S3 for clay content.
S am pl 4 (RC2)
Operations : Smooth 0.296 | Four ier 2 0.000 x 1 | Strip k Alpha2 0.50 0 | Impor t
C harles Luc ian, Sample 4 (R C 2), Gly c olated, File:206 7703b - Ty pe: 2Th/Th loc k ed - Start: 2.000 ° - End: 32.000 ° - Step: 0.020 ° - Step time: 1.0 s - Anode: C u - C ompany : SEAMIC XR D Labor ator y - C r eation: 08/17/06 1 6:58:57 Operations : Smooth 0.296 | Smooth 0 .150 | Fourier 20.000 x 1 | Str ip k Alpha2 0.500 | Import
C harles Luc ian, Sample 4 (R C 2), Air D ried, File:2067703a - Ty pe : 2Th/Th lo c k ed - Star t: 2.000 ° - End: 32 .000 ° - Step: 0.0 20 ° - Step time: 1.0 s - Anode : C u - C ompany : SEAMIC XR D La boratory - C reation: 08 /17/06 14:25:24
L in ( C o u n ts ) 0 10 20 30 40 50 60 70 80 90 10 0 11 0 12 0 13 0 14 0 15 0 16 0 17 0 18 0 19 0 20 0 21 0 22 0 23 0 24 0 25 0 26 0 27 0 28 0 29 0 30 0 31 0
2-Theta - Scale
2 3 4 5 6 7 8 9 10 11 12 13 14 15 16 17 18 19 20 21 22 23 24 25 26 27 28 29 30 31 32
Smectite
Kaolinite
Kaolinite Smectite
Figure 8: X-ray diffraction scans of a soil sample S4 for clay content.
V.
CONCLUSION
X-ray diffraction (XRD) technique is widely used to identify whole rock mineralogy and clay mineralogy through interaction of the x-ray beam with a sample. The method is based on identifying the pattern of basal peaks and their corresponding relative intensity values occurring in the x-ray diffraction pattern (Sachan and Penumadu, 2007 and Flogeac et al., 2005). The quantitative analysis of clay minerals in soils involves working out of peak intensity (area or height) ratios based on standard powder diffraction of the International Powder Diffraction File. In this study, the identification of the specific soil mineralogical composition was obtained by the use of x-ray diffraction (XRD) patterns following the method of Brown and Brindley (1984). X-rays were collimated and directed onto specimen of finely ground powder (normally less than 10 micrometers or microns) and the diffracted rays were collected.
minerals are attributed to the complex sequence of late mesozoic and early cenozoic sediments mixed with fluviatile sediments of the alluvial plain such as micas, calcareous stones, marine marls, shells, mud and organic matter. The presence of expansive materials sends a strong signal for prevention measures to control the swell-shrink behavior of these soils prior to construction.
VI.
ACKNOWLEDGEMENT
The author wishes to recognise the generous financial support for this research from SIDA. I also wish to sincerely thank the laboratory staff at the African Minerals and Geosciences Centre (AMGC) laboratory for diligently carrying out the necessary laboratory tests.
REFERENCES
[1] Barton, C. D. and Karathanasis, A. D. (2002). Clay minerals. In: Lal, R. (Ed.), Encyclopedia of Soil Science. Marcel Dekker, New York, USA, pp. 187–192.
[2] Brown, G. and Brindley, G. W. (1984). X-ray diffraction procedures for clay mineral identification. In G. W. Brindley and G. Brown, Eds., Crystal structures of clay minerals and their x-ray identification, London, Mineralogical Society, Monograph, 5, pp. 305-360.
[3] Burzo, E. (2007). Smectites and related silicates. Phyllosilicates. Vol. 27I5a of the series Landolt-Börnstein. pp 366-537
[4] Cameron, R. E. (1992). Guide to site and soil description for hazardous waste site characterization.
Environmental monitoring systems laboratory- LAS VEGAG,
http://www.hanford.gov/dqo/project/level5/soilmtl.pdf. Date of access: 23rd January 2015.
[5] Diaz, C. I., Laguna, A. H. and Dove, M. T. (2001). Modeling of dioctahedral 2:1 phyllosilicates by means of transferable empirical potentials, Physics and Chemistry of Minerals, vol.28, Issue 2, pp 130-141 [6] Flogeac, K., Guillon, E., Aplincourt, M., Marceau, E., Stievano, L., Beaunier, P. and Frapart, Y. M.
(2005). Characterization of soil particles by X-ray diffraction (XRD), X-ray photoelectron spectroscopy (XPS), electron paramagnetic resonance (EPR) and transmission electron microscopy (TEM). Agronomy for Sustainable Development, vol. 25, pp. 345 – 353.
[7] Grim, R. E. (1948). Some fundamental factors influencing the properties of soil materials. The Proceedings of the International Congress on Soil Mechanics and Foundation Engineering, Rotterdam, vol. 3, pp. 8-12.
[8] Grim, R.E. (1968). Clay Mineralogy, 2nd Edition. McGraw-Hill, New York
[9] Grunwald, S. (2006). Soil and water. University of Florida: Secondary Silicates. http://grunwald.ifas.ufl.edu/Nat_resources/silicates/silicates.htm. Date of access: 24th January 2014. [10] Guggenheim, S., Adams, J. M., Bain, D. C., Bergaya, F., Brigatti, M. F., Drits, V. A., Formoso, M. L. L.,
Galan, E., Kogure, T., Stanjek, H. (2006): Summary of recommendations of nomenclature committees relevant to clay mineralogy: report of the Association Internationale Pour L’etudedes Argiles (AIPEA) nomenclature committee 2006. Clays Clay Miner. Vol. 54, pp. 761–772.
[11] Jackson, D. R. and Richardson, M. D. (2007). High-Frequency Seafloor Acoustics. SpringerVerlag, New York.
[12] Kloprogge, J. T., Komarneni, S. and Amonette, J. E. (1999). Synthesis of Smectite Clay Minerals: A Critical Review. Clays and Clay Minerals, Vol. 47, No. 5, pp. 529-554.
[13] Laird, D.A., P. Barak, E.A. Nater, and R.H. Dowdy. 1991. Chemistry of smectitic and illitic phases in interstratified soil smectite. Soil Science Society of America Journal vol. 55, pp. 1499-1504.
[14] Lucian, C. (2008)4. Geotechnical Aspects of Buildings on Expansive Soils in Kibaha, Tanzania. PhD. Thesis in Soil and Rock Mechanics, Royal Institute of Technology (KTH), Sweden. http://kth.diva-portal.org/smash/record.jsf;jsessionid=5cf2dfee91b3a0141dfb955e8d17?pid=diva2:37732.
[15] Militzer, B., Wenk, H.-R., Stackhouse S. and Stixrude, L. (2011). First-principles Calculation of the Elastic Moduli of Sheet Silicates and their Application to Shale Anisotropy. American Mineralogist, Vol. 96, pp. 125–137
[16] Mitchell, J. K. (1993). Fundamental of soil behaviour. 2nd. Edition. John Wiley and Sons, Inc., New York.
[17] Muhammad, N. (2004). Hydraulic, diffusion, and retention characteristics of inorganic chemicals in bentonite. PhD dissertation, College of engineering, University of South Florida.
[18] Mukherjee, S. (2013): The Science of Clays: Applications in Industry, Engineering, and Environment. Springer, Heidelber
[20] Odom, I. E. (1984). Smectite clay minerals: properties and uses. Journal of Philosophical transactions of the royal society of London, series A: mathematical and physical sciences (Philos. Trans. R. Soc. Lond. Ser. A: Math. Phys. Sci.) vol. 311, No. 1517, pp. 391-409.
[21] Patrick, D. M. and Snethen, D. R. (1976). An occurrence and distribution survey of expansive materials in the United States by physiographic areas. Interim Report, Federal Highway Administration Office of Research and development, Washington, D.C. 20590.
[22] Sachan, A. and Penumadu, D. (2007). Identification of microfabric of kaolinite clay mineral using x-ray diffraction technique. Journal of the Geotechnical and Geological Engineering, vol. 25, No. 6, pp. 603-616.
[23] Sivakugan, N. (2001). Clay Mineralogy. http://www.geoengineer.org/files/ClayMineralogy-Sivakugan.ppt
. Date of access: 21st March 2015.
[24] Tambach, T. J., Hensen, E. J. M. and Smit, B. (2004). Molecular Simulations of Swelling Clay Minerals. The Journal of Physical Chemistry B, Vol. 108, pp. 7586-7596
[25] Uddin, F. (2008). Clays, Nanoclays, and Montmorillonite Minerals. Metallurgical and Materials Transactions, Vol. 39A, pp. 2804 – 2814
[26] Van Olphen, H. (1991). An Introduction to Clay Colloid Chemistry. Reprint edition, Krieger Publishing Company
[27] Velde, B. & Druc, I. C. (1999). Clay Mineral and their Properties, Natural Science in Archeology, pp. 35 – 56