Abstract—The aim of this paper is to investigate and detect the multiple faults in machines using broken rotor bar and eccentricity fault frequencies techniques. It is proposed that using both current and instantaneous power signals simultaneously, will detect the multiple faults reliably, specifically using broken rotor bar fault frequencies and eccentricity fault frequencies under various load conditions. The analyses carried out in this paper show that the current spectra is able to detect multiple faults i.e. a combination of broken rotor bars and eccentricity faults either by using broken rotor bars fault frequency components (1±2s)f1 or using eccentricity fault frequency components (f1±fr) at any levels of loading. The results from the instantaneous power spectra using modified broken rotor bar fault frequency components (fp±4f2) show that it is preferable for estimating either the machines having multiple faults. It can be concluded from the results that flux signal is also not a useful source to detect multiple faults using both broken rotor bar and eccentricity fault frequency components.
Index Term— Broken Rotor Bar, Eccentricity, Electric Machine, Multiple Faults.
I. INTRODUCTION
THE basis of any condition monitoring depends on
understanding the electric, magnetic and mechanical behavior of a machine in both the healthy and faulty state [1]. An induction machine is highly symmetrical and the presence of any kind of fault modifies its symmetry and produces changes in the measured sensor signals, or more precisely, in the magnitude of certain fault frequencies [2].
In induction motor monitoring single sensor is normally used to detect a single fault. Previously, the correlation between different types of sensors and their ability to diagnose multiple faults has not been studied thoroughly enough in the literature. The most prevalent faults in machines are broken rotor bar, stator or armature, misalignment, eccentricity and bearing related faults (bearing fault can also cause rotor eccentricity [3, 4]. Therefore, characterization and accurate prediction of the
1Dr. Intesar Ahmed, 1Engr. Muhammad Shuja Khan and 1Engr. Kashif
Imran are with Department of Electrical Engineering, COMSATS Institute of Information Technology, Lahore PAKISTAN. (Emails:
drintesarahmad@ciitlahore.edu.pk, shuja@ciitlahore.edu.pk, kashifimranciitlahore.edu.pk).
2Engr. Manzar Ahmed is with Department of Electrical Engineering,
University of South Asia, Lahore PAKISTAN.
performance degradation for the induction machine under such conditions is of considerable importance. However, the technology in this field is still in permanent evolution and new techniques appear every year. The purpose of this trend is to be more efficient in fault detection and to provide a reliable method with low-cost sensors and simple numerical algorithms. It is the reason why most international conferences dedicated to electrical machines make room for sessions on monitoring and diagnosis.
Condition monitoring of induction machines relies on being able to detect differences between healthy and faulty machines. An accurate interpretation of a motor’s condition requires knowledge of the effects of different operating conditions (including level of loading, non-ideal supplies), and typical variability between machines and test repeatability.
The localized heating caused by the fault will gradually result in further insulation damage until the motor fails. It is useful to be able to detect such faults at an early stage so that a pre-planned shutdown can be arranged for the motor to be replaced by a healthy motor. Various causes of stator and rotor failures have been presented and discussed in detail. A specific methodology is proposed to facilitate an accurate analysis of these failures [5]. Although, condition monitoring is normally done for induction motors [6], and it can also be carried out for induction generators as-well [7].
A comprehensive literature review of more than 20 existing methods, including the most common methods to assess the phase-to-ground, phase-to-phase, and turn-to-turn insulation conditions are presented in [8 - 11]. The use of fault frequency components in the current, flux and vibration sensor signals to try to both detect and estimate the severity of static eccentricity faults in the presence of load variations and the detection of Eccentricity Fault in machine have been reported in [12, 13]. The purpose of this paper is to investigate fault frequencies in motors with multiple faults to be able to detect and to uncover the most prevalent that may occur in machines. The airgap between the rotor and stator of a healthy motor (2kW) used in this study is 0.4 mm (each side). Therefore, airgap of ±1, ±2 and ±3 mm at the driving and at non-driving-end are considered for the experiment.
The investigation of multiple faults (combination of broken rotor bars and eccentricity faults) at different levels of loading will be involving the following:
Investigation of Multiple Faults Detection in
Electric Machine Using Broken Rotor Bar and
Eccentricity Fault Frequencies Techniques
two broken rotor bars and eccentricity (0.1mm at driving-end)
two broken rotor bars and eccentricity (0.3mm at
driving-end)
Figure 1: Data-acquisition hardware (left) and motor/load test set-up (right) [4]
This paper examines the detection of multiple faults using broken rotor bar fault frequencies and eccentricity fault frequencies. . It can be concluded that from the results, flux signal is not a useful source to detect multiple faults using both broken rotor bar and eccentricity fault frequency components.
II. EXPERIMENTAL SETUP
For the detailed investigation of fault detection in particular type of induction machine we selected a number of 2.2 kW, four-pole machines (highest rating which can be tested using available laboratory facilities). An experimental set-up is developed based on hardware tools and a software program. In the hardware set-up, a precision laser alignment tool and a torque were used to ensure the accuracy and repeatability of the experimental set-up.
For software section two programs has been written. First known as Data acquisition program, which is used for data collection from different multiple types sensors i.e. current, axial flux, voltage and vibration (in earlier work generally used single sensor type e.g. broken rotor bar detection using current sensors) and second known as custom-written program used for the analysis of raw sensor data and produce frequency spectrum of current, flux and instantaneous power spectra that helps us to locate the appropriate peaks in the spectra of different signals simultaneously. These programs are based on the experimental set-up developed for this research in order to provide the necessary technology for accurate and reliable effective fault detection and prediction of incipient failures in induction motors.
The experimental work was conducted using the test rig and data acquisition system as shown in Fig. 1 and the wiring diagram of the AC and DC systems and the position of the
each sensor in the test arrangement are shown in Fig. 2.
Experimental setup with detail specifications of each equipment used have already been explained in [4, 13].
III. DETECTION OF MULTIPLE FAULTS USINGBROKEN ROTOR
BAR FAULT FREQUIENCIES
Combination of broken rotor bars and eccentricity faults may cause severe damage machines. Generally, researchers have examined the detection of faults at full-load level, although in practice the actual load may vary and can be significantly less.
VA VB VC
Induction Motor
5 kW DCgenerator
5kW DEV Vibration
Sensor
Axia
l
F
lux
S
e
ns
or
L
ow
-pa
s
s
f
il
ter
Da
ta
a
c
quis
it
ion
s
ys
tem
Speed Sensor
M
a
ins
s
upply
S
ignal
pr
oc
e
s
s
ing
Current Sensor
Se
Sensor Voltage Sensor
Se
Sensor
PC
DEH Vibration Sensor
Fig. 2. The block diagram of the test set-up including the positions of the sensors [4].
Fig. 3. Flux spectrum of slip frequency versus sidebands amplitudes under different level of load tests.
It is important to detect any multiple faults (combination of broken rotor bars and eccentricity of different levels at non-driving and non-driving-end and non-driving-end) in the machines using characteristic fault frequencies of broken rotor bars and eccentricity at any load test levels.
The fault frequencies are directly related to the supply and slip frequency. Any change in the fault frequencies due to fault in machines will also affect the slip frequency. Frequency spectrum of the flux signal in the slip frequency range is shown in Fig. 3 when the machine with multiple faults operates at different levels of load tests.
A. Using Current Spectra
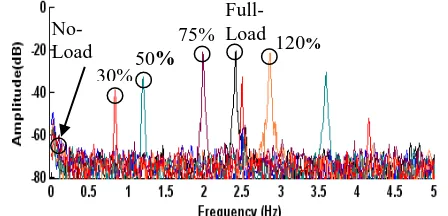
Figure 4 show a comparison of frequency spectra for a healthy machine and one that has multiple faults. At no-load
50%
No-Load
30%
120%
is a significant change of (>20 dB) in the amplitudes of faulty motor to a healthy motor. The noise level is about –90 dB.
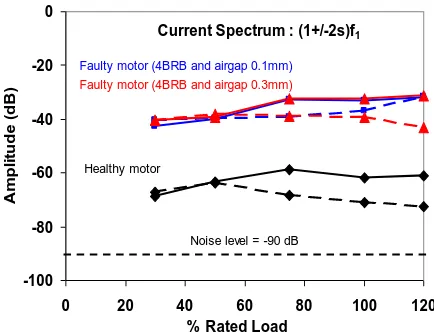
Figure 5 shows the broken rotor bars sideband amplitudes of the healthy motor and faulty motors with multiple faults (two broken bars and eccentricity level of +0.3 mm at driving-end). The result shows that for multiple faults, at any load test levels, variations in the sideband amplitudes between healthy and faulty machines were found to be more than 40 dB, which is significant and can be readily distinguished from healthy motors.
(a) No-Load
(b) 50% Load
(c) Full-Load
Fig. 4. Comparison Current spectrum from a healthy machine (left) and a faulty machine with two broken rotor bars and eccentricity of +0.3mm at driving-end (right), at no-load, 50% load and full-load. The circles indicate
the sidebands.
-100 -80 -60 -40 -20 0
0 20 40 60 80 100 120
% Rated Load
A
m
p
li
tu
d
e
(
d
B
)
Noise level = -90 dB
Current Spectrum : (1+/-2s)f1
Faulty motor (4BRB and airgap 0.1mm)
Faulty motor (4BRB and airgap 0.3mm)
Healthy motor
Fig. 5. Comparison of variation in sidebands amplitudes versus % of rated load of a healthy motor with faulty motors (combination of two broken bars
and eccentricity of +0.1mm and +0.3 mm at driving-end) from current spectrum.
(a) No-Load
(b) 50% Load
(c) Full-Load
Fig. 6. Flux spectrum from a healthy machine (left) and a faulty machine with two broken rotor bars and eccentricity of +0.3mm at driving-end (right), at
-100 -80 -60 -40 -20 0
0 20 40 60 80 100 120
% Rated Load
A
m
p
li
tu
d
e
(
d
B
)
Noise level = -65 dB Flux Spectrum : (1+/-2s)f1
Faulty motor (2BRB and airgap 0.1mm)
Faulty motor (2BRB and airgap 0.3mm)
Healthy motor
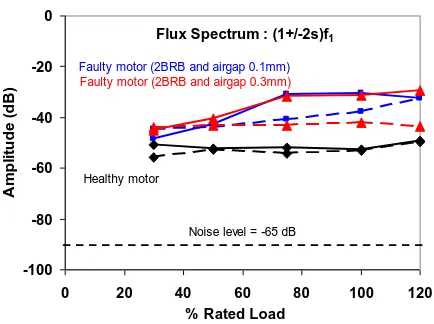
Fig. 7. Comparison of variation in sidebands amplitudes versus % of rated load of a healthy motor with faulty motors (combination of two broken bars and eccentricity of +0.1mm and +0.3 mm at driving-end) from flux spectrum.
B. Using Flux Spectra
Figure 6 shows the amplitude of sideband components for fault frequency from the flux spectra at different levels of load for healthy and machines having multiple faults. The difference in the sideband amplitudes of the faulty motor at less than or about 50% load was found to be (<8 dB) when compared to the healthy motor.
However, at full-load the increase in the amplitudes of sideband components was more (>20 dB) when compared to the healthy motor, which is significant. The noise level is about – 65 dB.
Figure 7 indicates the variations in amplitudes for fault frequencies of a healthy motor and unhealthy motors with multiple faults in the flux spectra, when the machine is operating at different load levels.
Figure 7 show the change in the sideband components is less than 7 dB at 30% load while at 50% load change in the fault frequency components is about 10 dB, which is relatively high. However, significant increase of (> 15 dB) in the amplitudes of sideband components was found at or more than 75% load. These results lead to the conclusion that using the flux signal can detect multiple faults at high loads. However, this variation is less than the variation at the same level of loading in the current spectra.
C. Using Instantaneous Power Spectra
The comparison of characteristic fault frequencies from the instantaneous power spectrum is shown in Figure 8. The differences in the sideband amplitudes between the healthy and faulty motors were found to be more than 20 dB. However, the number of other peaks present at light load is more when compared to the scenario of heavy loads. The noise level is about –80 dB.
Frequency spectrum of the instantaneous power is used to identify broken rotor bar faults in the machine.
The result from the instantaneous power spectra shows significant variations of 30 dB or over in the amplitudes of broken rotor bars fault frequencies for the healthy motor and faulty motors. These variations occur at any load level and make it easier to detect multiple faults.
In summary, instantaneous power signal can detect multiple faults at any load level confirmed its superiority to the flux signal. However, the current signal does have certain usefulness, when compared to the results obtained from the instantaneous power signal for finding any multiple faults in the machines.
IV. DETECTION OF MULTIPLE FAULTS USINGECCENTRICITY
FAULT FREQUIENCIES
Detection of multiple faults i.e. the combination of broken rotor bars and eccentricity at different level of loads using broken rotor bar fault frequencies from the current, flux and instantaneous power spectra has been investigated.
(a) No-Load
(b) 50% Load
(c) Full-Load
-100 -80 -60 -40 -20 0
0 20 40 60 80 100 120
% Rated Load
A
m
p
li
tu
d
e
(
d
B
)
Noise level = -80 dB Instt. Power Spectrum : (fp+/-4f2)
Faulty motor (2BRB and airgap 0.1mm)
Faulty motor (2BRB and airgap 0.3mm)
Healthy motor
Fig. 9. Comparison of variation in sidebands of a healthy motor with faulty motors (combination of two broken bars and eccentricity of +0.1mm and +0.3
mm at driving-end) from instantaneous power spectrum.
The current and instantaneous power signals were found to be better mediums for uncovering multiple faults in machines. We now examine the usefulness of the results of eccentricity characteristic fault frequencies in detecting multiple faults for different levels at different loading conditions.
A. Using Current Spectra
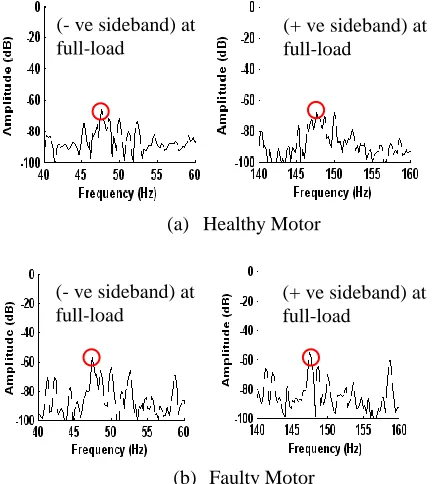
It can be concluded from the Fig.10 and Fig. 11 that variations in the amplitudes of sideband components of a faulty motor at 30% and at full-load are clearly visible in the frequency spectrum. However, variations in the sideband amplitudes of a faulty motor at 30 % load were found to be (> 20 dB) when compared to the faulty motor at full-load. The noise level is about –90 dB.
The variations in the amplitudes of eccentricity sideband components (f1±fr) in the current spectrum as a function of load for healthy motor and faulty motors are clearly shown in the Fig.12.
Variations in the amplitudes of sideband components at any level of loading are clearly visible, when compared to the healthy motor. Differences in the sideband amplitudes of faulty motor were found to be more than 25 dB up to 50% of rated load and about (>10 dB) at or over 75% of rated load.
The current spectrum produced reliable results for detecting the combination of multiple faults (broken bars and eccentricity) using eccentricity fault frequencies at any level of load tests.
The current spectrum produced reliable results for detecting the combination of multiple faults (broken bars and eccentricity) using eccentricity fault frequencies at any level of load tests.
(a) Healthy Motor
(b) Faulty Motor
Fig. 10. Current spectrum from a healthy motor (a) and a faulty motor with eccentricity of +0.3 mm at driving-end (b) at 30% load. The circles indicate
the sidebands.
(a) Healthy Motor
(b) Faulty Motor
Fig. 11. Current spectrum from a healthy motor (top) and a faulty motor with eccentricity of +0.3 mm at driving-end (bottom) at full-load. The circles
indicate the sidebands.
(- ve sideband) at 30% load
(+ ve sideband) at 30% load
(- ve sideband) at 30% load
(+ ve sideband) at 30% load
(- ve sideband) at full-load
(+ ve sideband) at full-load
(- ve sideband) at full-load
-100 -80 -60 -40 -20 0
0 20 40 60 80 100 120
% Rated Load
A
m
p
li
tu
d
e
(
d
B
)
Noise level = -90 dB Current Spectrum : (f1+/-fr)
Faulty motor (2BRB and airgap 0.1mm)
Faulty motor (2BRB and airgap 0.3mm)
Healthy motor
Fig. 12. Comparison of variation in sidebands amplitudes versus % of rated load of a healthy motor with faulty motors (combination of two broken bars
and eccentricity of +0.1mm and +0.3 mm at driving-end) from current spectrum.
A. Using Flux Spectra
It has been observed from the Fig. 13 and Fig. 14, that the variations in the amplitudes of the eccentricity fault frequencies of a faulty motor at 30% load and at full-load are clearly visible than the flux spectrum at the same level of loading.
Even in the presence of other peaks in the frequency spectrum, variations in the amplitudes are clearly visible because of significant variations in the healthy motors as the load on the motor increases. However, a significant decrease in the amplitudes of faulty motor was found when the motor operates at higher loads.
(a) Healthy Motor
(b) Faulty Motor
Fig. 13. Current spectrum from a healthy motor (top) and a faulty motor with eccentricity of +0.3 mm at driving-end (bottom) at 30% load. The circles
indicate the sidebands.
(a) Healthy Motor
(b) Faulty Motor
Fig. 14. Current spectrum from a healthy motor (top) and a faulty motor with eccentricity of +0.3 mm at driving-end (bottom) at Full-load. The circles
indicate the sidebands.
The noise level is about –65 dB. The results in Fig. 15 indicate that variation in the amplitude of negative sideband of the faulty motor was found to be (> 15 dB) at any level of loading condition to the healthy motor, which is significant. The noise level is about –65 dB. The results in Figure 15 indicate that variation in the amplitude of negative sideband of the faulty motor was found to be (> 15 dB) at any level of loading condition to the healthy motor, which is significant. However, variation in the amplitude of the faulty motor of positive sideband component is about (< 4 dB).
-100 -80 -60 -40 -20 0
0 20 40 60 80 100 120
% Rated Load
A
m
p
lit
u
d
e
(
d
B
)
Noise level = -65 dB Flux Spectrum : (f1+/-fr)
Faulty motor (2BRB and airgap 0.1mm)
Faulty motor (2BRB and airgap 0.3mm)
Healthy motor
Fig. 15. Comparison of variation in sidebands amplitudes versus % of rated load of a healthy motor with faulty motors (multiple faults) from flux
spectrum.
Therefore, the results from the flux spectrum show that it is not suitable for detecting the multiple faults using eccentricity fault frequencies sideband components.
B. Using Instantaneous Power Spectra
(- ve sideband) at full-load
(+ ve sideband) at full-load
(- ve sideband) at full-load
(+ ve sideband) at full-load
(- ve sideband) at 30% load
(+ ve sideband) at 30% load (- ve sideband) at
30% load
significant for the healthy motor and are clearly visible in the spectra. The noise level is about –80 dB with eccentricity of +0.3 mm at the driving-end.
The results emerging from the instantaneous power spectra indicate inconsistent increase/decrease in the sideband amplitudes of faulty motors under different load tests. This makes it difficult to detect the multiple faults. Therefore, instantaneous power is not suitable for detecting multiple faults.
(a) Healthy Motor
(b) Faulty Motor
Fig. 16. Instantaneous Power spectrum from a healthy motor (top) and a faulty motor (bottom) at 30% load. The circles indicate the sidebands.
(a) Healthy Motor
(b) Faulty Motor
Fig. 17. Current spectrum from a healthy motor (top) and a faulty motor (bottom) at Full-load. The circles indicate the sidebands.
-100 -80 -60 -40 -20 0
0 20 40 60 80 100 120
% Rated Load
A
m
p
li
tu
d
e
(
d
B
)
Noise level = -80 dB
Instt. Power Spectrum : (fp+/-2fr)
Faulty motor (2BRB and airgap 0.1mm)
Faulty motor (2BRB and airgap 0.3mm)
Healthy motor
Fig. 18. Comparison of variation in sidebands amplitudes of a healthy motor with faulty motors (combination of two broken bars and eccentricity of +0.1mm and +0.3 mm at driving-end) from instantaneous power spectrum.
V. RESULTS AND DISCUSSIONS
A comprehensive investigation to find the multiple faults using broken rotor bar and eccentricity fault frequencies in the presence of characteristic fault frequency components from the current, flux and instantaneous power signal have been demonstrated in detail and the results have been extracted.
A. Findings of Broken Rotor Bar Fault Frequencies
The results from the current spectrum showed capacity to detect multiple faults, which consist of broken bars and airgap eccentricity over a wide range of loading.
In addition, significant variations in the sideband amplitudes (>27 dB) between healthy and faulty machines, at any level of loads were found and readily differentiated from healthy motors in the current spectra.
The flux spectrum showed it is not suitable for finding multiple faults under any level of loading. Instantaneous power also presents equally reliable and preferable results for detecting multiple faults using modified fault frequency
components (fp±4f2) at any levels of load. However, variations
in the sideband amplitudes are relatively high, when compared to the current spectra.
In summary, results for broken rotor bar from the current and instantaneous power spectra were found to be best when detecting detect multiple faults in the machines under the wide range of loading.
B. Findings of Eccentricity Fault Frequencies
The current spectrum showed reliable results for detecting the combination of multiple faults (broken bars and eccentricity) using classical eccentricity fault frequency components (f1±fr) at any levels of load (specifically light loads).
The results for the flux spectrum showed that it is not suitable for finding multiple faults in the machines using eccentricity fault frequency components.
The instantaneous power spectrum also proved not to be suitable for detecting the multiple faults and nor for estimating (- ve sideband) at
full-load
(+ ve sideband) at full-load
(- ve sideband) at full-load
(+ ve sideband) at full-load
(- ve sideband) at 30% load
(+ ve sideband) at 30% load
(- ve sideband) at 30% load
severities of faults. The results obtained from the instantaneous power spectra indicated inconsistent increase/decrease and small variations in the amplitudes of faulty motors under different load tests. This makes it difficult to detect multiple faults accurately under any level of load tests.
VI. CONCLUSION
The results from the current spectrum indicated the ability to detect multiple faults, using broken rotor bar fault frequencies and eccentricity fault frequencies over a wide range of loading. Significant variations in the sideband amplitudes (>20 dB) between healthy and faulty machines have been observed at or above 50% load in the current spectra.
The results from the instantaneous power spectra show significant variations of 30 dB or over in the amplitudes of broken rotor bars fault frequencies for the healthy motor and faulty motors. These variations occur at any load level and make it easier to detect multiple faults.
Moreover, results for the flux signal are not a useful source for discovering multiple faults at high loads. However, variations in the sideband amplitudes occurred less when compared to the current spectra at the same level of loadings.
The above investigation confirmed that the current and instantaneous power spectra are useful signals for detecting multiple faults i.e. combination of broken rotor bars and eccentricity, by using broken rotor bars fault frequencies of
(1±2s)f1 and eccentricity fault frequencies of (fp±2f2) at any
levels of loading. The selected range of sideband amplitudes on the basis of results estimated the severity of multiple faults from the current and instantaneous power spectrums.
ACKNOWLEDGMENT
The authors would like to acknowledge their respective universities for providing adequate resources and environment for research.
REFERENCES
[1] W. R. Finlay, “Troubleshooting motor problems,” IEEE Trans. Ind. Applications., Vol. 30, pp. 1383–1397, Sept./Oct. (1994).
[2] Negrea, M., Jover, P., Arkkio, A., “Electromagnetic Flux-Based Condition Monitoring for Electrical Machines,” 5th IEEE International Symposium on Diagnostics for Electric Machines, Power Electronics and Drives, pp. 1 – 6, September (2005).
[3] W. T. Thomson and M. Fenger, “Current Signature Analysis to Detect Induction Motor Faults”, IEEE Industry Applications Magazine, pp. 26-34, July/August (2001).
[4] I. Ahmed, R. Supangat, J. Grieger, J, N. Ertugrul, and W.L Soong, "A Baseline Study for On-Line Condition Monitoring of Induction Machines." Australian Universities Power Engineering Conference, Brisbane, Australia (2004).
[5] A. H. Bonnett and G. C. Soukup, "Cause and Analysis of stator and Rotor Failures in Three-phase Squirrel-Cage Induction Motors," IEEE Transations on Industry Applications, vol. 28, no 4, pp. 921-931, July/August (1992).
[6] I. Ahmed, N. Ertugrul, and W. L. Soong, "A Study on the Detection of Fault Frequencies for Condition Monitoring of Induction Machines,”
[7] A.J.M. Cardoso, S.M.A. Cruz, D.S.B. Fonseca, “Inter-turn stator winding fault diagnosis in three-phase induction motors, by Park's Vector approach” IEEE International Electric Machines and Drives Conference Record, 1997. Digital Object Identifier: 10.1109/IEMDC.1997.604083, pp MB1/5.1 - MB1/5.3, (1997). [8] H.M. Emara, M.E. Ammar, A. Bahgat, H.T. Dorrah, “Stator fault
estimation in induction motors using particle swarm optimization”
IEEE International Electric Machines and Drives Conference, 2003. Volume: 3, pp 1469 – 1475, (2003).
[9] S. Nandi, “Detection of Stator Faults in Induction Machines Using Residual Saturation Harmonics” IEEE Transactions on Industry Applications, Volume: 42 , Issue: 5 Digital Object Identifier: 10.1109/TIA.2006.880838, pp 1201 – 1208, (2006).
[10] I. Albizu, A. Tapia, J.R. Saenz, A.J. Mazon, I. Zamora, “Stator winding
fault diagnosis in induction generators for renewable generation”, Proceedings of the 12th IEEE Mediterranean Electrotechnical Conference, 2004. , pp 1017 - 1020 Vol.3, (2004).
[11] A. Siddique, G.S. Yadava, B. Singh, “A review of stator fault monitoring techniques of induction motors” IEEE Transactions on Energy Conversion, Volume: 20 , Issue: 1, Digital Object Identifier: 10.1109/TEC.2004.837304, pp 106 – 114, (2005).
[12] S. Grubic, J.M Aller, B. Lu, T.G. Habetler, “A survey of testing and monitoring methods for stator insulation systems in induction machines” International Conference on Condition Monitoring and Diagnosis, 2008. Digital Object Identifier: 10.1109/CMD.2008.4580262, pp 196 – 203, (2008).
[13] Intesar Ahmed, Manzar Ahmed, Kashif Imran, M. Shuja Khan , S. Junaid Akhtar, “Detection of Eccentricity Fault in Electrical Machines Using Current, Flux and Instantaneous Power Signals”, IACSIT,
International Journal of Computer and Electrical Engineering, IJCEE
(Accepted for publication on August 20, 2010, available soon).
Intesar Ahmed received Phd Electrical Power Engineering from University of Adelaide, South Australia and M.Sc. in Electrical Power Engineering from University of New South Wales, Sydney, Australia in 2007 and 1994 respectively.
Dr. Intesar has been involving in various research projects relating to online condition monitoring of electrical machines, power electronics, and study of multiple faults in electric machines via signal processing techniques.
Manzar Ahmed received MS in
Telecommunication from Asian Institute of Technology, Thailand and B.Sc. in Electrical Engineering from University of Engineering & Technology, Lahore Pakistan in 2001 and 1991 respectively.
His current research interests include electric machines and drives, electromagnetic computational and electromechanical actuation as well as techniques for energy savings.
Muhammad Shuja Khan (S’06-07) was born on
Nov 01, 1984. He received MS in Electronic Engineering from Ghulam Ishaq Khan Institute (G.I.K.I.) of Engineering. Science & Technology, Swabi Pakistan and B.Sc. Electrical (POWER) Engineering from University of Engineering & Technology, Lahore Pakistan in June 2009 and July 2007 respectively.
open seminar on “Introduction to MEMS Technology” at COMSATS. His interests include MEMS Design and Multiple faults in Machines.
Engr. Shuja was awarded Higher Education Commission Pakistan Indigenous Fellowship Award for his MS program at G.I.K.I. 2007-09. He was also awarded First International Travel Grant for presenting his first research paper in ICSCT, South Korea in DEC 2009 by HEC Pakistan. He is the member of International Technological Committee of 6th IEEE International Conference of MEMS, NANO and Smart Systems, ICMEMS, December 2010. He has also been serving his duties as member of International Association of Computer Sciences and Information Technology (IACSIT), Singapore.
Kashif Imran completed M.Sc. in Electrical
Engineering and B.Sc. in Electrical (POWER) Engineering from University of Engineering & Technology, Lahore Pakistan in 2008 and 2006 respectively.