Abstract— This paper presents a least cost method of operating a power plant in view of variable spot price of electricity and load demand greater than plant capacity. Manager of an industrial power plant has to operate its generators at appropriate operating levels. Furthermore, manager has to put up a demand bid to a power exchange in order to cover the remaining load demand such that overall cost remains minimal. Fuel consumption data of three generators has been used in this paper to determine generators operating levels and a demand bid over a range of spot prices. Our results demonstrate that electricity trading through a power exchange leads to considerable savings when spot price drops below fixed price.
Index Term— De-centralised Electricity Environment, Demand Bid, Least Cost Operation, Spot Price.
I. INTRODUCTION
IF cheap electricity is available in a de-centralised electricity environment (DEE) then industry may shut down or run its generators at their lower limits and buy bulk of its power from market. With increasing spot price it becomes profitable to meet more and more of load demand by own power generation. If load demand is less than installed capacity then surplus power can be sold in case electricity fetches a high spot price. Industrial setups can maximize their profits by ensuring maximum saving in their electricity utilization. It is possible to meet electricity requirements in a most cost efficient manner by determining own production level and amount of power bought and / or sold in view of variable spot price.
The rest of this paper is organized as follows: In Section II, several topics relevant to DEE are discussed. These include Unit Commitment, Spot Price, Price Forecasting and Plant Information Systems. Mathematical model is outlined in detail in Section III. It includes the function to be minimized as well as constraints and bounds. Solution Methodology is presented in Section IV and it involves determination of generator coefficients and transmission pricing. Section V displays results of simulations carried out. Section VI concludes this paper.
H. T. Hassan is with University of Engineering and Technology, Lahore, Pakistan (e-mail: tehzibulhasan@gmail.com).
K. Imran is with the COMSATS Institute of Information Technology, Lahore, Pakistan (phone: +92-322-4570244; fax: +92-5321045; e-mail:
kashifimran@ciitlahore.edu.pk).
M. F. Aslam is with Superior University, Lahore, Pakistan (e-mail: mfaslam@gmail.com).
I. Ahmad is with the COMSATS Institute of Information Technology, Lahore, Pakistan (e-mail: drintesarahmad@ciitlahore.edu.pk).
II. DE-CENTRALIZEDELECTRICITYENVIRONMENT
A. Unit Commitment
Unit Commitment Problem (UCP) is solved to determine which generating units must be on and which should be off before optimization problem determines the level of generation by each unit. This problem takes a new twist when electricity is traded at power exchange and a possible solution is suggested in [1]. If a generating unit is committed to run in a certain interval of time as a solution of UCP then it can not be shut down. In such a case, the generator must operate at or above its minimum capacity even if its operation is uneconomical. Such decisions are due to a variety of constraints imposed on generators and power system as a whole. There is a minimum spinning reserve that has to be maintained in view of system stability and reliability [2]. Moreover, thermal unit constraints limit minimum up and down times to allow gradual temperature changes in generators [3].
B. Spot Price
Some industrial customers, for example metal industry, can bear with a reduction in their power supply [4]. This may give rise to numerous interruptible contracts individually negotiated with various industrial customers [5]. Power Exchange (PX) develops a demand curve from aggregated demand bids for each hour, on a day-ahead basis, starting with the highest priced bids and ending at the lowest ones. This gives rise to a set of hourly demand curves for next day each resembling a descending staircase - see Fig. 1. Demand curve starts with highest price for un-interruptible power supply. It is followed by different reduced prices for different levels of acceptable interruptions.
Fig. 1. A typical demand curve showing interruptible contracts
Hafiz T. Hassan, Kashif Imran
,
Muhammad F. Aslam and Intesar Ahmad
Meeting Load Demand at Least Cost in
De-centralised Electricity Environment
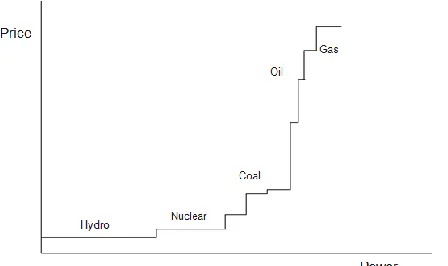
Fig. 2. A supply curve showing change in price due to production method
Similarly a supply curve is established for each hour of the next day by aggregating supply bids in opposite order to the demand bids i.e. starting with the lowest priced bids from plants such as hydro or nuclear and ending at the highest ones from plants operating on gas and oil [6]. It leads to a supply curve, for every hour of the next day, as an ascending staircase pattern - see Fig. 2. Hourly spot price of electricity is determined on a day-ahead basis by intersection of the respective demand and supply curves as shown in Fig. 3. The point of intersection determines the hourly spot price and required power generation.
C.Price Forecasting
Forecasting electricity prices on a day-ahead basis is a crucial activity that enables decision making on part of market participants including managers of industrial power plants. Various price forecasting methods have proved useful including non-linear heuristic, linear regression and data-mining based techniques.
Non linear heuristic methods can be further classified into fuzzy models, artificial neural networks (ANN), chaotic models and evolutionary computation. Heuristic methods have been extensively applied to price forecasting [7]-[10]. Linear regression techniques include auto-regressive moving average (ARMA) and generalized autoregressive conditional heteroskedasticity (GARCH). Regression techniques are used for modelling the changing price and its volatility. [11]-[12]. Data mining techniques have been utilized for price forecasting in recent years [13] and a latest data mining-based
Fig. 3. Determination of Spot Price and required Power Production
approach has been shown to be highly effective when compared
to existing methods [14].
D.Plant Information Systems
Due to the deregulation of the electricity market, power systems have become more dynamic and offer better opportunities for all market participants. Role of plant information systems in DEE has increased manifolds and internet has found a variety of applications in power system monitoring and electricity trading [15]. Intelligent Agents can share information through intranet for economical operation of thermal power plants in a distributed DEE [16-17].
In order to perform as a dominant market participant, it is crucial to have greater understanding regarding the real time plant operation and constantly changing spot price of electricity. Since corporate offices and plants are usually resided at geographically distant locations, it has become very important to access process data for e-monitoring from a central expertise centre [18]. A web-based real time power system dynamic performance monitoring system is highly suitable for today’s increasingly dynamic power systems [19]. More importantly, access to power plant data enables trading activities such as bidding for supply and demand of electricity and hence ensures operational optimisation of an industrial power plant.
III. MATHEMATICALMODEL
A. Minimization Function
A mathematical function incorporating hourly spot price and cost of generation and transmission can be developed for a power plant operating in a DEE [20]. Cost function in (1) must be minimised in order to maximize profits of an industry.
P p Tb b Ts s B b S s
CostC P C P C P C P I P (1)
where
21 1
*
*
n n
P p i Pi pi i i pi i pi i
C
P
C
P
P
P
(2)and
Cp : Hourly cost of total production of the power plant, Pp. Cpi : Hourly cost of production of the i-th generator, Ppi. CTb : Hourly cost of transmission of the power bought, Pb. CTs : Hourly cost of transmission of the power sold, Ps.
CB: Hourly cost of Pb. IS: Hourly income from Ps.
B. Connstraints and Bounds
Operation of industrial power plant is subject to certain non-linear, non-linear, equality and inequality constraints and bounds as outlined below in (3), (4), (5), (6) and (7).
Pp + Pb – Ps = Pd (3)
Pb * Ps = 0 (4)
Ppi ≤ Pmax (5)
Ppi ≥ Pmin (6)
Ppi ≥ 0 (7)
Last two constraints put a limit on minimum level of generator operation. If power plant generators can not be shut down and must operate at or above its minimum capacity then only first of the two equations is considered. However, it is crucial to check both equations one at a time and choose optimum result in case generators can be shut down.
IV. METHODOLOGY
A. Generator Data
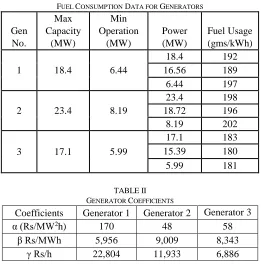
Generator coefficients (α, β and γ) are used to model the hourly cost function of operating a generator in terms of its power production [3]. We took real Heavy Fuel Oil consumption data of three diesel generators in a power plant – see Table I. Cost of Heavy Fuel Oil was taken as 50 Rs./ltr and a density of 930 gms./ltr was assumed [21]. Generator coefficients presented in Table II were calculated and used in our simulation.
TABLE I
FUEL CONSUMPTION DATA FOR GENERATORS Gen
No.
Max Capacity
(MW)
Min Operation
(MW)
Power (MW)
Fuel Usage (gms/kWh)
1 18.4 6.44
18.4 192
16.56 189
6.44 197
2 23.4 8.19
23.4 198
18.72 196
8.19 202
3 17.1 5.99
17.1 183
15.39 180
5.99 181
TABLE II GENERATOR COEFFICIENTS
Coefficients Generator 1 Generator 2 Generator 3
α (Rs/MW2h) 170 48 58
β Rs/MWh 5,956 9,009 8,343
γ Rs/h 22,804 11,933 6,886
TABLE III COST OF TRANSMISSION Cost of Transmission for
Bought Power, CTb
Cost of Transmission for Sold Power, CTs
400 Rs/MW 200 Rs/MW
B. Transmission Pricing
Two philosophies are commonly used for transmission pricing in the de-centralized markets: Point-to-point tariff and the point-of-connection (POC) tariff [22]. The point-to-point tariff is also called transaction based tariff because it is specific to a particular sale of power from a designated seller to a designated buyer. The basic principle of POC tariff is that payment at the point of connection gives access to the whole transmission network, and thus the whole electricity market. POC tariff is universal as it is applicable to both PX trades and bilateral transactions.
One of the desired features of a pricing scheme is that it should provide appropriate price signals [23]. This means that the generators and the loads should pay different rates depending upon the surplus or deficit status of a Distribution Company (DISCO). Locational Transmission Price (LTP) for each node is decided by the results of real power tracing. LTP of a node reflects usage of various transmission lines and elements by load or generator on that node. LTP can be calculated by equations given in [24] and results can directly be used as POC tariffs for all nodes in the system. However, for practical implementation the LTP in a DISCO must be aggregated to get a single price for that DISCO.
In our case, generators are located in the region of Lahore Electricity Supply Company (LESCO) where power is deficit. Hence, POC tariff for generators should be less than that for loads. POC tariff for generators and loads in four western states of India has been determined and it is in the range of few hundred rupees per megawatt of power transmitted. POC tariffs assumed for our simulation are given in Table III [25].
V. RESULTS
The optimization problem has been solved for both cases of load demand being more and less than plant capacity. Both scenarios in which generators can and can not be shut down are simulated in Matlab. Furthermore, results for the scenario of load demand smaller than plant capacity whether generators have to be kept on or can be shut down are presented in [25] for two generators. That work has now been extended to three generators and results are presented here for the case of load demand larger than plant capacity whether generators can be shut down or have to be kept on. A program was developed that used Matlab’s inbuilt fmincon function to find values of power produced and bought for minimal cost. Underlying technique of
There is a great uncertainty in hourly spot prices which are highly volatile and as a result sudden spikes and dips occur in these prices. Historical and real time data of the Australian National Electricity Market (ANEM) is publicly made available by National Electricity Market Management Company (NEMMCO) through its website. It shows that electricity price experiences changes in the approximate range of half to double of the normal price. In our case, normal price is taken as Rs 11,000 per MWh so our range of interest is approximately Rs 5,000 per MWh to Rs 20,000 per MWh [25].
A. Generators can be shut down
Power production graphs of generators vary between upper limit and zero level showing generators shut down status. There is no supply bid in this case because total plant capacity of 58.9 MW is smaller than 80 MW load demand. Below a spot price of Rs 8,100 per MWh it becomes economical to shut down all three generators as shown in Fig. 4. As soon as Rs 8,100 per MWh limit is exceeded, all three generators come on and generation level of generator 1 starts increasing simultaneously. Between the range of Rs 8,100 and Rs 8,600 per MWh generators 2 and 3 are run at their lower limits of operation. At a spot price of Rs 8,600 per MWh generator 3 starts taking increasing load but generator 2 keeps operating at its lower limit. When spot price rises to Rs 9,400 per MWh then generator 2 also starts to take more load than its lower limit – see Fig. 4. Generator 3 reaches its upper limit before the other two generators at a spot price of Rs 10,000 per MWh. Generators 1 and 2 continue to take increasing load between spot price range of Rs 10,000 per MWh and Rs 10,700 per MWh. Then at a spot price of Rs 10,700 per MWh, generators 1 and 2 simultaneously reach their upper limits.
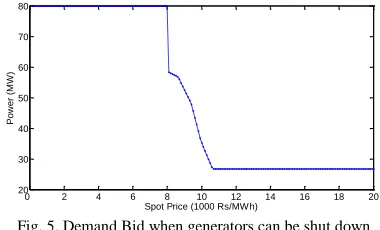
Maximum power demanded from PX is total 80 MW load demand and minimum power demanded is 26.72 MW – see Fig. 5. Between spot price range of Rs 8000 per MWh and Rs 8100 per MWh power demand drops from 80 MW to 58.9 MW as all three generators turn on. Then power demand gradually drops to 26.72 MW as all three generators reach their upper limits as shown in Fig. 5.
0 2 4 6 8 10 12 14 16 18 20
0 5 10 15 20 25
Spot Price (1000 Rs/MWh)
Pow
er
(M
W
) Generator 1
Generator 2 Generator 3
Fig. 4. Power production of generators when these can be shut down
0 2 4 6 8 10 12 14 16 18 20
20 30 40 50 60 70 80
Pow
er
(M
W
)
Spot Price (1000 Rs/MWh)
Fig. 5. Demand Bid when generators can be shut down
Cost of electricity per hour increases as hourly spot price rises. Over a spot price range of Rs 5,000 per MWh to Rs 20,000 per MWh cost changes from Rs. 573,600 to Rs. 1,086,000 – see Fig. 6.
Savings in cost of electricity are calculated with reference to the power purchased at a fixed rate of Rs. 11,000 per MWh in a regulated environment in addition to own power production. However, as spot price keeps on rising power purchase becomes overly expensive. When compared to a fixed cost scenario of regulated environment, there is an additional cost (leading to negative portions in graph of saving). Reference cost of operation is calculated to be Rs 837,587. At a spot price of Rs. 5,000 per MWh there is a considerable saving of as much as nearly Rs. 364,000 per hour.to a negative portion in graph of saving) of about Rs. 246,000 per hour at a spot rate of Rs. 20,000 per MWh – see Fig. 7. It is interesting to compare the results with those in [25] which show that electricity trading in a power exchange always leads to savings if load demand is less than plant capacity because in that case a power plant starts saving as soon as spot price varies from fixed price.
B. Generators have to be kept on
Power production graphs of generators vary between upper and lower permissible limits of generators. There is no supply bid in this case as well because total plant capacity of 58.9 MW is smaller than 80 MW load demand. Below a spot price of Rs 7700 per MWh it only remains economical to run all three generators at their lower limits as shown in Fig. 8. As soon as Rs 7700 per MWh limit is exceeded, generation level of genereator 1 starts increasing. Between the range of Rs 7700 and Rs 8600 per MWh generators 2 and 3 are run at their lower limits of operation. After that power production graph exactly resembles that case in which generators can be shut down– see Fig. 8.
Between spot price range of Rs 7700 per MWh and Rs 8600 per MWh power demand drops from 58.90 MW to 56.87 MW as generator 1 starts taking more load than its lower limit and generators 2 and 3 are run at their lower limits. Then power demand gradually drops to 26.72 MW as all three generators reach their upper limits as shown in Fig. 9.
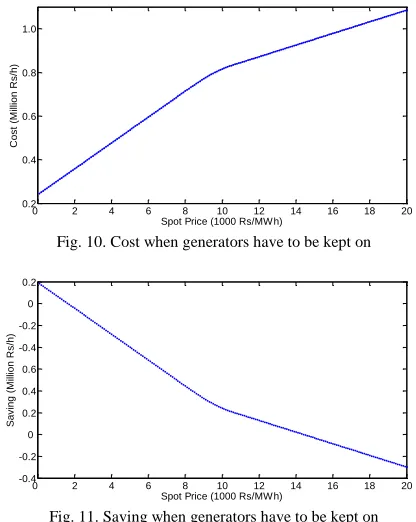
1,086,000 as shown in Fig. 10. It is important to note that at a spot price of Rs 20,000 per MWh cost remains the same whether generators can be shut down or have to be kept on.
At a spot price of Rs. 5,000 per MWh there is a considerable saving of as much as nearly Rs. 300,800 per hour. However, as spot price keeps on rising power purchase becomes overly expensive. When compared to a fixed cost scenario of regulated environment, there is an additional cost (leading to a negative portion in graph of saving) of about Rs. 248,700 per hour at a spot rate of Rs. 20,000 per MWh – see Fig. 11.
0 2 4 6 8 10 12 14 16 18 20
0 0.2 0.4 0.6 0.8 1.0 1.2
Spot Price (1000 Rs/MWh)
C
os
t
(M
illion
R
s
/h)
Fig. 6. Cost when generators can be shut down
0 2 4 6 8 10 12 14 16 18 20
-0.3 -0.1 0.1 0.3 0.5 0.7
Spot Price (1000 Rs/MWh)
Sav
ing
(M
illion
R
s
/h)
Fig. 7. Saving when generators can be shut down
0 2 4 6 8 10 12 14 16 18 20
4 6 8 10 12 14 16 18 20 22
Spot Price (1000 Rs/MWh)
Pow
er
(M
W
)
Generator 1 Generator 2 Generator 3
Fig. 8. Power production of generators when these have to be kept on
0 2 4 6 8 10 12 14 16 18 20
25 30 35 40 45 50 55 60
Pow
er
(M
W
)
Spot Price (1000 Rs/MW h)
Fig. 9. Demand Bid when generators have to be kept on
0 2 4 6 8 10 12 14 16 18 20
0.2 0.4 0.6 0.8 1.0
Spot Price (1000 Rs/MWh)
C
os
t
(M
illion
R
s
/h)
Fig. 10. Cost when generators have to be kept on
0 2 4 6 8 10 12 14 16 18 20
-0.4 -0.2 0 0.2 0.4 0.6 -0.4 -0.2 0 0.2
Spot Price (1000 Rs/MWh)
Sav
ing
(M
illion
R
s
/h)
Fig. 11. Saving when generators have to be kept on
It is possible to save Rs. 67,000 per hour at a spot price of Rs. 5,000 per MWh and saving increases to Rs. 102,000 per hour at a spot rate of Rs. 20,000 per MWh – see Fig. 12.
VI. CONCLUSION
Our results show that profits of industrial plants are maximized by participation in a de-centralised electricity market through a power exchange. At high spot price savings become negative meaning that additional cost is incurred. However, at low spot price savings take place that increase with a fall in spot price because it becomes economical to reduce own production and buy cheaper electricity from power exchange. When spot price drops to Rs 5,000 per MWh and generators have to be kept on then savings of Rs. 300,800 per hour are ensured with reference to a total operational cost of Rs 837,587 that means a saving of 35.91%. Furthermore, if generators can be shut down then at the spot price of Rs 5,000 per MWh savings increase to Rs. 364,000 per hour that corresponds to a saving of as much as 43.46%. Decentralization ensures that not only industry can maximize its profit but surplus power of industrial setups can be fed to national grid thus having potential of alleviating acute power shortage in Pakistan today.
ACKNOWLEDGMENT
Authors would like to acknowledge the support provided by their respective universities to conduct this research work.
REFERENCES
Engineering Society Winter Meeting, 2001 , Vol. 3, pp. 1509 – 1512, 28 Jan.-1 Feb. 2001.
[2] Ponpranod Didsayabutra, Wei-Jen Lee, and Bundhit Eua-Arporn, “Defining the Must-Run and Must-Take Units in a Deregulated Market,”
IEEE Trans. Industry Applications, vol. 38, no. 2, March/April 2002. [3] A.J.Wood, B.F.Wollenberg, “Power Generation, Operation and
Control,” John Wiley & sons, Inc., 1996.
[4] A. Boogert and D. Dupont, “When supply meets demand: the case of hourly spot electricity prices,” IEEE Trans. Power Sys., vol. 23, no. 2, May 2008.
[5] C. Harris, “Electricity Markets: Pricing, Structures and Economics,”
John Wiley & Sons, Ltd., 2006.
[6] R. Weron, “Modelling and forecasting electricity loads and prices,” John Wiley & Sons, Ltd., 2006.
[7] H. Liu, X. Wang, W. Zhang, and G. Xu, "Market clearing price forecasting based on dynamic fuzzy system,” in Proc. IEEE 2002 International Conference on Power System Technology (PowerCon 2002), Vol. 2, pp. 890-896, Oct. 2002.
[8] Li Zhang, P. B. Luh, and K. Kasiviswanathan, "Energy clearing price prediction and confidence interval estimation with cascaded neural networks," IEEE Trans. Power Sys., Vol. 18, No. 1, pp. 99-105, Feb. 2003.
[9] W. Wu, J. Zhou, J. Yu, C.-J. Zhu, J.-J. Yang, “Prediction of spot market prices of electricity using chaotic time series," Proc 2004 International Conference on Machine Learning and Cybernetics, Vol. 2, pp. 888-893, Aug. 2004.
[10] L. Xu, Z. Y. Dong, and A. Tay, , K. C. Tan, M. H. Lim, X. Yao, and L. P. Wang, Eds., “Time series forecast with Elman neural networks and genetic algorithms,” in Recent Advances in Simulated Evolution and Learning. Singapore: World Scientific, Sep. 2004.
[11] A. J. Conejo, M. A. Plazas, R. Espinola and A. B. Molina, “Day-ahead electricity price forecasting using the wavelet transform and ARIMA models," IEEE Trans. Power Syst., Vol. 20, No. 2, pp. 1035-1042, May 2005.
[12] R. C. Garcia, J. Contreras, M. van Akk and J. B. C. Garcia, “A GARCH forecasting model to predict day-ahead electricity prices," IEEE Trans. Power Syst., Vol. 20, No. 2, pp. 867-874, May 2005.
[13] X. Lu, Z. Y. Dong, and X. Li, “Electricity market price spike forecast with data mining techniques,” Electric Power Systems Research, Vol. 73, No. 1, pp. 19-29 January 2005.
[14] J. H. Zhao, Z. Y. Dong, Z. Xu, and K. P. Wong, “A Statistical Approach for Interval Forecasting of the Electricity Price,” IEEE Trans. Power Syst., Vol. 23, No. 2, pp. 267-276, May. 2008.
[15] Loi Lei Lai, “Power system restructuring and deregulation: Trading, performance and information technology,” John Wiley & sons, Inc., 2001.
[16] M. F. Aslam, T. Hassan, D. Lidgate, “An Intranet Based Distributed Economic Dispatch System for Interconnected Thermal Plants,” 40th
International Universities Power Engineering Conference, UPEC-2005.
[17] M. F. Aslam, T. Hassan, T. A. Shami, “ Reengineering of Systems Operation: A solution to the challenges in the Deregulated Market Environment - I” 5th WSEASInternational Conference on Power Systems
and Electromagnetic Compatibility, PSE ’05.
[18] T. Dang, “Integration of Power Plant information system with Business information system in the open electricity market: challenges and solutions,” 5th IEEE International Conference on Industrial Informatics 2007, Vol. 2, pp. 1209 – 1213, 23-27 June 2007
[19] S. H. Haung, W. J. Lee, S. P. Wang, J. H. Chen, C. H. Hsu, “Web-Based Real Time Power System Dynamic Performance Monitoring System,”
Industry Applications Conference, 2005. Fourtieth IAS Annual Meeting. Conference Record of the 2005, Vol. 4, pp. 2651 – 2656, 2-6 Oct. 2005 [20] F. Rossi, A. Russo, “Optimal Management of an Industrial Power Plant in a Deregulated Market,” 39th International Universities Power
Engineering Conference, UPEC-2004, Vol. 3, pp. 1073 – 1077, 6-8 Sept. 2004
[21] [Online] Available: http://www.engineeringtoolbox.com/fuels-densities-specific-volumes-d_166.html
[22] G. Shuttleworth, “Electricity transmission pricing: The European perspective,” National Economic Research Associates, Tech. Rep., July1999.
[23] R. Green, “Electricity transmission pricing: an international comparisons,” Utilities Policy, vol. 6, pp. 177–184, 3 1997.
[24] Anjan Roy, A. R. Abhyankar, P. Pentayya, and S. A. Khaparde, “Electricity Transmission Pricing: Tracing Based Point-of-Connection Tariff for Indian Power System,” IEEE Power Engineering Society, General Meeting 2006, 18-22 June 2006.
[25] T. Hassan, K. Imran, M. F. Aslam, “Operational optimization of an industrial power plant for electricity trading in a power exchange”, IEEE International Conference on Electrical Engineering (ICEE), 9-11 April, 2009.
Kashif Imran received his elementary education from England where he
obtained GCSEs and GCEs. He did B.Sc. and M.Sc. in Electrical Engineering from University of Engineering and Technology (UET), Lahore, Pakistan. His area of specialization during both degrees was electrical power.
He started his career as a Lecturer at UET Lahore. Then he moved to SIEMENS where he worked as Engineer on project coordination of 132kV grid stations. Later he joined NESPAK, leading engineering consultancy firm of Pakistan, as a Design Engineer in Power Distribution Section. In NESPAK, his professional experience includes design of overhead and underground power distribution systems for a variety of buildings and installations. Currently, he is Lecturer at COMSATS Institute of IT, Lahore, Pakistan where he teaches Electric Machines. He is an accomplished researcher with a high Impact Factor research paper titled “Simulation Analysis of Emissions Trading Impact on a Non-Utility Power Plant” that was published in Elsevier International Journal of Energy Policy in 2009. His book titled “Power Exchange as a Deregulated Electricity Market” is in press to be published by Lambert Academic Publishing, Germany. His research interests include Power System Economics, Restructured Power Systems Simulation, Energy Management Systems and Power System Protection.
Mr. Imran is a member of Pakistan Engineering Council.
Hafiz Tehzeebul Hassan did B.Sc. and M.Sc. in Electrical Engineering from
UET, Lahore.
He later joined UET as a faculty member. His professional experience involves supervision of HV equipment tests as In-Charge of HV Lab in UET. He is an Associate Professor and a PhD student at UET Lahore. His research interests include Power System Analysis, Restructured Power Systems and Multi-Agent Systems.
Mr. Hassan is a member of Pakistan Engineering Council.
Muhammad Farooq Aslam obtained PhD in Electrical Engineering from
UET, Lahore.
He has served UET Lahore as a faculty member for over thirty years. He is a Professor and Chairman of the Department of Electrical Engineering at UMT Lahore. His research interests include Deregulated Electricity Markets, Artificial Intelligence and Multi-Agent Systems.
Mr. Aslam is a member of Pakistan Engineering Council.
Intesar Ahmad did B.Sc. and M.Sc. in Electrical Engineering from UET,
Lahore and University of New South Wales, Australia respectively. In 2008, he obtained PhD in Electrical Engineering from University of Adelaide, Australia. He has served as a faculty member in NUST Pakistan. Currently, he is Assistant Professor at COMSATS Institute of IT, Lahore, Pakistan. His research interests include Online Condition Monitoring of Electric Machines and Power Market Reforms.