Volume 11, Issue 10 (October 2015), PP.61-68
Empirical Model for the Validation of Estimated Completion
Time of Construction Projects and Their Value of Variation
1
SAMUEL I. EGWUNATUM,
2NOEL OGBARAN
1Department of Quantity Surveying Delta State Polytechnic, P.M.B. 05, Ozoro,
Delta State, Nigeria. +23408032201297
2Department of Civil Engineering Delta State Polytechnic, P.M.B. 05, Ozoro,
Delta State, Nigeria.
Abstract:-
Variation has a significant effect on the cost and time of delivery of construction projects. It has been ascertained from this study that the nature of variation allows for addition, omission or alteration in design, time and ultimately cost. To account for these effects, some fundamental contractual variables or parameters, like initial contract sum, value of approved variation time, final contract sum, estimated completion time, value of variation as determinants of variation where investigated. An empirical model was generated to show the recurrence relationship between estimated completion time (℘) and values of variation (Λ) vide a field sampling experimentation. Hypothetical findings have been observed on the logical dependence of these parameters to show that there is a significant relationship between these two variables.Keywords:-
Estimated completion time, value of variation, variation order, final contract sum, final completion time.I.
INTRODUCTION
There are many reasons why variations occur. As noted by Mohammad, CheAni, Rakmat and Yusof (2010) they may be due to extra work caused by surface conditions, errors in contract documents, additional quantities of works or materials, reduction of work, or lack of proper communication between the parties. They postulated further, that needs of the owner may impose change to the parameters of the project, and technological developments may alter design and the choice of the engineer. The architect‟s reviews of the design may bring about changes to improve or optimize the design and hence the operation of the project (Ireland, 2007). All these factors and many others necessitate changes that are costly and generally unwelcomed by all parties (Koushki, Al-Rashid and Kartam, 2005). Egwunatum (2001) noted that the nature of construction projects demands extensive planning, and entails evaluating societal compliance and needs, carrying out feasibility and viability appraisal, preparing designs and determining cost of proposed development or infrastructure. Egwunatum (ibid) emphasized that in carrying out these fundamental assessment, one is bound to integrate variation, going by its frequent occurrence in modern contractual arrangement. The reason for this is that few if any contract runs their normal course without need to modify the work shown in the contract documents which is a major feature of variation (Oladapo, 2007; Hassel, Josephson, Langstrom, Sauk-Kopriip and Hughes, 2005). This involves changes to decision and designs, implying order of additions and/or omissions after a contract is let (Ashworth and Hogg 2008). In summary, the prevalence and inevitability of variations raises questions as to the extent to which they reflect legitimate and important changes in the work or reveal inadequacies in decision-making and interactions in the design and construction process.
II.
DEFINITION OF TERMS
According to Mohammad et al (2010), there is no single definition of what constitutes a variation. This is owing to the perspective of the various continental building and construction standard forms of contract and their measurement and evaluation codes (Uff, 2005; Patrick and Toler 2008; Finsen, 2005). This study strongly rely on the Joint Contract Tribunal (JCT) of 1980 as revised in JCT 2005, institute of Civil Engineers (ICE) of 1979 as revised in ICE 2001 and the standard form of building contract in Nigeria (1990) as revised in 2000 to harmonize variation definition as;
1.0 The alteration or modification of the design, quality or quantity works as shown upon the contract drawings and described by or referred to in the contract bills, including but not limited to:
1.1 The addition, omission or substitution of any work.
1.2 The alteration of the kind of standard of any of any of the materials or goods to be used in the works.
2.0 The addition, alteration or omission of any obligations or restrictions imposed by the employer in the contract bill with respect to;
2.1 Access to the site or use of any specific part of the site
2.2 Limitations of working space
2.3 Limitations of working hours
2.4 The execution or completion of the work in any specified order but not including;
3.0 Nomination of a sub-contractor to supply and fix materials or goods or execute works of which the measured quantities have been set out and priced by the contractor in the contract bills for supply and fixing or execution by the contractor.
In summary, Arian (2005) and Arian and Pheng (2005) noted that one distinguishing characteristics of variation is that it an obligation which a quantity surveyor should price before the Engineer/Architect issues the relevant instructions or orders, to effect the variation.
Experiment
In most construction projects it is difficult to reconcile the initial contract sum and final contract sum. This is principally owing to the fact that the contract has been infested by variation. The formative reason for this assertion is that few, if any variation has no effect on the contract sum. Therefore, this study aims at experimenting the effect of variation on the cost of construction project based on statistically tested model from field experimentation of variation dependent parameters. This will be done by regressing the linear and non-linear relationship between Estimated Completion Time (ECT) and Value of Variation (VOV), for projects within the range of N5million ($0.33million) to N1billion ($6.6million) and above.
The hypothesis to be tested in this work is;
Ho: There is no significant relationship between the estimated completion times
(ECT) and the value of variation (VOV) of construction projects.
H1: There is a significant relationship between the estimated completion times
(ECT) and value of variation (VOV).
Apparatus
Personal Interviews
Experts in the field of construction technology and management in the capacity of the Engineer, Quantity surveyor, Architects and project managers were subjected to questions.
These interviews were aimed at evaluating the respondent‟s level of understanding on the subject of variation, so as to confide in their response for the primary data. The second reason for the personal interview was to ensure that the answers they give properly reflect what they had in mind.
Personal Observation
To earn the confidence of the researcher and the reliability of the data collected, personal observations of the files and records were requested from the respondents. Among all the professionals, the Quantity Surveyors were most resourceful in that they permitted access to the records of past completed projects.
Questionnaire
The questions posed in the questionnaire were quite objective and targeted, but in the course of analysis not all the questions was analysed as those like type of organization which have no direct relevance on the result of the study will be eliminated. The questions were twenty five in all to make up the primary data, while appendix – A attached to the questionnaire makes up the secondary data, though both data will form a fair assessment of the study.
III.
ANALYTICAL TECHNIQUES
The analysis of variance was used for the inferential statistics. The Pearson correlation coefficient was used to estimate the correlation matrix presented in this research. The models were analysed by methods of regression using ordinary least square techniques based on two packages from SPSS version 19.0.In the process of the analysis, questions reflecting the problems which this study aimed at solving were built-up and made out in codified spreadsheet. The questionnaire were in two main sections, one inquired into the professional competence and experience of the respondent, while the second part tried to ascertain the professional involvement and various issues raised as causes in the incidence of variation together with their various implications and remedies looking at the contract as a whole. In testing the hypothesis if Fcalculated is greater than
if Fcal is less than Ftab, we will accept the null hypothesis. Hypothesis testing were carried out at 5% significant
level (∝ = 0.05). The Pearson correlation coefficient will be estimated and the correlation range used in the estimate was –1 rxy 1. The analysis of variance (ANOVA) was used for the decision index which will be
presented in tables (Kumar, 2005 and Walliman, 2005). The standardization of the various models generated depends on their various coefficients of the variables. Each coefficient has their central standard error (SE) for
each model. The Durbin-Watson (DW) Test was also employed to check the decision generated by the model from its regression coefficient square. This was done by estimating thus: if R2 > DW then the model in question has spurious regression doubt (Pallant, 2005).
IV.
RESULTS
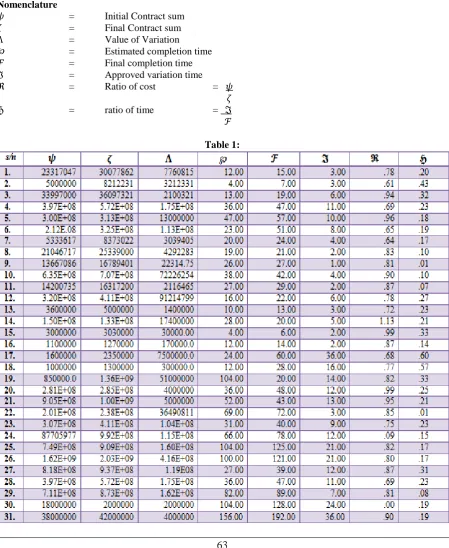
Following the field experimentation the table below presents at a glance the cost information of the projects listed with various variations and the time frame for the variations award.
Nomenclature
𝜓 = Initial Contract sum
𝜁 = Final Contract sum
Λ = Value of Variation
℘ = Estimated completion time
ℱ = Final completion time
ℑ = Approved variation time
ℜ = Ratio of cost = 𝜓
𝜁
ℌ = ratio of time = ℑ
ℱ
Model Specification
A simple regression and correlation, matrix models was formulated for this study. The model is specified below:
℘ = 0 + i (Λ) + t
Where; 0 and i, i = o, 1, are parameters to be estimated.
tis the error term that is identically and independently distributed with mean zero and variance zero.
Data Analysis and Presentation of Findings
This section presents an in-depth appraisal and analysis of the results obtained from the field survey. In the presentation of the field experiment, there are various simplified tables and figures, which were generated from the more elaborate table of figures 2.0. In the course of this data analysis, thirty-one (31) completed projects were unbiasly selected from among the forty-one (41) returned questionnaires were presented for this analysis.
Sampling Method, Procedure and Size
The stratified random sampling technique was adopted in selecting the construction projects for this study. The entire data collected was for completed and abandoned projects with the Niger-Delta region of Nigeria. Two sets of data were collected, which were the primary and secondary data. The primary data source was from the questionnaires, which intend to respond to reliability of the respondent‟s experience, while the secondary data source was from the client‟s and contractor‟s data bank. The sampling covered the years between 2000 and 2014. With a total number of 80 questionnaires distributed. Uwerhiavwe (2007) noted that in stratified sampling, the sizes of sub-sample from each stratum must be proportional to the sizes of the respective strata by
𝑛1
𝑁1 =
𝑛2
𝑁2 = ……… =
𝑛𝑘
𝑁𝑘 = 𝑛
𝑁 so that if a sample of size „n‟ is to be proportionally allocated to the strata of a
population of size N, the sample size for the ith stratum will be giving by ni = n. 𝑛
𝑁. So that if a sample of size „n‟
is to be proportionally allocated to the strata of a population of size N, the sample size for the ith stratum will be
giving by ni = n. 𝑁𝑖
𝑁 . In order to achieve this, list of relevant professionals in public service, multinational
construction companies and private practice in three (3) states of Niger–Delta were obtained from ministerial
gazette and professional bodies. The general sample size was determined from n = 𝑛 1
1+𝑛 1
𝑁
, where n = sample size;
n1 = 𝑆 2
𝑉2 (Aje 2008).
N = Total population, V = standard error of sampling distribution = 0.05 estimated from Vst = ℎ 𝑘 𝑁ℎ2
𝑁2 (1 − 𝑓𝑛)
𝑆ℎ2 𝑛𝑘
P = Proportion of population element that belongs to the defined strata computed from the proportional allocation.
The table below gives the questionnaire response rate at a glance.
Table 2:
Type of organization Total number of sent out Number returned Return rate Remark
Construction company 30 18 60% Good
Private practicing firm
20 8 40% Fair
Public service 30 15 50% Average
Total 80 41
Discussions
Analysis was carried out between the estimated completion time (ECT) and value of value (VOV) based on the data Extrapolated from the secondary data and the information supplied gave the result in the following table.
Table 3:
Variable Mean Standard deviation
℘ 43.16 37.35
Λ 615452.73 896336606.26
From the result above, it shows that average variation value within the limit of contract sum in this research is within the range of sixty to sixty-five million naira (N60,000,000 – N65,000,000 i.e. $39,4736.84 - $427631.58) has an average completion time of forty-three weeks. The total estimated completion time has a standard deviation of 37.35 this goes to show that the mean time for the above variation range is outrageous suggesting that there is no time gain in the variation range. The correlation between the ℘ and Λ is presented in matrix form as:
℘ Λ
℘ 1.000 0.354
Λ 0.354 1.000
Since the matrix is symmetrical about the diagonal, it goes to show that there is a moderate correlation between the two variables. This is interpreted as: if there is increase in contract sum due to variation there is the tendency for the completion time to be increased. From the mean result and standard deviation, it is evident that the value of variation can be used to adjust the estimated completion time. From the correlation result, a model is presented between Λ and ℘ based on the regression that aims to show the relationship between the two variables.
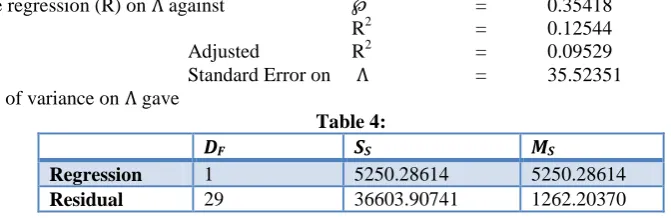
The multiple regression (R) on Λ against ℘ = 0.35418
R2 = 0.12544
Adjusted R2 = 0.09529
Standard Error on Λ = 35.52351
The analysis of variance on Λ gave
Table 4:
DF SS MS
Regression 1 5250.28614 5250.28614
Residual 29 36603.90741 1262.20370
This gives Ftab = 4.15962 and Fsignif = 0.506
The Equation is frustrated by the standard errors associated with the coefficient of each variance, which must be off-set if the model is to be generalized. The standard errors are: 7.7815 for 34.0778 and 7.2366 X 10-3 x 10-7
The generation of coefficient gave:
Table 5:
Variable 0 SE0 1 T Sig T
Λ 1.4759 x 10⁻⁷ 7.2366 x 10⁻⁸ 0.3542 2.040 0.0506
Constant 34.0718 7.7815 4.379 0.0001
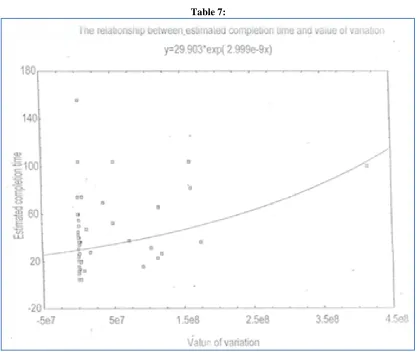
Having generated the coefficient, the mathematical model between ℘ and Λ is given as;
℘= 34.0778 + 0.00000014759 Λ
This equation is consistent for construction projects between the estimated completion time and the value of variation. Since it is a linear relationship when the value of variation is injected into the equation the estimated completion time can be determined. To test the confidence of the Equation, the Durbin-Watson (DW) test is used to determine it.
If adj R2 = 0.09529}
Dw = 0.82448}
Since DW > adj R2 then the equation has a positive auto regression, showing that the equation is consistent. The Durbin-Watson is estimated from the Residual statistics below:
Table 6:
Min Max Mean Std. Dev. N = observation
PRED 34.0811 95.4995 43.1613 13.2291 31
RESID -31.5402 121.3319 0.0000 34.9304 31
ZPRED -0.6864 3.9563 0.0000 1.0000 31
ZRESID -0.8878 3.4152 0.0000 0.9832 31
Total cases = 31
Table 7:
Hypothesis Testing
The hypothesis to be tested has been stated under analytical techniques and the method adopted for this test is the statistical technique of Analysis of Variance (ANOVA).
Ho: There is no significant relationship between the estimated completion time (℘) and value of variation (Λ).
H1: There is a significant relationship between the estimated completion time (℘) and value of variation (Λ).
At 5% significant level ( = 0.05). The ANOVA table is therefore presented in summary as calculated by the researcher based on respondent information from the secondary data.
Summary of Table
Table 8
Groups Count Sum Average Variable
Column 1 31 1338 43.161 1395.140
Column 2 31 1.91 x 10⁹ 6.146 x 10⁷ 8.02 x 10¹⁵
ANOVA Table
Table 9: Source of
variation
SS Df MS F Rvalue Fcrit
Between groups
5.86x10¹⁶ 1 5.86x10¹⁶ 14.606 0.000317 4.0012
Within groups
2.41x10¹⁷ 60 9.01x10¹⁵
From this ANOVA table, the F-calculated is equal to 14.606 which is greater than the F-table. Based on this, the hypothesis is rejected. Because this hypothesis is rejected, we therefore accept the alternative hypothesis (H1), showing that there is a significant relationship between the estimated completion time (℘) and
expressly implied that the alternate hypothesis (H1) is the auto-correlated hypothesis. The Durbin-Watson (DW)
value is therefore tending to zero (o) showing that the spurious doubt level of this alternate hypothesis (H1) is
minimal. Hence, the alternate hypothesis can be stated thus. There is a significant relationship between the estimated completion time (℘) and value of variation (Λ) given by the relationship:
℘ = 34.0778 + 0.00000013759 Λ
The error which makes the null hypothesis not to be accepted has been emphasized by the constant and the coefficient of Λ when the error of the relationship is injected into the equation. From this ANOVA result and going by the alternate hypothesis acceptance, it means that value of variation can be used to predict the estimated completion time (℘) of a construction project.
V.
CONCLUSION
From this study it has been deduced that there is a significant relationship between the estimated completion time (℘) of construction projects and their values of variation (Λ), should variation be ordered in the project. This assertion is statistically compliant which made the linear and exponential relationship valid such that either of the variables can be interchanged to determine the other.
ACKNOWLEDGEMENT
The authors would like to appreciate the invaluable contribution of engineers, architects, quantity surveyors, builders and construction contractors and most importantly field workers at construction sites where experiences were shared and research assistants who part took in the distribution and collection of questionnaires.
REFERENCES
[1]. Arain, F.M. (2005). Strategic Management of Variation Orders for Institutional Building: Leveraging on Information Technology Proceedings, PP 1-17, Toronto Canada. Retrieved August 02, 2007. [2]. Arain, F.M. & Pheng, L.S. (20-05). The Potential effects of Variation Orders on Institutional Building
Project”. Facilities, Vol. 23, no 11/12, pp 496-510
[3]. Ashworth A. and Hogg K. (2008) Willis‟s Practice and Procedure for The Quantity Surveyor, 11th ed. Blackwell Science publishing, Great Britain.
[4]. Assaf S.A., Al-Khalil and Al-Hazmi M. (1995). Causes of delay in large building construction projects. Journal of Management in Engineering ASCE 112:45-50
[5]. Aje, I.O. (2008) The Impact of Contractor‟s prequalification and criteria of Award on construction project performance in Lagos and Abuja. An unpublished Ph.D Thesis, submitted to Department of Quantity Surveying, Federal University of Technology, Akure, Nigeria.
[6]. Egwunatum I.S. (2001) Effect of variation on the cost of Engineering projects. An unpublished B.Tech Dissertation, submitted to Department of Quantity Surveying, Federal University of Technology, Akure, Nigeria.
[7]. Finsen, E. (2005). The Building Contract – A Commentary on the JBCC Agreements. 2nd ed., Kenwyn: Juta & Co. Ltd.
[8]. Hassel, M., Josephson, P.E., Langstoron, A., Sauk Koriipi, L., & Hughes, W. (2005). “Costs for Competitive Tendering in Large Housing Projects”, Submitted to Journal for Review, in Sauk Koriipi, L. (2005 “Non Value-adding activities affecting the Client in Building Projects”. Thesis for the degree of Licentiate of Engineering, Goteborg, Sweden: Chalmers Reproservice.
[9]. Institute of Civil Engineers; 2001, contract conditions 3rd Ed., ICE publishing London.
[10]. Ireland, L. (2007). “Project Complexity: A Brief Exposure to Difficult Situations”. Retrieved on October 17, 2007.
[11]. Joint Contract Tribunal (JCT) 2005, contract conditions 2nd Ed., Granada publishing Ltd. London. [12]. Koushki, P.A., Al-Rashid, K., & Kartam, M. (2005). “Delays and Cost Increases in the Construction of
Private Residential Projects in Kuwait: Construction Management and Economics, Vol. 23, pp 285-294.
[13]. Kumar, R. (2005). “Research Methodology – A Step-by-stem, Guide for Beginners”. 2nd ed., London: Sage Publications
[14]. Mohammad N., CheAni., A.I., Rakmat, R.A. O.K., Yusof, M.A., (2010) Investigation on the Causes of Variation Orders in the Construction of Building Projects – A Study in the State of Selangor, Malaysia, Journal of Building performance Vol. 1(1) Pp 73 – 82
[17]. Patrick, E. & Toler, T.N. (2008). “Contract Negotiations form the owner‟s and the Contractor‟s Perspectives”. Retrieved July 15, 2008.
[18]. Uff, J. (2005). “Commentary on the ICE Conditions of Contract”. In Furst, S. & Ramsey, V. (Eds) 2005, Keating on Building Contracts, 9th ed. London: Sweet & Maxwell