1
International journal of Management, IT and Engineering http://www.ijmra.us, Email: [email protected] RISK MANAGEMENT IN CONSTRUCTION PROJECTSIrfan Ansari1
Pursuing M-tech at Noida International University, Greater Noida, (U.P.)
Rishabh Mahure2
Assistant Professor, Dept. of Civil Engineering, Noida International University, Greater Noida, (U.P.)
Abstract – This thesis describes the development of a framework for a systematic approach to risk management in construction projects, whose application in construction practice would lead to changes and improvements in the construction industry.
Before showing how the framework was developed, there is a survey of what has been written on the subject and a systematic analysis of risk management, risk in construction and process in construction. This led to the conclusion that realizing a construction project is a process and the risk management process should be subordinated to the construction process. A new approach was therefore introduced to managing risk, process driven risk management. This approach will give all the participants in the project better understanding of the construction process, enable changes in the construction industry, and contribute to improvement of quality and efficiency in construction.
Risk has a great impact on the performance of project in India in term of cost, time, and quality. It has increase the size and complexity of the projects and has become the ability to manage risk in all phase of the construction process a central element to prevent unwanted consequences. Key risks are identified in the framework, which are independent of the size, type and purpose of the project being realized. Project related risks should be separately identified for each specific project. Depending on available data, quantitative and qualitative analysis is carried out for the identified risks, their risk probability and risk impact determined, and the corresponding risk exposure calculated. Then the adequate risk response is given for each identified risk, depending on its exposure. As the process unfolds new risks appear in each phase and the management process begins new.
Keyword: Project Risk, Risk Management, Risk Allocation, Construction Project
I. INTRODUCTION
2
International journal of Management, IT and Engineering http://www.ijmra.us, Email: [email protected] overlooked. All the participants in the deciding process should observe risks and their effects on all key points of decision making before and during project realization.Process in construction needs important changes and should be continuously improved. The process itself, and the changes and improvement made to it, are accompanied by risks whose adverse effects may increases planned costs and time necessary for project completion and decrease execution quality. Efficient and quality management of risks should make these changes in the construction industry possible and enhance quality and efficiency. Changes may be brought to the construction industry through improved risk management in several ways. One possibility is to study the causes of risk, their probability and their imp-act on time, cost and quality for a particular type and size of facility.
Risk management is a continuous process needing an integral risk management system in all the phases that the construction project passes through, which is accomplished by developing a framework for process driven risk management. It is necessary to identify the key risks that appear in all the phases through which the construction project passes, regardless of the type and size of the facility
II. OBJECTIVE OF THE STUDY
To investigate how to deal with risks and uncertainties in each phase of the project. To investigate and assess key-risks in each phase of the project.
To suggest risk response for identified key-risks.
To implement and test the proposed framework using a real case which will demonstrate the benefit of the proposed framework.
III. REVIEW OF LITERATURE
There are several examples of research studies involving risk management in construction project in various forms and application which has practically been implemented as well. The projects as such or in parts have been articulated along with their pros and cones by various firms, organizations and authors. Some of such glimpses are highlighted in the following review components.
3
International journal of Management, IT and Engineering http://www.ijmra.us, Email: [email protected] 2. C. Borysowich (2008): Most organizations are aware that risks do not appear on a linear basis and for this reason risk cannot be identified and measured in this way. Assessing and understanding the interrelation of risk and their associated correlated impact is the real challenge. These complex relationships require a different set of tools. Through the use of tools to simulate multiple risk scenarios and correlating risk interdependencies the organization can begin to build an effective map of their risk landscape. The goal of study was to understand the cumulative impact of risks on performance and value in order to select the appropriate mix between risk retention and risk treatments.3. Mehdi Ebrat et.al., (2013): Managers require a good understanding about the nature of risks involved in a construction project because the duration, quality, and budget of projects can be affected by these risks. Thus, the identification of risks and the determination of their priorities in every phase of the construction can assist project managers in planning and taking proper actions against those risks. Therefore, prioritizing risks via the risk factors can increase the reliability of success. In this research, first the risks involved in construction projects has been identified and arranged in a systematic hierarchical structure. Next, based on the obtained data an Adaptive Neuro-Fuzzy Inference System (ANFIS) has been designed for the evaluation of project risks. In addition, a stepwise regression model has also been designed and its results are compared with the results of ANFIS. The results show that the ANFIS models are more satisfactory in the assessment of construction projects risks.
IV. METHODOLOGY
Phase I - Identifying and structuring risk within Process Protocol
Each Process Protocol phase is divided into sub-processes, activities that should be performed during the phase. A systematic analysis of the division helped identify and describe the key risks that appear in all construction projects, regardless of size or type.
Phase II - Developing a framework for managing risk in construction projects
The results of Phase I and Phase II served as a foundation for developing a framework for managing risk in the construction project. The framework provides holistic risk assessment from Demonstrating the Need to Operation and Maintenance.After determining risk probability and risk impact, and thus also risk exposure, for each identified key risk or project related risk, a priority risk list is formed and, depending on risk acceptability, a strategy of risk response. If risk response leads to the appearance of new risks, a new cycle of identification, analysis and risk response begins.
Phase III - Application and Verification of the process-driven risk management framework The last phase shows the application and verification of the proposed process-driven risk management framework using the PP-Risk computer programme developed in the preceding phase.
4
International journal of Management, IT and Engineering http://www.ijmra.us, Email: [email protected] may cause to the project, risk impact. The concept of risk exposure as the product of risk probability and risk impact is introduced to enable the relative comparison of several risks within a project. The values of risk exposure are used to make a risk priority list and define the appropriate response to each risk depending on its exposure and position on the risk priority list. Risk response may produce new events that may adversely affect the project and which it is necessary to identify, analyse and anticipate the appropriate response. This is why the risk management process is by its nature cyclical, and why risk management is part of project management and cannot be viewed as a separate whole.ii) RISKMAN is a risk-driven project methodology. However, even this methodology does not make an allowance for the fact that the construction‘s life cycle is a process and that risk management should be adapted to this process. Therefore, what is necessary is process-driven risk management.
iii) the Process in construction needs significant changes and continuous improvement. These changes and improvements are accompanied by risks that may have a detrimental effect on planned costs, project duration and project quality. Efficient risk management must enable changes in construction and contribute to quality improvement and greater efficiency.
The framework for risk management in construction proposed in this work is based on process-driven risk management, which completely subordinates the risk management process to the construction process.
iv) To increase efficiency in the construction industry it is also necessary to develop and to continuously advance the group of activities needed for successful project realisation. Process Protocol I resulted in 10 phases through which the construction project passes in its evolution. High-level processes that have to be performed are identified in each phase. Process Protocol II proclaimed these high-level processes as Level I, and then proceeded to divide the Level I processes into Level II sub-processes, and these, in turn and if necessary, into Level III sub-processes. Thus the realisation of any construction project is broken up into elementary processes. The processes on any level are potential risk sources and may serve as the basis for a risk list in each phase. The risk list in the proposed framework has a total of 49 risks, that is, an average of 5 risks per phase, to which project related risks can be added in each phase. This makes risk management part of a generic process leading to the development of process-driven risk management.
5
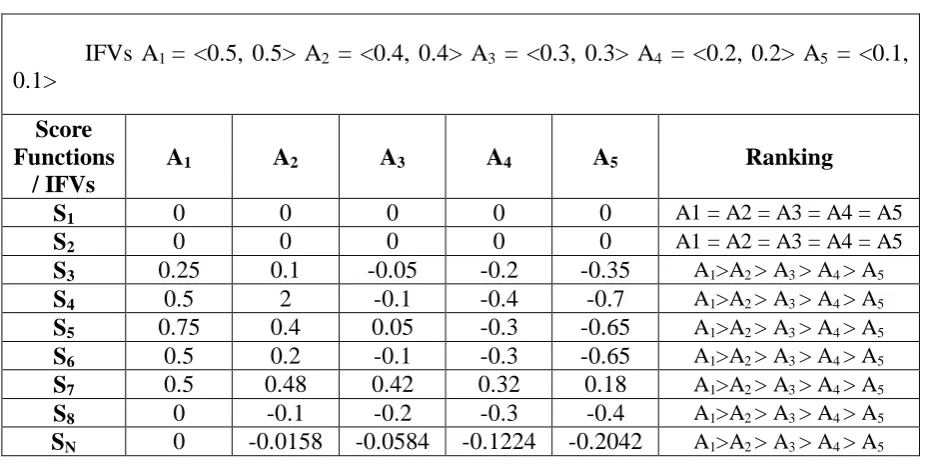
International journal of Management, IT and Engineering http://www.ijmra.us, Email: [email protected] vi)The quantitative approach to forming the risk priority list implies that risk probability and risk impact can be explicitly calculated using one of the known quantitative methods of risk analysis. To do this the relevant database must be available to serve for forming the probability distribution, that is to enable the direct calculation of the impact on time, cost and quality.Table 1: Result of risk analysis for Phase 1
Risk Probability Impact Exposure Acceptability
101 0.245 0.251 0.061 Acceptable
102 0.044 0.068 0.003 Negligible
103 0.043 0.076 0.003 Negligible
104 0.184 0.189 0.035 Acceptable
105 0.485 0.416 0.202 Undesirable
Table 2: Result of risk analysis for Phase 2
Risk Probability Impact Exposure Acceptability
201 0.144 0.126 0.018 Acceptable
202 0.289 0.251 0.073 Acceptable
203 0.213 0.162 0.034 Acceptable
204 0.073 0.120 0.009 Negligible
205 0.092 0.153 0.014 Acceptable
6
International journal of Management, IT and Engineering http://www.ijmra.us, Email: [email protected] Table 3: Results of risk analysis for Phase 3Risk Probability Impact Exposure Acceptability
301 0.204 0.171 0.035 Acceptable
302 0.384 0.406 0.156 Undesirable
303 0.224 0.259 0.058 Acceptable
304 0.069 0.042 0.003 Negligible
305 0.119 0.122 0.015 Acceptable
Table 4: Result of risk analysis for Phase 4
Risk Probability Impact Exposure Acceptability
401 0.141 0.134 0.019 Acceptable
402 0.237 0.172 0.041 Acceptable
403 0.136 0.145 0.020 Acceptable
404 0.412 0.342 0.141 Undesirable
405 0.074 0.207 0.015 Acceptable
VI. SUMMARY AND CONCLUSION
The author developed and verified a framework for risk management in construction projects, the development of the framework was preceded by systematic analysis of prior studies of risk management and construction process, which resulted in several conclusions that were used for developing the framework for risk management in construction:
7
International journal of Management, IT and Engineering http://www.ijmra.us, Email: [email protected] relation to existing ones. This creates the need for continuous risk management in all phases of project realisation.The execution of a construction project is a process. The process in construction contains many special features in comparison with the process of other industries, which are an impediment for changes leading to process improvement. The risk that the project might be unsuccessful is in fact the risk that particular elements in the construction process might be unsuccessful. Risk management should be subordinated to the construction process. This means that the approach to risk management in construction should be changed from risk-driven project management to process-risk-driven risk management. Improving certain elements of risk management lead to better understanding and to changes, in other words, to improvement of the construction process, which is one of the main goals of the construction industry.
The Construction Process Protocol is by nature a generic process and is thus suitable for the construction process within which the framework for process-driven risk management will be situated. As a plan of work, Process Protocol enables managing the project from Demonstrating the Need to Operation and Maintenance regardless of the type, size and purpose of the project that is being realised. According to Process Protocol, every project can be executed through the successful execution of 10 phases grouped in 4 stages. Every phase contains so-called high-level processes as a group of activities that must be realised for the successful conclusion of that phase. High-level processes are broken down into sub-processes in as many levels as the Protocol user deems necessary for the project. The break down of the process in sub-processes provides a good foundation for identifying key risks that are independent of the project being realised. Sub-processes are potential risk sources so risk management in fact means ensuring the success of each sub-process within the entire construction process. Ensuring the successful execution of the construction process leads to process improvement, which gives additional weight to Process Protocol.
VII. REFERENCES
1. Carter, B., Hancock, T., Morin, J.M., and Robins, N., Introducing RI methodology, the Stationery Office, London. (1996).
2. Dave H and David H , Universal Risk Project, Risk Management Institute , UK , (2002).
3. Fouzi, hossen, Analyse and manage the risks faced by construction projects, Faculty of Engineering, University of Omar Mukhtar, Libya, (2012).
4. Gillett, J. E., Hazard Study and Risk Assessment in the Pharmaceutical Industry, Interpharm Press,Inc, USA, (1997).
5. Hossen Fouzi A. Planning Risk Assessment in the Manufacture of Complex Capital Goods, PhD Thesis, Newcastle University, UK, (2006).
6. Hulettvice ,D T , Project Risk Management, Risk Management Institute, U.K, (2001).
8
International journal of Management, IT and Engineering http://www.ijmra.us, Email: [email protected] EMPLOYEES SATISFACTIONAFTER
MERGER AND ACQUISITION OF FINANCIAL INSTITUTIONS IN NEPAL
Dr. Jitendra Prasad Upadhyay
(Associate Professor, Nepal Commerce Campus)
Abstract Background -
Merger and acquisition refer to the aspect of corporate strategy, corporate finance, and management dealing with the buying, selling, and the combination of another company that can help a growing company in a given industry to grow rapidly without having to create another business entity. Merger and acquisition can be threatening for employees and produce anxiety and stress. Patterns of emotional reactions experienced by employees have been identified during merger or acquisition.
Purpose – The purpose of the study is to examine the impact of merger and acquisition on employees‘ satisfaction in Nepal.
Methodology – Due to the specific nature of research objectives, descriptive-cum-analytical research design has been used.
Findings – Employees are satisfied after merger and acquisition of the Financial Institutions of Nepal.
Keywords – Merger and Acquisition, Working Condition, Employees Turnover, Job Stress and Employees Satisfaction
Paper Type – Research paper.
Background of the Study
Mergers and acquisitions practice are increasing in the organizations to enhance their competitive advantages and expand their operations. Mergers and acquisitions are undertaken on the assumption that ‗the combined company will have greater value than the two companies alone‘ (Cartwright & Cooper, 1993). Merger is the operation by which two companies join together to form a single one. This enables the consolidation and increasing competitive capacity of enterprises. Furthermore, (Buono & Bowditch, 1989) explains a merger transaction is where both parties agree to combine their businesses, and for this purpose form a new company that issues shares which replace the shares of both businesses. Companies do pay considerable attention to human resource issues during merger and acquisitions beside financial and strategic issues. It is argued that problems of human resources and organizational culture should, however, be given a high priority, along with strategic issues, to increase the likelihood of a successful combination.
9
International journal of Management, IT and Engineering http://www.ijmra.us, Email: [email protected] The Nepalese financial sector has witnessed a tremendous growth in the number of financial institutions after the 1980‘s by adopting an economic liberalization regulation with a mixed economic model. Today there are 28 commercial banks, 36 development banks, 25 finance companies and 39 insurance companies are there in Nepal (Economic Survey 2018).However, the unnatural increment of the Banking and Financial Institutions has brings several financial challenges and complexities. The financial indicator had indicated that the Nepalese financial sector was weak, vulnerable and at the verge of a collapse.
Merger and acquisition are contemporary in the Banking and Financial Institutions of Nepal and will likely remain so for the next few years since the recent moves of NRB policies seems concerned about the mushrooming financial institutions. Monetary policy 2072/2073 that has increased the paid-up capital of Banking and Financial Institutions- 8 billion for commercial bank, 2.5 billion for development bank, and 800 million for finance companies, is a greater issue in the financial sector of Nepal.
Banking and Financial Institutions employees faced an uncertain future after the merger, as new policies were implemented. This resulted in some employee‘s even resisting change. The management of the BFIs should be focused on human side after merger and acquisitions to minimize the risk of the failure rates of merger and acquisitions.
Objectives of the Study
The main objectives of the study are
a. To examine the impact of merger and acquisition on employee‘s satisfaction. b. To analyze different human resource issues with respect to merger and
acquisition of Banking and Financial Institutions in Nepal.
c. To explore the effects of merger and acquisition to working condition, employees‘ turnover and job stress in Banking and Financial Institutions in Nepal.
Rationale of the Study
Merger and acquisitions are the emerging issue in Nepal. There are many reasons for doing merger and acquisition.
a. This study emphasizes on human resources management through the process of merger and acquisition.
b. In Nepal human resource issue seems to be neglected after merger and acquisition, so this study supports the improvement of results in the future.
c. Other researchers may also be benefited from this study; it may serve as a basis for more research in this area i.e. banking and financial or other sectors that involve in mergers.
d. The result also gives clear ideas to the different organizations about their employees‘ response, to improve their human resource policy and practices for retention of human capital after merger.
Methodology Used
This study follows both the descriptive and analytical research design. In this study, employee satisfaction is considered as the dependent variable and employee turnover, job stress and working environment are the independent variables.
Two commercial banks one from merger group i.e. NMB Bank Limited (merger with Pathibhara Bikas Bank, Bhrikuti Bikas Bank, Clean Energy Development Bank and
10
International journal of Management, IT and Engineering http://www.ijmra.us, Email: [email protected] Premier Finance, Nepal Housing & Merchant Finance and People Finance) have been taken as sample for the study. These organizations were selected on the basis of judgmental and convenient sampling methods.Altogether 35 employees working in different departments in different levels have been selected judgmentally and in a convenient basis as respondents but priority has been given to include respondents from every financial institution involved in merger and acquisition process.
Primary data has been used in this study for finding the relationship between employee satisfaction and merger of the banking and financing sector. 39 structured questionnaires related to different variables were distributed to all the respondents for the study. Questionnaires were then collected by personal visit to the each and every respondent of sample banks. The five-point Likert scale (with 5= strongly agree to 1 strongly disagree) has been used for each of the statement. Cronbach's alpha test has been done for reliability of data.
All collected data has been tabulated and essential statistical values like mean and standard deviation has been calculated to draw the inferences. Correlation and Regression analysis has been used in order to compare and analyze the relationship of the variables.
The data collected from the respondent are presented, analyzed and interpreted for attaining the objectives stated in the study
Table 1 Profile of respondents
Level NMB Bank Limited Citizen Bank Limited
Male Female Total Male Female Total
Upper Level 6 4 10 5 4 9
Middle Level 6 6 12 7 5 12
Lower Level 7 6 13 8 6 14
Total 19 16 35 20 15 35
Source: Field survey 2018
Table 1, shows that number of male respondents is greater than the number of female respondents, i.e. 19 and 20 male respondents in NMB Bank and Citizen Bank respectively. Higher numbers of male respondents have been seen on Lower Level i.e. 7 in NMB Bank & 8 in Citizen Bank. Lower numbers of female respondents i.e. 4 each from both banks have been in found in Higher Level.
Analysis and Findings
Working Environment after merger and acquisition
11
International journal of Management, IT and Engineering http://www.ijmra.us, Email: [email protected]Table 2 a. NMB Bank Limited
Working Environment Gender
Upper Level Middle Level Lower Level Average Mean Value Mean Std. Dev. Mean Std. Dev. Mean Std. Dev.
Supervisor support and interaction with employees
Male 3.20 1.75 3.34 2.70 3.33 2.96 3.29 Female 3.45 1.68 3.40 1.98 3.34 3.96 3.40 Satisfied remuneration and other benefits
Male 3.05 1.25 3.50 2.35 3.56 2.75 3.37 Female 3.12 2.35 3.45 3.01 3.45 2.90 3.34 Enough logistics support for doing work
Male 3.67 0.75 3.55 3.25 3.22 3.21 3.48 Female 3.50 0.96 3.25 2.95 3.42 2.97 3.39
Average Mean Value 3.38
Employee Satisfaction Male 3.32 2.35 3.25 2.89 3.52 2.02 3.36 Female 3.45 3.21 3.12 2.90 3.35 2.05 3.31 Value of Cronbach's Alpha 0.69 Average Mean Value 3.285
Table 3 b. Citizen Bank Limited
Working Environment Gender
Upper Level Middle Level Lower Level Average Mean Value Mean Std. Dev. Mean Std. Dev. Mean Std. Dev.
Supervisor support and interaction with employees
Male 3.27 1.70 3.38 1.75 3.35 2.06 3.45 Female 3.48 1.58 3.45 1.90 3.45 3.01 3.47 Satisfied remuneration and other benefits
Male 3.35 1.35 3.65 2.11 3.65 2.65 3.55 Female 3.32 1.90 3.50 3.35 3.80 2.25 3.54 Enough logistics support for doing work
Male 3.47 2.75 3.35 2.95 3.62 3.20 3.48 Female 3.35 2.85 3.45 2.85 3.47 2.35 3.43
Average Mean Value 3.49
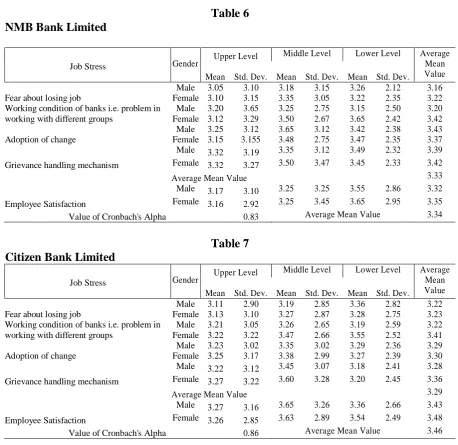
Employee Satisfaction Male 3.34 2.25 3.75 3.36 3.45 2.27 3.51 Female 3.40 2.80 3.50 3.02 3.25 2.25 3.38 Value of Cronbach's Alpha 0.78 Average Mean Value 3.44 Table 2 and Table 3 show that mean value of overall working environment for both banks have been more than 3, i.e. 3.38 for NMB Bank and 3.49 for Citizen Bank. Similarly, mean value of employee satisfaction is also more than 3 in both cases i.e. 3.49 and 3.44 for NMB Bank and Citizen Bank respectively.
Value Cronbach's Alpha has been 0.69 and 0.78 for questionnaires of working environment and employee satisfaction which is sufficient to explain the consistency of the questionnaire.
Supervisory support, satisfactory remuneration and enough logistic support indicates that working environment after merger has been satisfactory to the employee of both banks. Hence it is concluded that all levels employee either male or female of both banks have been satisfied after merger.
Employee Turnover after merger and acquisition
12
International journal of Management, IT and Engineering http://www.ijmra.us, Email: [email protected] Table 4NMB Bank Limited
Employees Turnover Gender
Upper Level Middle Level Lower Level Average Mean Value Mean Std. Dev. Mean Std. Dev. Mean Std. Dev.
Opportunities for career growth in the banks
Male 3.35 1.60 3.18 1.55 3.25 2.12 3.26 Female 3.49 1.52 3.15 1.95 3.35 2.05 3.33 Any humiliation / misbehave from the
co-workers
Male 2.30 1.95 2.15 2.05 2.05 2.95 2.17 Female 2.22 1.99 1.50 2.35 1.95 2.85 1.89 Bank‘s policy for retention of its employee
Male 3.25 2.25 3.25 3.05 3.66 2.27 3.39 Female 3.15 2.35 3.40 2.95 3.78 2.85 3.43
Average Mean Value 2.92
Employee Satisfaction
Male 3.39 2.35 3.35 3.15 3.75 2.97 3.50 Female 3.48 2.85 3.55 2.52 3.55 2.86 3.53 Value of Cronbach's Alpha 0.65 Average Mean Value 3.15
Table 5 Citizen Bank Limited
Employees Turnover Gender
Upper Level Middle Level Lower Level Average Mean Value Mean Std. Dev. Mean Std. Dev. Mean Std. Dev.
Opportunities for career growth in the banks
Male 3.15 2.10 3.28 2.55 3.35 2.22 3.26 Female 3.14 2.12 3.45 2.25 3.25 2.15 3.28 Any humiliation / misbehave from the
co-workers
Male 2.25 2.55 2.25 2.25 2.15 2.57 2.22 Female 2.12 2.19 1.57 2.15 1.85 2.48 1.85 Bank‘s policy for retention of its employee
Male 3.35 2.45 3.26 3.02 3.47 2.32 3.36 Female 3.45 2.55 3.42 2.25 3.27 2.55 3.38
Average Mean Value 2.89
Employee Satisfaction
Male 3.30 2.49 3.37 3.05 3.37 2.37 3.35 Female 3.42 2.39 3.58 2.47 3.35 2.26 3.45 Value of Cronbach's Alpha 0.72 Average Mean Value 3.40 Table 4 and Table 5 shows that mean value of employee turnover for both banks have been near to 3, i.e. 2.92 and 2.89 for NMB Bank and Citizen Bank respectively. Similarly, mean value of employee satisfaction is also more than 3 in both banks i.e. 3.15 and 3.40 for NMB Bank and Citizen Bank respectively.
Value Cronbach's Alpha has been 0.65 and 0.72 for questionnaires of employee turnover and employee satisfaction which is sufficient to explain the consistency of the questionnaire.
Positive response on opportunity for career growth and bank‘s policy of retention of its employee indicates that employee turnover after merger has been low, which is also supported by below average value of humiliation and misbehave from the coworkers after merger. All levels employee either male or female of both banks have been satisfied after merger.
Job Stress after merger and acquisition
13
International journal of Management, IT and Engineering http://www.ijmra.us, Email: [email protected] Table 6NMB Bank Limited
Job Stress Gender
Upper Level Middle Level Lower Level Average Mean Value Mean Std. Dev. Mean Std. Dev. Mean Std. Dev.
Fear about losing job
Male 3.05 3.10 3.18 3.15 3.26 2.12 3.16 Female 3.10 3.15 3.35 3.05 3.22 2.35 3.22 Working condition of banks i.e. problem in
working with different groups
Male 3.20 3.65 3.25 2.75 3.15 2.50 3.20 Female 3.12 3.29 3.50 2.67 3.65 2.42 3.42 Adoption of change
Male 3.25 3.12 3.65 3.12 3.42 2.38 3.43 Female 3.15 3.155 3.48 2.75 3.47 2.35 3.37 Grievance handling mechanism
Male 3.32 3.19 3.35 3.12 3.49 2.32 3.39 Female 3.32 3.27 3.50 3.47 3.45 2.33 3.42
Average Mean Value 3.33
Employee Satisfaction
Male 3.17 3.10 3.25 3.25 3.55 2.86 3.32 Female 3.16 2.92 3.25 3.45 3.65 2.95 3.35 Value of Cronbach's Alpha 0.83 Average Mean Value 3.34
Table 7 Citizen Bank Limited
Job Stress Gender
Upper Level Middle Level Lower Level Average Mean Value Mean Std. Dev. Mean Std. Dev. Mean Std. Dev.
Fear about losing job
Male 3.11 2.90 3.19 2.85 3.36 2.82 3.22 Female 3.13 3.10 3.27 2.87 3.28 2.75 3.23 Working condition of banks i.e. problem in
working with different groups
Male 3.21 3.05 3.26 2.65 3.19 2.59 3.22 Female 3.22 3.22 3.47 2.66 3.55 2.52 3.41 Adoption of change
Male 3.23 3.02 3.35 3.02 3.29 2.36 3.29 Female 3.25 3.17 3.38 2.99 3.27 2.39 3.30 Grievance handling mechanism
Male 3.22 3.12 3.45 3.07 3.18 2.41 3.28 Female 3.27 3.22 3.60 3.28 3.20 2.45 3.36
Average Mean Value 3.29
Employee Satisfaction
Male 3.27 3.16 3.65 3.26 3.36 2.66 3.43 Female 3.26 2.85 3.63 2.89 3.54 2.49 3.48 Value of Cronbach's Alpha 0.86 Average Mean Value 3.46 Table 6 and Table 7 show that all employees either male or female of all levels have not felt job stress since the value of all have been more than 3. Value of working with other employees, fear of losing job, adoption of change and grievance handling mechanism have been more than 3 clearly support that employees of both banks have not feel any kind of job stress after merger and acquisition. Value of employees‘ satisfaction due to job stress after merger has been more than 3, i.e. 3.46 also indicates the satisfaction level of employees. Value Cronbach's Alpha has been 0.83 and 0.86 which is sufficient to explain the consistency in the responses of for questionnaires of job stress and employee satisfaction.
Relationship between Employee Satisfaction with Working Environment, Employee Turnover and Job Stress
14
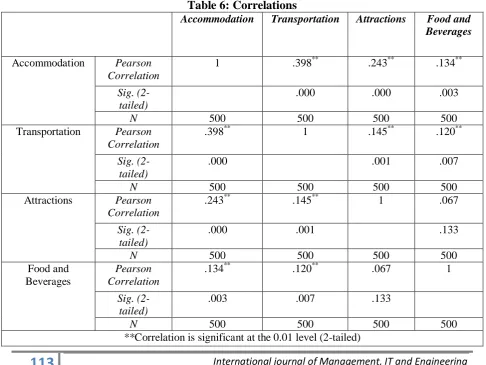
International journal of Management, IT and Engineering http://www.ijmra.us, Email: [email protected] Table 8Correlation among the study variables Employees Satisfaction
Working Environment
Employees
Turnover Job Stress Employees‘ Satisfaction 1
Working Environment .630** 1
Employee Turnover .325** .352** 1
Job Stress .403** .373** .531** 1
Table 8 clearly shows that all the variables have been positively correlated to each other at 5% level of significance. Correlation between employee satisfaction and job stress & employee turnover has been low i.e. .403 and .325 indicate that job stress and employee turnover have lower impact on employees‘ satisfaction after merger.
Regression among the variables
Table 9
Details
Working Environment
Employee
Turnover Job Stress
b (Coefficient) 2.126 1.102 2.253
R Square (%) 82.2 74.4 68.6
"t" Value 1.915 2..421 2.189
Significance .002 0.025 0.115
On simple observation of table 9, it has been clear that there exists a positive relationship between Employee Satisfaction with Working Environment, Employee Turnover and Job Stress. About 68% to 82% of variance of employee satisfaction has been explained by job stress, employee turnover and working environment.
Conclusion
Merger and acquisitions significantly affect the performance and contribution of the employees. Therefore, banks should focus on providing better working environment, minimizing job stress and turnover rate of the employees to achieve better performance from their employees. Banks should identify the different factors of employee satisfaction after merger and acquisitions which has positive and negative impact on employee satisfaction. All the employees who are working in different banks are satisfied when they are exercising the authority, quality of work life and overall satisfaction with working environment.
Employees of both banks i.e. NMB Bank Limited and Citizen Bank Limited are satisfied after merger and acquisition. The correlation among the working condition, employee turnover & job stress show positive relation with employee satisfaction. This shows that all the factors are equally responsible for the employee satisfaction after merger. This is also supported by the regression result giving the significant impact of worker condition, employees turnover and job stress on employee satisfaction after merger.
Bibliography
15
International journal of Management, IT and Engineering http://www.ijmra.us, Email: [email protected] Catwright, S., & Cooper, C.(1993).The psychological Impact of Merger and Acquisition on the Individual:Astudy of Building Society Managers.Human relations.46,3327-347. Catwright, S., & Cooper, C. (1996). Managing mergers, acquisitions and strategic alliances:Integrating People and cultures. Oxford: Butterworth and Heinemann.
Datta, D. K. (1991). Organizational fit and acquisition performance: Effects of post acquisition integration. Strategic Management Journal , 281-297.
Doukas, J., & Petmezas, D. (2007). Acquisitions, Overconfidenct Managers and Self Attribution Bias. European Financial Managemet , 531-577.
Economic Survey, Nepal (2018)
Fatima, T., & Shehzad, A. (2014). An analysis of Impact of Merger and Acquisition of Financial Performance of Bankis: A case of Pakistan. Journal of Poverty, Investment and Development , 29-36.
Houston, J. F., James, C. M., & Ryngaert, M. D. (2001). Where do merger gains come from ? Bank mergers from the perspectives of insiders and outsiders. Journal of Financial Economics , 285-331.
Hunsaker, P. L., & Michael, W. C. (1988). Mergers and Acquisitions: Managing the emotional Issues. Personnel 67 , 56-63.
Lubatkin, M., Schweiger, D., & Weber, Y. (1999). Top managemnt turnover in related M&As: An additional test of the theory of relative standing. Journal of Management , 55-74.
Lyman, W. P., Richard, M. S., Richard T, M., & Paul V, B. (1974). Organizational commitment, job satisfaction, and turnover among psychiatric technicians. Journal of Applied Psychology , 603-609.
Monetary Policy of Nepal, (2072/73)
Pant, P. R. (2011). Social Science Research and Thesis Writing. Buddha Academic Publishers
and Distributors Pvt. Ltd. Kathmandu, Nepal
Robino, D., & Demeuse, k. (1985). Corporate mergers and acquisitions: Their impact on HRM. Personnel Administrator , 33-44.
Schuler, R., & Jackson, S. (2001). HR Issues and Activities in Mergers and Acquisition. European Management Journal , 239-253.
16
International journal of Management, IT and Engineering http://www.ijmra.us, Email: [email protected] OPTIMIZATION OF PROCESS PARAMETERS OF MILLING OPERATIONSUSING VORTEX TUBE COOLING SYSTEM
Mr. Pradeep Kumar Mr.Gaurav Bhardwaj
Assistant Professor M.Tech Scholar
Neelkanth Institute of Technology Dr. A P J Abdul Kalam Technical University
Meerut Lucknow
ABSTRACT
The purpose of this work is to study and analyze the effectiveness of Vortex tube as a cooling system for milling operation. The vortex tube, also known as the Ranque-Hilsch vortex tube, is a mechanical device that separates a compressed gas into hot and cold streams. It is a simple and useful device without any moving parts, electrical or chemical power input or special equipments which produces desired cold or hot air economically. Use of vortex tube reduces the need for liquid coolant, which is messy, expensive, and environmentally hazardous. In this work surface finish of mild steel is compared after milling operation when dry machining is done without using any coolant and when cold air from vortex tube is used as a coolant in milling operation. It has been found that the ‗Cutting speed‘ and the ‗Feed‘ are the two major factors that significantly affect the surface finish and their optimum values were determined. Finally, the production trials were conducted with optimized process parameters value and other suggested countermeasures, it resulted in high surface finish and neat and clean machining environment.
Key words: Milling, Coolant, Vortex tube, Surface Roughness INTRODUCTION
Metal cutting generates heat which influences the quality of a finished product, the force needed in cutting as well as limiting the life of the cutting tool. There are various attempts by researchers all over the world to understand the mechanism and theory behind the temperature built-up during machining in order to achieve optimized machining procedure and best workpiece results. Higher production rate with required quality and low cost is the basic principle in the competitive manufacturing industry. This is mainly achieved by using high cutting speed and feed rates. Nevertheless, elevated temperatures in the cutting zone under these conditions shorten tool life and adversely affect the dimensional accuracy and surface integrity of component. It is known that cutting fluids, when properly chosen and applied, are used to minimize problems associated with high temperature and high stresses at the cutting edge of the tool during machining because of the lubrication, cooling, and chip flushing functions of the fluids. Also, the effectiveness of fluids depends on their ability to penetrate the chip-tool interface and to form a thin layer in the shortest available time, either by chemical attack or by physical adsorption, with lower shear strength than the strength of the material in the interface.
VORTEX TUBE COOLING SYSTEM
17
International journal of Management, IT and Engineering http://www.ijmra.us, Email: [email protected] temperatures of 150° C, and the air emerging from the "cold end" can reach -30° C. It has no moving parts. Pressurized gas is injected tangentially into a swirl chamber and accelerated to a high rate of rotation. Due to the conical nozzle at the end of the tube, only the outer shell of the compressed gas is allowed to escape at that end. The remainder of the gas is forced to return in an inner vortex of reduced diameter within the outer vortex.Fig 1.1 Vortex tube
SELECTION OF SIGNIFICANT PROCESS PARAMETERS OF MILLING
Milling is one of the important machining operations. In this operation the workpiece is fed against a rotating cylindrical tool. The rotating tool consists of multiple cutting edges (multipoint cutting tool).There are various process parameters in a milling operation. Some of them are very important which affects the output to a great extent and some are less important. Surface finish is mainly the result of process parameters such as tool geometry and cutting conditions (feed rate, cutting speed, depth of cut), but in addition there is also a great number of factors influencing surface roughness. The significant milling parameters which are primarily responsible for the surface finish was selected by studying the milling process and previous research papers. The non significant process parameters were dropped and the significant parameters are selected for the further analysis and optimization. The four process parameters, cutting speed, depth of cut, feed and type of coolant were found most significant. Table 1.1 displays the significant process parameters and their level.
TABLE 1.1: PROCESS PARAMETERS FOR MILLING OF MILD STEEL Response Variable – Average surface roughness value
Process Parameters Level 1 Level 2 Level 3 Level 4
Cutting speed (RPM) 400 500 600 700
Depth of cut (mm) 1 1.5 2 2.5
Feed (mm/rev) 0.5 1 1.5 2
Type of coolant Limited to two levels (i) Dry machining and
(ii) Using vortex tube as cooling system OPTIMIZATION OF PROCESS PARAMETERS USING TAGUCHI METHOD
Optimization of significant process parameters was done by using Taguchi method. In present study, an L16 orthogonal array was used. This array has fifteen degrees of freedom
18
International journal of Management, IT and Engineering http://www.ijmra.us, Email: [email protected] and sixteen milling parameter combinations were tested. The four most significant process parameters, cutting speed, depth of cut, feed and type of coolant were selected and tried with different combination of process parameter level. From the four significant process parameters one process parameter i.e. type of coolant could not be divided into different levels, only two levels were taken. Once the experimentation was performed without any coolant i.e. dry machining and second variation involved was the case of machining with vortex tube cooling system. Hence the combinations of remaining three most significant process parameters were tried for different levels within the permissible range according to workpiece material characteristics and machinability. In this regard, brain-storming was done with the lab technician of the Neelkanth Institute of Technology, Meerut, (U.P) and industry personnel.The main aim of the study was to reduce the surface roughness for which the ideal value is zero, the analysis was carried out by using MINITAB-17 statistical software in which the S/N ratio was computed by using the smaller the better quality characteristics; n = [-10 log10
(mean of sum of squares of measured data)]. In the Taguchi method, the signal to noise ratio (S/N) was used as the data transformation method that consolidates the data for each control array row over the various noise levels into one value which computes both the mean and the variation present in the data. The equations for calculating the signals to noise ratios were based on the characteristics of the response variables being evaluated; nominal the best, smaller the better and larger the better. In the present work the main objective was to reduce the surface roughness value. The surface roughness value for each trial was evaluated and the report generated was obtained from MINITAB-17 statistical software.
The S/N ratio was obtained using Taguchi‘s methodology. Here, the term ‗signal‘ represents the desirable value (Mean) and the ‗noise‘ represents the undesirable value (standard deviation). Thus, the S/N ratio represents the amount of variation presents in the performance characteristic. Here the desirable objective was to optimize the response variables Ra. Hence a smaller-the-better type S/N ratio was applied for transforming the raw data for surface roughness as smaller values of Ra was desirable.
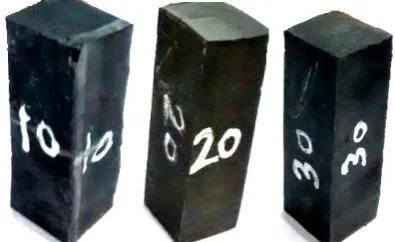
Total sixteen experiments were conducted as suggested by L16 orthogonal array. Sixteen
samples of mild steel of size 48 x 46 x5 mm were prepared. Each experiment was performed on a different mild steel sample of standard size. Surface roughness of each sample was measured using surface roughness tester. Three values of surface roughness were recorded and average of these three values was taken for further analysis. The average values of surface roughness are tabulated in table 1.2.
TABLE 1.2: AVERAGE SURFACE ROUGHNESS VALUE OF TRIAL AND S/N RATIO
S. No. Cutting speed
in (RPM)
Depth of cut in (mm)
Feed in (mm/rev) Average surface
roughness Ra in (µin)
S/N Ratio
1 400 1 0.5 16.55 -24.3760
2 400 1.5 1 8.07 -18.1375
3 400 2 1.5 15.50 -23.8066
4 400 2.5 2 15.20 -23.6369
19
International journal of Management, IT and Engineering http://www.ijmra.us, Email: [email protected]6 500 1.5 1 1.15 -1.21396
7 500 2 1.5 2.50 -7.95880
8 500 2.5 2 5.20 -14.3201
9 600 1 0.5 10.50 -20.4238
10 600 1.5 1 6.50 -7.95880
11 600 2 1.5 8.50 -18.5884
12 600 2.5 2 3.25 -10.2377
13 700 1 0.5 1.32 -2.41148
14 700 1.5 1 1.13 1.023
15 700 2 1.5 3.50 6.02060
16 700 2.5 2 1.50 -3.52183
FABRICATION OF VORTEX TUBE
Vortex tube was fabricated by using PVC pipes. Dimensions of each part were selected by studying various research papers related to the design of vortex tube. Fabrication detail of all parts is explained as follows:
I. Main Body
Main body of the vortex tube is the middle part of the tube as shown in the fig. 1.2. It is a PVC pipe of diameter 38 mm and length 70 mm. Inlet nozzle was fitted to this part which receives compressed air from the compressor.
II. Cold Tube
Cold tube is the short length tube on the right side of the main body. It is also a PVC pipe of diameter 25 mm and length 100 mm. One end of cold tube was fitted into the main body and other end was open and reduced to a size of 10 mm with a reducer as shown in fig. 1.2.
III. Hot Tube
Hot tube is the long tube on the left side of the main body. It is also a PVC pipe of diameter 25 mm and length 280 mm. One end of hot tube was fitted into the main body and in other end conical wooden valve was inserted as shown in fig. 1.2.
IV. Inlet Nozzle
Inlet nozzle is a very important part of the vortex tube which provides the required kinetic energy to the compressed air. In the given vortex tube inlet nozzle used, was a mild steel nozzle of 10 mm diameter. It was inserted into the main body of the vortex tube and leak sealant was applied on the joint to prevent leakage.
V. Conical Valve
20
International journal of Management, IT and Engineering http://www.ijmra.us, Email: [email protected] Fig 1.2 Fabrication of vortex tubeEXPERIMENTAL VALIDATION
Milling is a widely used manufacturing process in the industry. After deep study of all the factors it was observed that the major factors responsible for surface roughness of the product were cutting speed, depth of cut, feed and type of coolant, amount of coolant used. The process parameters of milling using vortex tube as a cooling system were optimized to get a least value of average surface roughness. Taguchi Method was adopted for this specific purpose which had capabilities to design a set of experiments according to process parameters and their stages under the fixed tolerance limits.
COMPARISON OF SURFACE FINISH ON MILD STEEL SPECIMENS
Main objective of this work was to utilize vortex tube as a cooling system and to use cold air from the cold end of the vortex tube as coolant in milling operation. Milling operation was performed on mild steel specimens of dimensions 48 x 46 x 5 mm. milling machine with a horizontal arbor of 25 mm diameter was used for this work. Eight samples were taken from prepared standard size mild steel specimens and milling operation was carried out with optimized process parameters i.e. speed, depth of cut and feed. These samples were machined without using any coolant and with vortex tube cooling system. Surface roughness was measured using Surftest SJ-210 measuring instrument.
RESULTS AND DISCUSSION
Conical Valve Main Body Inlet Nozzle
Cold Tube
21
International journal of Management, IT and Engineering http://www.ijmra.us, Email: [email protected] The average value of S/N ratio for each level for each factor obtained is shown in Table 1.3. The table includes ranks based on delta statistics, which compare the relative magnitude of effects. The delta statistic is the highest minus the lowest average for each factor. Minitab assigns ranks based on delta values; rank 1 to the highest delta value, rank 2 to the second highest, and so on. The ranks indicate the relative importance of each factor to the response. The ranks and the delta values show that cutting speed has the maximum and the depth of cut has the minimum effect on surface roughness value.TABLE 1.3: RESPONSE TABLE FOR SIGNAL TO NOISE RATIOS [Smaller is better [-10*Log10 (sum(Y**2)/n)]
Process Parameters
Level-1 Level-2 Level-3 Level-4 Rank
(Max-min)
Cutting speed -22.4892 -5.9374 -16.3770 0.0218 22.5111 1
Feed -11.9250 -5.6528 -14.6376 -12.5664 8.9848 2
Depth of cut -11.8670 -8.9024 -11.0833 -12.9291 4.0267 3
22
International journal of Management, IT and Engineering http://www.ijmra.us, Email: [email protected] Fig 1.3 Main effects plot for S/N ratiosANALYSIS OF VARIANCE
The analysis of variance (ANOVA) for S/N ratio was computed in order to identify the milling process parameters which significantly affect the surface roughness. The data for each factor was tested for F value to find significance of each factor. The Null hypothesis testing is valid when computed F value is less than standard F value and computed P value is higher than the standard P value, otherwise the factors significantly affect the quality characteristic. For the present experiment the standard F value is 19.00 and the standard P value is 0.05 for F distribution curve with 95% confidence level. It is evident from the Table 1.4 that:
The computed F values for the cutting speed ( F value 56.3) and feed (F value 22.78) were higher than standard F(19.00 ) value and the computed P value was lower than the standard P value indicating that these were the factors that significantly affect the surface finish.
The computed F value for depth of cut (F value 1.32) was less than the standard F value thus the effect of this factor was found insignificant.
TABLE 1.4: ANALYSIS OF VARIANCE FOR S/N RATIOS
Source DF Seq SS Adj SS Adj MS F P
Cutting speed 3 1231.49 1231.49 410.497 56.39 0.000
Depth of cut 3 34.91 34.91 11.636 1.32 0.354
Feed 3 172.92 172.92 59.975 22.78 0.024
Error 6 53.09 53.09 8.848
Total 15 1499.41
23
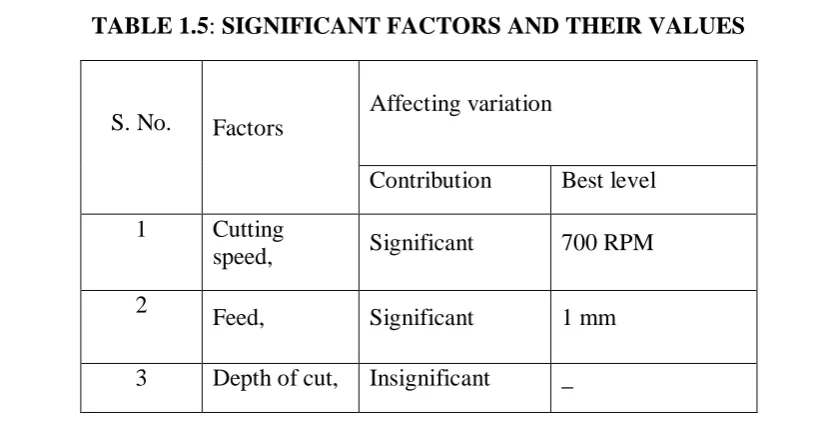
International journal of Management, IT and Engineering http://www.ijmra.us, Email: [email protected]TABLE 1.5: SIGNIFICANT FACTORS AND THEIR VALUES
S. No. Factors Affecting variation
Contribution Best level
1 Cutting
speed, Significant 700 RPM
2
Feed, Significant 1 mm
3 Depth of cut, Insignificant _
CONFIRMATION TRIALS
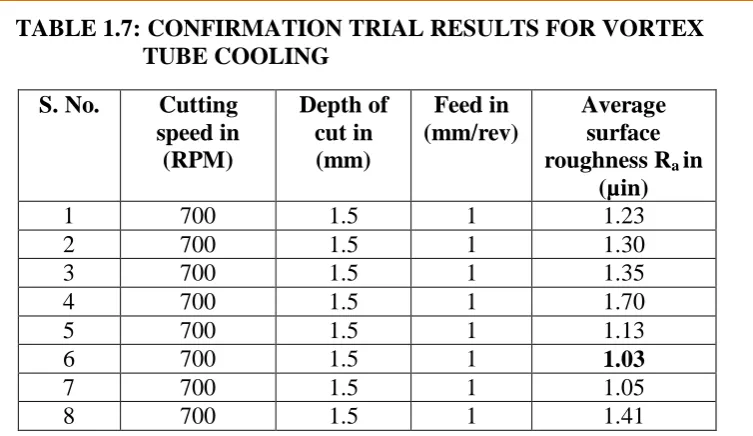
The final step was to predict and verify the reduction in the average roughness value after implementing the suggested process parameters. The Taguchi method for design of experiment specifies that level of parameters which has the maximum S/N ratio as the optimum parameter. Therefore the level of process parameters which had the maximum S/N ratio was selected as the optimum process parameter for the final trial tests to verify. Table 1.6 and 1.7 shows the values of average surface roughness in case of no coolants and in case of vortex tube cooling system.
TABLE 1.6: CONFIRMATION TRIAL RESULTS FOR USING NO COOLANTS
S. No. Cutting speed in
(RPM)
Depth of cut in (mm)
Feed in (mm/rev)
Average surface roughness Ra
in (µin)
1 700 1.5 1 2.54
2 700 1.5 1 3.30
3 700 1.5 1 1.80
4 700 1.5 1 2.70
5 700 1.5 1 3.65
6 700 1.5 1 2.80
7 700 1.5 1 5.15
24
International journal of Management, IT and Engineering http://www.ijmra.us, Email: [email protected] TABLE 1.7: CONFIRMATION TRIAL RESULTS FOR VORTEXTUBE COOLING
S. No. Cutting
speed in (RPM)
Depth of cut in (mm)
Feed in (mm/rev)
Average surface roughness Ra in
(µin)
1 700 1.5 1 1.23
2 700 1.5 1 1.30
3 700 1.5 1 1.35
4 700 1.5 1 1.70
5 700 1.5 1 1.13
6 700 1.5 1 1.03
7 700 1.5 1 1.05
8 700 1.5 1 1.41
The Average value of surface roughness obtained in eight trials for the case of without using any coolant during milling operation is 3.056 µin. Whereas the average value of surface roughness obtained in eight trials for the case in using vortex tube cooling system during milling operation is 1.275 µin.
The percentage reduction in surface roughness by using vortex tube cooling system is calculated as 58.27%.
CONCLUSIONS
In the present work, experimental investigations of milling operation were carried out to obtain an improved quality surface finish by using vortex tube as a cooling system. The following conclusions are drawn from the present investigation:
It is concluded that vortex tube can be utilized as a cooling medium in the milling operation. Fabrication of vortex tube was made possible by PVC pipes.
The temperature difference between hot end and cold end of the vortex tube was recorded as 12.6 °C.
It is concluded that cutting speed and feed are major factors that significantly affect the surface roughness of the mild steel during the milling operation. The other factor, Depth of cut is found to be insignificant. It is concluded that optimum value for cutting speed is found to be 700 RPM and for feed it is 1mm/rev.
Percentage reduction in surface roughness by using vortex tube cooling system is calculated as 58.27%.
25
International journal of Management, IT and Engineering http://www.ijmra.us, Email: [email protected] LIMITATIONS OF THE PRESENT WORKAlthough an optimum experimental work has been done to investigate the application of vortex tube as a cooling system for milling operation but still there are some limitations of present work. While carrying out the present work, the following limitations were encountered.
Temperature of the cold air used as coolant during milling operation can not be decreased much.
The experiment was conducted on the semi automatic milling machine available in the lab of Neelkanth Institute of Technology, Meerut, (U.P).
Cold air jet from vortex tube was directed toward tool workpiece interface manually due to which quality of surface finish was reduced in some experiments.
Conical valve at the hot end side of the vortex tube was also operated manually which caused some disturbance in the value of cold air temperature.
SCOPE FOR FUTURE WORK
The following research areas are recommended to be undertaken for obtaining minimum surface roughness in milling operation.
Study need to be conducted to obtain the minimum temperature at the cold end of the vortex tube.
Study need to be conducted for fabrication of the vortex tube from different type of materials.
Study need to be conducted for more levels of the milling process parameters.
Study need to be conducted for different angles of conical valve.
Study need to be conducted for automatic movement of the conical valve during operation.
REFERENCES
26
International journal of Management, IT and Engineering http://www.ijmra.us, Email: [email protected] 2. Aznijar Ahmad-Yazid, Zahari Taha, Indra Putra Almanar ―A review of cryogenic cooling in high speed machining‖ Scientific Research and Essays Vol. 5, 4 March, 2010, pp. 412-427.3. Cakir. O, Yardimeden. A, Ozben T, ―Selection of cutting fluids in machininig processes‖ Journal of Achievements in Materials and Manufacturing Engineering, Volume 25 issue 2 December 2007, pp 139-145.
4. L De Chiffre, ―Function of cutting fluids in machining‖ Lubrication Engineering 1988, pp514-518.
5. Lewinsa Jeffery, Bejanb Adrian ―Vortex tube optimization theory‖ University of Cambridge, Magdalene College, Cambridge, 1999, pp 931-32.
6. Shamsoddini Rahim, Khorasani Ahmadreza Faghih ―A new approach to study and optimize cooling performance of a RanqueeHilsch vortex tube‖ International Journal of Refrigeration, Volume 35, September 2012, pp 2339-2341.
7. Selek M, Tasdemir S, Baskaya S, ―Experimental examination of the cooling performance of Ranque-Hilsch vortex tube on the cutting tool nose point of the turret lathe through infrared thermography method‖ International Journal of Refrigeration, Volume 34(2011), pp 807-815.
8. O. Çakir, A. Yardimeden, T. Ozben, E. Kilickap ―Selection of cutting fluids in machining processes‖ Journal of Achievements in Materials and Manufacturing Engineering, Volume 25, Issue 2, Dec 2007, pp 99-102.
9. Seth U.S.P., Sundrarajan T., Mallikarjuna J. M., ―Refrigeration cycles‖ Indian Institute of Technology Madras, NPTEL.
27
International journal of Management, IT and Engineering http://www.ijmra.us, Email: [email protected] STUDY ON THE COMPRESSIVE STRENGTH OF SELF-COMPACTING CONCRETE WITH PERCENTAGE REPLACEMENT OF CEMENT WITHGROUND GRANULATED BLAST FURNACE SLAG
Mr. Kshitij Kamal Saxena
Scholar at Vivekanand College of Technology & Management, Aligarh
Abstract-
In the last few years, the use of Self Compacting Concrete (SCC) is increasing and there has been a lot of research and amendments to produce self compacting concrete, which have the desired characteristics. In the form of raw materials in concrete, there is a current trend around the world to treat and treat untreated industrial by household wastes etc. Not only do they help reuse waste products, but also create a clean and green environment. The current study focuses on the use of ground granular blast furnace slag (GGBS) as partial replacement of fine aggregate and cement respectively in SCC. In this paper, experimental study is done on fresh and rigorous properties such as the ability to flow, ability to pass, the compressible strength of the M50 grade of the SCC. In this investigation, SCC was partially made with partial change with granite sludge with GGBS and cement. Five mixes with different percentages of Granite Sludge (0%, 5%, 10%, 15% and 20%) as partial replacement for cement (0%, 10%, 20%, 30% and 40%) of GGBS as partial replacement for fine aggregate (M-sand) is considered. Functional and rigid test are conducted for each mixture respectively. Examination results for strict quality are done in 7, 28 days respectively. The purpose of this research is to know the behavior and mechanical properties of self compacting concrete after connecting industrial wastes in different proportions by a test such as compressive strength. The results obtained are discussed and the conclusion is finally concluded accordingly.
Keywords— SCC, GGBS, Granite Sludge, Compressive strength.
Introduction-
28
International journal of Management, IT and Engineering http://www.ijmra.us, Email: [email protected] limited access to consolidation. Due to industrialization, there is heavy use of granite waste, GGBS etc. and there are industrial wastes and this creates a threat to the environment, hence the cost of the structure is reduced. Similarly to make the structure more sustainable, the issue of this material is reduced.The purpose of this research-
This research has been started so that it can be utilized for subsequent efforts to create the effort made.
a) To study the properties of self compacting concrete.
b) Made by GGBS to replace cement by granite mud and M-sand. c) Finding new and rigid properties of SCC by different methods. d) Studying comparisons
Literature Review-
Now the one-day concrete is around the accepted and most used construction material. Essentially concrete cement, fine aggregate, thick aggregate, water is made and in addition there is some time with the increase of mineral and chemical mixture. Due to the increase in development, the demand for concrete is increasing and at the same time the access to various components of cement and concrete can be ended. It may be less than the use of industrial by products as a replacement material, which will not affect the properties of concrete. Previous research has argued that the use of granite waste and GGBS produces mechanical properties of concrete and apart from this, the expansion of these materials in self-compacting concrete will not change the properties further. In [1,2,3] Dosages of super-plasticizers used for mixing, packing, combing water, and additions are key points affecting SCC properties. Thus, he proposed another mix design method for self-compacting concrete. Finally Nan Su method could be used to produce effectively SCC of high quality. Compared with the other technique created by the Japanese Ready-Mixed Concrete Association (JRMCA), this method is less complex, easier for implementation and less time-consuming, requires a smaller amount of binders and saves cost. From [4, 5, 6, 7, and 8] Maximum 20% partial replacement of cement with granite waste has expanded the quality parameters of self compacting concrete. In [9, 10, 11, 12] The correct aggregate has been changed to 30% with GGBS. It has been found that compressive strength, tensile strength and flexure power increment have been divided with increasing the replacement rate of fine aggregates with GGBS. Concrete is to be kept 0%, 5%, 10%, 15% and 20% for the same, and the fine gross is replaced by GGBS as 0%, 10%, 20%, 30% and 40%.
Cement-
Cement may be defined as the binding material posses binding property which helps in combining with other inert material to form a dense assembly.
Corporal properties
Cement is generally characterized according to its corporal properties for aiming quality control. Corporal properties of cement are accustomed to differentiate and to analogize the various cements.
Following are the various corporal properties of cement Time of setting
29
International journal of Management, IT and Engineering http://www.ijmra.us, Email: [email protected] Composition of Portland Pozzolona CementThe major ingredients of PPC are as follows. Calcium
Alumina Silica Iron
Calcium is generally obtained from limestone, marl or chalk. While silica, alumina and iron come from sand, clays and iron ores.
Contents Percentages
CaO 60 – 67
SiO2 17 – 25
Al2O3 3 – 8
SO3 2 - 3.5
Alkalis 0.3 – 1.2
MgO 0.5 - 6
Fe2O3 0.5 – 6
Table1: Percentage of materials present in cement
The major compound generally form after the addition of water in cement known as Bogus Compounds are as follows
Tri calcium Aluminate (C3A)
Tetra Calcium Alumino Ferrate (C4AF) Tri Calcium Silicate (C3S)
Di Calcium Silicate (C2S)
Setting and Hardening-
When water is assorted with Pozzolona Cement, The various ingredient of cement undergoes a chain of chemical reactions which causes it to harden. This process of chemical reaction is known as hydration process and heat generates from these reaction is known as heat of hydration. These chemical reactions give some compounds which are known as BOUGs compound responsible for the properties of cement. These compounds plays an important role in the hardening of cement are described as follows as per their formation
Tri calcium Aluminates (C3A) – Thiscompound form after the addition of water in cement within 24 hours. This compound generates maximum hydration‘s heat and accountable for the precociously strength of cement.
Tetra calcium Alumino ferrite (C4AF) – This compound also forms after the addition of water in cement within 24 hours but after the configuration of C3A.This compound contributes very little amount of energy in the cement.
30
International journal of Management, IT and Engineering http://www.ijmra.us, Email: [email protected] Di calcium silicate (C2S)- This compound forms after one year of addition ofwater in cement. This compound is responsible for the progressive strength of cement. This compound generates least heat of hydration.
Grounded Granulated Blast -furnace Slag
The grounded granulated blast furnace slag (GGBS) is a by- product produced from iron factory during formation of iron. Iron ore, coke and lime stone through in blast furnace and treated at temperature 1400 °C to 1600°C than it flowing on the top of molten iron in the form of fane. When the metallurgical smelting technique is complete, the lime in the flux has been chemically combined with the aluminates and silicates of the ore and coke ash to form a non-metallic product called blast furnace slag.
During the period of cooling and hardening from its molten state, blast furnace slag can be cooled in several ways to form any of several types of Blast furnace slag products. Its chemical composition is nearer to the chemical composition of cement that because it can be used in cement concrete.
Granulated Slag
Granulated slag is rapidly cooled by large quantities of water to produce a sand-like granule that is primarily ground into a cement commonly known as GGBS (Ground Granulated Blast Furnace Slag), or Type S slag cement. It is additionally mixed with Portland cement clinker to create a homogenized Type IS cement.
The important element of blast furnace scum are CaO (30-50%), SiO2 (28-38%),
Al2O3 (8-24%), and MgO (1-18%). On increasing the CaO content of the slag compressive
strength is increased. The MgO and Al2O3 content show the similar trend up to respectively
10-12% and 14%, beyond which no further improvement can be obtained. This chemical composition is nearer to the chemical composition of cement that because it can be used as a binder material and also used in concrete by replacing the by weight of cement.
Tests on GGBS
Standard consistency- The motive of this experiment figure out the water contents demanded to produce a GGBS standard consistency paste.
Accoutrements - vicat Accoutrement, ―Mixing trowel conforming the requirement of IS: 10086-1982‖.
Procedure: -
Weight approximately 400mg of GGBS and mix it with a weighed quantity of water, i.e- 10% to 25% % weight of GGBS. The time of mixing should vary between 5 to 7 minutes.
Brim the vicat‘s mould with paste and level it with the help of trowel. Loser the plunger smoothly till it hold the GGBS surface.
Uncork the plunger and permit it to penetrate into the paste. Note the interpretation on the guage.
Repeat the above procedure taking fresh samples of GGBS and different quantities of water until the reading on the guage is 5 to 7 mm.
Observations and calculations: Weight of GGBS taken = 400 g