290
International Journal of Pharmaceutical Sciences and Drug Research
2015; 7(3): 290-297
Research Article
CODEN (USA): IJPSPP
ISSN: 0975-248X
Development and Validation of Isocratic Stability Indicating Reverse Phase
LC Method with PDA Detection for Simultaneous Estimation of Olmesartan
Medoxomil and Hydrochlorothiazide in Its Marketed Formulation
Mohammad Yunoos
1*, D. Gowri Sankar
21Department of Pharmaceutical Analysis, Bapatla College of Pharmacy, Bapatla-522 101, Guntur (Dist.),
Andhra Pradesh, India
2College of Pharmaceutical Sciences, Andhra University, Visakhapatnam-530 003, Andhra Pradesh, India
ABSTRACT
A simple and precise stability indicating RP-HPLC method was developed and validated for simultaneous determination of Olmesartan Medoxomil (OLM) and Hydrochlorothiazide (HCTZ) in pure drug and
Pharmaceutical marketed formulation. Chromatography was carried out on Inertsil ODS C18 (150 × 4.6 mm, 5
particle size) column in an isocratic mode with mobile phase containing 0.2 % acetate buffer and acetonitrile in the ratio of 60:40% v/v at a flow rate of 1.0 ml/min. The analyte was monitored using PDA detector at 252 nm. The retention time was found to be 5.080 min and 10.493 min for Hydrochlorothiazide (HCTZ) and Olmesartan Medoxomil (OLM) respectively. The proposed method was found to be having linearity in the concentration range of 20-120µg/ml for Olmesartan Medoxomil (OLM) and 12.5-75.0µg/ml for Hydrochlorothiazide (HCTZ) with correlation coefficient value of 0.999 respectively. The mean % recoveries obtained were found to be 99.86-100.02 % for Hydrochlorothiazide (HCTZ) and 99.92-100.16 % for Olmesartan Medoxomil (OLM) respectively. Stress testing which covered acid, base, peroxide, UV light, neutral and thermal degradation was performed on under test to prove the specificity of the method and the degradation was achieved. The developed method has been statistically validated according to ICH guide lines. Thus the proposed method can be successfully applied for the stability indicating simultaneous determination of Olmesartan Medoxomil (OLM) and Hydrochlorothiazide (HCTZ) in bulk and combined tablet dosage form and in routine quality control analysis.
Keywords: Olmesartan Medoxomil, Hydrochlorothiazide, RP-HPLC, Forced degradation, Method validation.
INTRODUCTION
Olmesartan Medoxomil is Chemically (Figure 1), it is 2, 3-dihydroxy-2-butenyl-4(1-hydroxy-1-methylethyl)-2-propyl-1-[p-(o-1H-tetrazol-5-ylphenyl) benzyl]
*Corresponding author: Mr. Mohammad Yunoos,
Associate Professor, Department of Pharmaceutical Analysis and Quality Assurance, Bapatla College of Pharmacy, Bapatla, Andhra Pradesh, India; Tel.:
+91-7416509726; E-mail: [email protected]
Received: 30 March, 2015; Accepted: 24 April, 2015
imidazole-5-carboxylate, cyclic 2, 3-carbonate.
Int. J. Pharm. Sci. Drug Res. May-June, 2015, Vol 7, Issue 3 (290-297)
It has a molecular formula of C29H30N6O6 and
molecular weight of 558.59 g/mol. Olmesartan medoxomil belongs to class of angiotensin II receptor antagonists and is a cardio selective drug used to treat hypertension and various cardiovascular disorders. Olmesartan medoxomil is selectively inhibits the binding of angiotensin II to Angiotensin II receptor designated type 1(AT1) and this effectively inhibits the AT1-mediated vasoconstrictive and aldosterone-secreting effects of angiotensin II and results in a decrease in vascular resistance and blood pressure by producing vasodilation, and decreasing peripheral resistance.
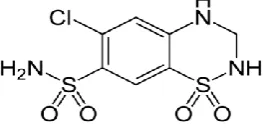
Fig. 2: Chemical structure of Hydrochlorothiazide
Hydrochlorothiazide is chemically (Figure 2), it is
(6-Chloro-3, 4-dihydro-7-sulfamoyl-2H-1, 2,
4-benzothiadiazin1, 1 dioxide. It has molecular formula
of C7H8ClN3O4S2 and molecular weight is
297.739g/mol. Hydrochlorothiazide, a thiazide diuretic, inhibits water reabsorption in the nephron by inhibiting the sodium-chloride symporter (SLC12A3) in the distal convoluted tubule, which is responsible for 5% of total sodium reabsorption. Normally, the sodium-chloride symporter transports sodium and chloride from the lumen into the epithelial cell lining the distal convoluted tubule. The energy for this is provided by a sodium gradient established by sodium-potassium ATPases on the basolateral membrane. Once sodium has entered the cell, it is transported out into the basolateral interstitium via the sodium-potassium ATPase, causing an increase in the osmolarity of the interstitium, thereby establishing an osmotic gradient for water reabsorption. By blocking the sodium-chloride symporter, hydrochlorothiazide effectively reduces the osmotic gradient and water reabsorption throughout the nephron. [1]
Literature survey revealed that few analytical methods were reported so far for both drugs in combination or
in alone like RP-HPLC [2-7], HPTLC [8-10] and
Spectrophotometric methods [11-13] in pharmaceutical
dosage forms but no stability studies were carried out on these combination of drugs and hence author has planned to develop a simple, precise, sensitive and selective stability indicating RP-HPLC method with PDA detection for the analysis of Olmesartan Medoxomil and Hydrochlorothiazide in bulk and in combined tablet formulation.
MATERIALS AND METHODS Chemicals
The Pharmaceutical grade pure samples of Olmesartan Medoxomil and Hydrochlorothiazide were received as
gift samples from Unichem Laboratories Ltd., Mumbai and Micro Labs Ltd., Bangalore. HPLC grade methanol and acetonitrile were purchased from E. Merck. Chem. Ltd., Mumbai. Milli-Q water was used for preparation of solutions. All the chemicals used were of analytical reagent grade (E. Merck). Fixed dose combination tablet formulation (Olmax H) containing 40 mg of
Olmesartan Medoxomil and 12.5 mg of
Hydrochlorothiazide (Manufactured by Glenmark Pharmaceuticals Ltd., Mumbai) was procured from local market.
Instrumentation
Quantitative HPLC was performed on Waters 2695 separation module Alliance Isocratic HPLC system and PDA Detector 2996 series equipped with auto injector using empower software 2. A shimadzu UV2600 UV/Visible double beam spectrophotometer with 1 cm matched quartz cells was used for all spectral measurements. Eppendrof Centrifuge 5810R was used for centrifugation.
Chromatographic conditions
Parameter Condition
Mobile phase
composition 0.2% acetate buffer: acetonitrile in the ratio of 60:40%v/v
Stationary phase Inertsil ODS C18 column
(150 × 4.6mm, particle size 5µ)
Detector wave length 252 nm
Run time 18 min
Flow rate 1.0 ml/min
Injection volume 20µl
Colum temperature 30°C
Preparation of Acetate buffer
0.2 % of acetate buffer was prepared by diluting 2 ml of glacial acetic acid to 1000 ml of Milli-Q water in a 1000ml volumetric flask, degassed by subjecting to sonication for 5 min and then filtered through 0.45µ Millipore nylon filter before use.
Preparation of Mobile phase
0.2% acetate buffer and acetonitrile were taken in the ratio of 60:40%v/v, mixed and then degassed by subjecting to sonication for 10 min and resultant solution used as mobile phase after filtration.
Preparation of diluent 1
Acetonitrile, methanol and water were taken in the ratio 40:30:30 %v/v/v, mixed and sonicated to degas.
Preparation of diluent 2
Mixed acetonitrile and water in the ratio of 60:40 %v/v and kept it for sonication to degas the solution.
Preparation of standard solution
Accurately weighed and transferred 20 mg of
Olmesartan Medoxomil and 12.5 mg of
Hydrochlorothiazide working standards into a 50 ml
clean and dry volumetric flasks separately, 3/4th
Int. J. Pharm. Sci. Drug Res. May-June, 2015, Vol 7, Issue 3 (290-297)
ml was pipette out in to a 10 ml volumetric flask and then made up to the final volume with diluent 2 to obtain final concentration of 80µg/ml of Olmesartan Medoxomil and 50µg/ml of Hydrochlorothiazide working standard solution, filtered the solution through 0.45μm PVDF syringe filter before injecting into the chromatographic system.
Preparation of Sample solution
20 tablets were accurately weighed and calculated the average weight of each tablet. The tablets were crushed to a fine powder. An amount of powder equivalent to 20 mg of Olmesartan Medoxomil and 12.5 mg of Hydrochlorothiazide was weighed accurately and transferred into a 50ml volumetric flask, 30ml of diluent 1 was added, sonicated for 15 min and then volume was made up with diluent 1. Filtered through 0.45µ Millipore Nylon filter and from the filtered solution, 2ml was pipette out into a 10 ml volumetric flask and then volume was made up to mark with diluent 2 to obtain final concentration of 80μg/ml solution of Olmesartan Medoxomil and 50µg/ml solution of Hydrochlorothiazide. Then Injected 20µl of filtered portion of the sample, standard preparation and blank solution into the chromatograph separately. Recorded the responses for the major peaks. Calculated
the content of Olmesartan Medoxomil and
Hydrochlorothiazide present in each tablet.
Method validation
Analytical validation parameters for this proposed method were determined according to ICH guidelines.
System suitability
System suitability was carried out by injecting five replicate injections of standard solutions of Olmesartan Medoxomil and Hydrochlorothiazide. The system suitability parameters were then evaluated for tailing factor, retention time and theoretical plates of standard chromatograms. % RSD for peak area of five replicate injections of standard solutions (% RSD NMT 2) were within the limits. The results for system suitability studies are presented.
Specificity
The specificity of the method was performed by injecting blank, placebo, standard and sample preparations into the chromatograph. Chromatograms were recorded. Retention times obtained from standard and sample preparations were compared for identification of analytes.
Linearity
The linearity of an analytical method was carried out to check its ability to elicit test results that are directly, or by a well-defined mathematical transformation, proportional to the concentration of analyte in samples within a given range. Different concentration of linearity solutions were prepared by diluting aliquots (0.5- 3.0 ml) of standard stock solution (400µg/ml of
Olmesartan Medoxomil and 250µg/ml of
Hydrochlorothiazide) into each 10 ml volumetric flasks (6 no’s) and diluted to final volume with diluent 2 to obtain concentrations in the range of 20-120µg/ml for
Olmesartan Medoxomil and 12.5-75.0 µg/ml for Hydrochlorothiazide respectively to demonstrate linearity for assay and then injected each concentration
into the chromatographic system and the
chromatograms were recorded. The calibration graphs were plotted between amount of drug concentration (µg/ml) and chromatographic peak areas (mV) of Olmesartan Medoxomil and Hydrochlorothiazide respectively. The linearity of the proposed method was then evaluated by linear regression analysis. The correlation coefficient, slope and intercept were calculated from the graph.
Accuracy
The accuracy of the test method was demonstrated by % recovery across its range by adding a known quantity of the standard to the pre analysed sample. The recovery was carried out at 50%, 100% and 150% of the initial assay concentration using standard addition method and at each level, 3 samples were prepared and total of 9 samples were injected separately into the chromatographic system and the contents were then determined from respective chromatograms. The results were found to be within limit and the method was accurate.
Precision
System precision (Repeatability)
System precision was established by six replicate injections of the working standard solution at 100% concentration level into the chromatographic system. The corresponding peak areas of Olmesartan Medoxomil and Hydrochlorothiazide were measured and % RSD was calculated.
Method precision
The method precision study was performed by injecting six sample preparations of marketed formulations into the chromatographic system. The corresponding peak areas of Olmesartan Medoxomil and Hydrochlorothiazide were measured and % RSD was calculated.
Inter-day precision
Inter-day precision was performed by injecting
standard preparations six times into the
chromatographic system on different days by maintaining the optimized chromatographic conditions and calculated %RSD of retention time and peak areas
for both Olmesartan Medoxomil and
Hydrochlorothiazide.
Specificity
Specificity is the ability to assess unequivocally the analytes in the presence of compounds that may be expected to present, such as impurities, degradation products and matrix components. The specificity of the method was assessed by comparing the chromatograms obtained from standard and sample solutions. The retention times of the analytes in standard and the sample solutions were found to be same, so the method was specific and free from interference from excipients present in the tablets.
Int. J. Pharm. Sci. Drug Res. May-June, 2015, Vol 7, Issue 3 (290-297)
Limit of detection is the lowest concentration of the analyte that can be detected by injecting decreasing amount, not necessarily quantity by the method, under the stated experimental conditions. The minimum concentration at which the analyte can be detected is determined from the linearity curve by applying the formula.
LOD=3.3 Sa/b
Sa is the standard deviation of intercept
b is the slope of calibration curve
Limit of Quantification (LOQ)
Limit of quantification is the lowest concentration of the analyte in a sample that can be estimated quantitatively by injecting decreasing amount of drug with acceptable precision and accuracy under the stated experimental conditions of the method. Limit of quantitation can be obtained from linearity curve by applying the following formula.
LOQ=10 Sa/ b
Sa is the standard deviation of intercept
bis the slope of calibration curve
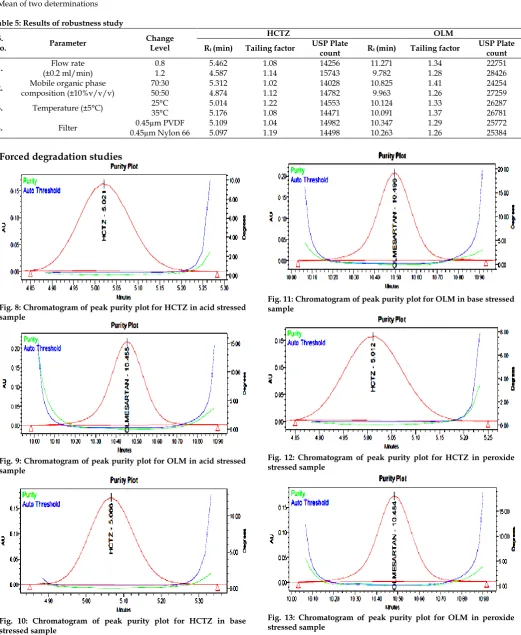
Robustness
The robustness of the proposed method was determined by analyzing aliquots from homogenous lots by differing physical parameters like mobile organic phase composition, flow rate and column temperature. The standard and sample solutions were injected into the chromatograph at varied conditions of flow rate ± 0.2 ml/min, mobile organic phase ± 10%, mobile phase buffer pH ± 0.2 units and temperature by + 5°C. The content of the drug was not adversely affected by these changes as evident from the low value of relative standard deviation indicating that the method was robust.
Stability of the solution and Forced degradation studies
In order to demonstrate the stability of both standard and sample solutions during analysis, both solutions were analyzed over a period of 24 hrs at room temperature. The results showed that for the solutions, the retention time and peak area of Olmesartan Medoxomil and Hydrochlorothiazide were remained almost similar (%RSD less than 2.0) and no significant degradation within the indicated period, thus indicated that both solutions were stable for at least 24 hrs, which was sufficient to complete the whole analytical process. Further forced degradation studies were conducted indicating the stability of the developed method by degrading the sample forcefully under the various stress conditions like acid, base, water, light, heat hydrolysis and peroxide oxidation. The results of the degradation studies are presented.
Acid degradation studies
To 2 ml of stock solution of OLM and HCTZ, 1ml of 0.1N Hydrochloric acid solution was added and refluxed for 30 min at 60°C and then neutralized the solution with 1 ml of 0.1N sodium hydroxide solution. The resultant solution was suitably diluted with diluent 2 in a 10 ml volumetric flask to obtain final
concentration of 80µg/ml & 50µg/ml solution of OLM and HCTZ respectively. Then 20µl solutions were injected in duplicate into the chromatographic system and the chromatograms were recorded to assess the stability of sample.
Base degradation studies
To 2 ml of stock solution of OLM and HCTZ, 1ml of 0.1N Sodium hydroxide solution was added and refluxed for 30 min at 60°C and then neutralized the solution with 1 ml of 0.1N Hydrochloric acid solution. The resultant solution was suitably diluted with diluent 2 in a 10 ml volumetric flask to obtain final concentration of 80µg/ml & 50µg/ml solution of OLM and HCTZ respectively. Then 20µl solutions were injected in duplicate into the chromatographic system and the chromatograms were recorded to assess the stability of sample.
Peroxide degradation studies
To 2 ml of stock solution of OLM and HCTZ, 1 ml of
3% Hydrogen peroxide (H2O2) was added and kept for
30 min at 60°C. The resultant solution was suitably diluted with diluent 2 in a 10 ml volumetric flask to obtain final concentration of 80µg/ml & 50µg/ml solution of OLM and HCTZ respectively. Then 20µl solutions were injected in duplicate into the chromatographic system and the chromatograms were recorded to assess the stability of sample.
Thermal degradation studies
The standard drug solution of OLM and HCTZ was placed in an oven at 105°C for 6 hrs to study dry heat degradation. For HPLC study, the resultant solution was suitably diluted with diluent 2 in a 10 ml volumetric flask to obtain final concentration of 80µg/ml and 50 µg/ml solutions of OLM and HCTZ respectively and 20µl solutions were injected in duplicate into the system and the chromatograms were recorded to assess the stability of the sample.
Photo stability studies
It is carried out by exposing 2 ml of stock solution of OLM and HCTZ to UV light, by keeping the beaker in UV Chamber for 72 hrs. The resultant solution was suitably diluted with diluent 2 in a 10 ml volumetric flask to obtain final concentration of 80µg/ml & 50µg/ml solutions of OLM and HCTZ respectively and 20µl solutions were injected in duplicate into the system and the chromatograms were recorded to assess the stability of sample.
Neutral degradation studies
Stress testing under neutral conditions was studied by refluxing the stock solution of OLM and HCTZ on water bath for 6hrs at a temperature of 60°C. For HPLC study, the resultant solution was suitably diluted with diluent 2 in a 10 ml volumetric flask to obtain final concentration of 80µg/ml & 50µg/ml solutions of OLM and HCTZ respectively and 20µl solutions were injected in duplicate into the system and the chromatograms were recorded to assess the stability of sample.
Int. J. Pharm. Sci. Drug Res. May-June, 2015, Vol 7, Issue 3 (290-297)
Fig. 3: Typical chromatogram of system suitability solution
From this study, it was found that a simple, precise, accurate, sensitive and efficient stability indicating RP-HPLC method has been developed and validated for simultaneous estimation of OLM and HCTZ in bulk and pharmaceutical dosage form. Chromatographic separation was carried out using mobile phase composed of 0.2% acetate buffer: acetonitrile in the
ratio of 60:40 %v/v on Inertsil ODS C18 column (150 ×
4.6mm, particle size 5µ) at a flow rate 1.0 ml/min using PDA detection at 252 nm. The retention time was found to be 5.080 min and 10.493 min for HCTZ and OLM respectively. System suitability chromatogram as shown in Figure 3 and results are shown in Table 1. Linearity was evaluated in the concentration range of 20-120µg/ml for OLM and 12.5-75 µg/ml for HCTZ respectively. The calibration curves were described by the equation y = 25500.3x +13483.07 and y = 76969.9x -112877 with correlation coefficient of 0.99996 and 0.99952 for OLM and HCTZ respectively as shown in figure 4 and figure 5 respectively. The standard and sample chromatograms in the specifity studies are shown in figure 6 and figure 7. Accuracy data as shown in Table 2. The validation summary parameters and assay results obtained from the marketed formulation is shown in Table 3 and Table 4. The results of robustness studies are shown in Ttable 5. The %RSD in precision, accuracy and robustness studies were found to be less than 2 %, indicating that the method was precise, accurate and robust. The stress testing chromatograms for both OLM and HCTZ are shown from figure 8 to figure 20 and results are shown in table 6.
Table 1: System suitability results
S. No. System suitability parameters HCTZ OLM
1 Tailing factor (Tf) 1.05 1.24
2 Resolution (Rs) 7.28
3 Retention time (Min) 5.080 10.493
4 Peak Area 2056719 3735921
5 Theoretical plates (N) 14543 26438
Table 2: Results of accuracy studies
Sample Level Peak area*
Amount added (mg/tab)
Amount recovered
(mg/tab)
Mean % Recovery
*± SD
OLM 100% 50% 1054489 2054927 10 5 5.035 9.992 100.7 ±0.12 99.92±0.24
150% 3059942 15 15.02 100.16± 0.16
HCTZ 100% 50% 1780216 3729788 2.5 5.0 4.998 2.50 100.02±0.22 99.97±0.17
150% 5689472 7.5 7.489 99.86±0.31
*Mean of three determinations
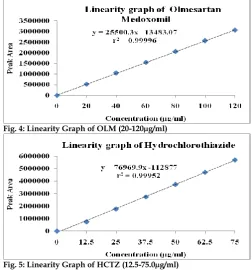
Linearity
R2 values were found to be 0.99996 and 0.99952 and
regression equation y = 25500.3x +13483.07 and y = 76969.9x -112877 for OLM and HCTZ respectively.
Fig. 4: Linearity Graph of OLM (20-120µg/ml)
Fig. 5: Linearity Graph of HCTZ (12.5-75.0µg/ml)
Table 3: Validation summary parameters of the proposed RP-HPLC method
Parameter OLM HCTZ
Regression equation y = 25500.3x +13483.07 y = 76969.9x -112877
Correlation coefficient 0.99996 0.99952
LOD (µg/ml) 0.419 0.186
LOQ (µg/ml) 1.52 0.642
System precision (% RSD) 0.12 0.18
Method precision (% RSD) 0.27 0.32
Inter-day precision (% RSD) 0.44 0.26
Specificity studies
Fig. 6: Typical chromatogram of standard
Int. J. Pharm. Sci. Drug Res. May-June, 2015, Vol 7, Issue 3 (290-297)
Robustness
The developed method was robust with deliberate changes in variation of mobile organic phase
composition, flow rate and temperature for both OLM
and HCTZ respectively.
Table 4: Results of assay in marketed formulation
Brand Drug Standard peak area Sample peak area Labelled amount (mg/tab) Amount found (mg/tab) % Assay % RSD*
Olmax H HCTZ OLM 2027485 3747318 2034529 3723758 12.5 20 20.06 12.42 100.34% 99.37% 0.27 0.54 *Mean of two determinations
Table 5: Results of robustness study S.
No. Parameter
Change Level
HCTZ OLM
Rt (min) Tailing factor USP Plate count Rt (min) Tailing factor USP Plate count
1. Flow rate
(±0.2 ml/min) 0.8 1.2 5.462 4.587 1.08 1.14 14256 15743 11.271 9.782 1.34 1.28 22751 28426 2. Mobile organic phase
composition (±10%v/v/v) 70:30 50:50 5.312 4.874 1.02 1.12 14028 14782 10.825 9.963 1.41 1.26 24254 27259 3. Temperature (±5°C) 25°C 35°C 5.014 5.176 1.22 1.08 14553 14471 10.124 10.091 1.33 1.37 26287 26781
4. Filter 0.45µm Nylon 66 0.45µm PVDF 5.109 5.097 1.04 1.19 14982 14498 10.347 10.263 1.29 1.26 25772 25384
Forced degradation studies
Fig. 8: Chromatogram of peak purity plot for HCTZ in acid stressed sample
Fig. 9: Chromatogram of peak purity plot for OLM in acid stressed sample
Fig. 10: Chromatogram of peak purity plot for HCTZ in base stressed sample
Fig. 11: Chromatogram of peak purity plot for OLM in base stressed sample
Fig. 12: Chromatogram of peak purity plot for HCTZ in peroxide stressed sample
Int. J. Pharm. Sci. Drug Res. May-June, 2015, Vol 7, Issue 3 (290-297)
Fig. 14: Chromatogram of peak purity plot for HCTZ in peroxide stressed sample
Fig. 15: Chromatogram of peak purity plot for HCTZ in thermal stressed sample
Fig. 16: Chromatogram of peak purity plot for OLM in thermal stressed sample
Fig. 17: Chromatogram of peak purity plot for HCTZ in UV stressed sample
Fig. 18: Chromatogram of peak purity plot for OLM in UV stressed sample
Fig. 19: Chromatogram of peak purity plot for HCTZ in neutral stressed sample
Fig. 20: Chromatogram of peak purity plot for OLM in neutral stressed sample
Table 6: Results of forced degradation studies Stress
condition
% degrada
tion
OLM HCTZ
Purity
angle threshold Purity Purity angle threshold Purity Acid
hydrolysis 4.92 0.073 0.236 0.051 0.288
Base
hydrolysis 4.97 0.084 0.241 0.048 0.299
Peroxide
degradation 6.61 0.107 0.236 0.065 0.283
Thermal
degradation 5.98 0.077 0.225 0.043 0.292
UV Exposure 4.12 0.074 0.231 0.053 0.259
Neutral
Int. J. Pharm. Sci. Drug Res. May-June, 2015, Vol 7, Issue 3 (290-297)
From this study, it is concluded that the proposed stability indicating RP-HPLC method was found to be simple, accurate, precise and rapid for the determination of Olmesartan Medoxomil and Hydrochlorothiazide in bulk & Pharmaceutical dosage form. The statistical parameters and recovery studies were carried out and reported. The obtained results were satisfactory as per ICH guidelines. Hence the developed method was found to be applicable for routine quality control analysis for the simultaneous
estimation of Olmesartan Medoxomil and
Hydrochlorothiazide in bulk and pharmaceutical dosage form.
ACKNOWLEDGEMENT
The author is grateful to Bapatla College of Pharmacy, Guntur dist., Andhra Pradesh, India for providing research facilities.
REFERENCES
1. Beermann B, Groschinsky-Grind M, Rosen A. Absorption, metabolism and excretion of hydrochlorothiazide. Clin Pharmacol. Ther. 1976; 19(5 Pt 1): 531–537.
2. Kavitha J, Muralidharan S. Development and Validation of New Method for Atenolol, Hydrochlorothiazide and Losartan potassium by RP-HPLC: Its Application to Routine Quality Control Analysis. Int J of Chem Tech Res. 2010; 2(2): 880-84.
3. Tengli AR, Gurupadayya BM. Method Development and Validation of Tablet Dosage form Containing Losartan, Atenolol and Hydrochlorothiazide Using Internal Standard by RPHPLC. J Chromat. Separation Techniq. 2013; 4(5): 1-5. 4. Hamrapurkar PD, Gadapayale KK. Optimization and
Validation of RP-HPLC Stability Indicating Method for Determination of Olmesartan Medoxomil and Its Degraded Product. Int J of Applied Sci and Engineering. 2013; 11(2):137-147.
5. Rane VP, Patil KR, Sangshetti JN, Yeole RD, Shinde DB. Stability-Indicating LC Method for the Determination of Olmesartan in Bulk Drug and in Pharmaceutical Dosage Form. Chromatographia. 2009; 69: 169-173.
6. Sagirli O, Onal A, Toker SE, Sensoy D. Simultaneous HPLC Analysis of Olmesartan and Hydrochlorothiazide in Combined Tablets and in vitro Dissolution Studies. Chromatographia. 2007; 66: 213-218.
7. Ashok kumar J, Sathya A, Senthil kumar K, Patil SN, Prathap B, Lokesh SB, Gopal V. Simultaneous Estimation of Olmesartan medoxomil and Hydrochlorothiazide by RP-HPLC Method from Combined Dosage Forms. Int J of Res and Pharm Sci. 2010; 1(1): 24-27.
8. Kumbhar ST, Chaugule GK, Tegeli VS, Gajeli VS, Thorat YS, Shivsharan US. A Validated HPTLC Method for Simultaneous Quantification of Nebivolol and Hydrochlorothiazide in Bulk and Tablet Formulation. Int J of Pharm Sci. Drug Res. 2011; 3(1): 62-66.
9. Della Grace Thomas Parambi, Mathew M, Ganesan V, Jose A, Revikumar KG. A Validated HPTLC Determination of an Angiotensin receptor blocker Olmesartan medoxomil from Tablet Dosage form. Int J of Pharm Sci Rev Res. 2010; 4(3): 36-39.
10. Kumbhar ST, Chougule GK, Tegeli VS, Gajeli GB, et.al. A Validated HPTLC Method for Simultaneous Quantification of Nebivolol and Hydrochlorothiazide in Bulk and Tablet Formulation. International Journal of Pharmaceutical Sciences and Drug Research. 2011; 3(1): 62-66.
11. Alagar Raja M, Selvakumar D. Method development and validation of hydrochlorothiazide in tablet dosage form by UV spectroscopy. Int J of Res Pharm Sci. 2010; 1(3): 369-71.
12. Vora BN, Parmar RR, Shah DA, Nayak PP. Absorption Correction Method for Simultaneous Estimation of Metoprolol Succinate and Olmesartan Medoxomil in Combined Tablet Dosage Form. J of Pharm Sci Bioscientific Res. 2012; 2(2): 54-57.
13. Singh S, Yadav AK, Gautam H. Simultaneous estimation of valsartan and hydrochlorothiazide in solid dosage form using UV spectroscopy. Bull. Pharm. Res. 2011; 1(3):10-20.