Abstract - Response surface methodology (RSM) was used to
study the process optimization of CO2/CH4 permselectivity
through polyfurfuryl alcohol (PFA) derived carbon molecular sieve (CMS) membrane. Based on central composite design (CCD), two quadratic models were developed to correlate the
preparation variables; carbonization temperature (x1), thermal
soak time (x2) and polymerization time (x3), to the responses; CO2
permeance (y1) and CO2/CH4 permselectivity (y2). Analysis of
variance (ANOVA) revealed that carbonization temperature was the most significant variables for both responses. The optimum preparation conditions for CMS membrane were obtained by
using carbonization temperature of 620oC, thermal soak time of 4
h and polymerization time of 11.4 h, which resulted in CO2
permeance and CO2/CH4 permselectivity of 3.09x10⁻¹⁰
mol/m2.s.Pa and 3.86, respectively.
Index Term- Carbon molecular sieve membrane, Optimization, Permeation, Polyfurfuryl alcohol, Response surface methodology
I. INTRODUCTION
Most of the developed countries have regulated the utilization of clean energy resources for domestic and industrial usage. This scenario has induced a constant rising in demand for that particular energy resource, such as natural gas. The global consumption of the natural gas was projected to be 182 trillion cubic feet in 2030 [1]. Crude natural gas is usually obtained naturally from the fossil fuel. It contain primary of CH4 and considerable amount of impurities such as water, CO2, N2 and H2S [2]. The impurities possess individual characteristic and might reduce the quality of the natural gas. The CO2 gas particularly might cause several problems such as low heating value, pipeline corrosion, atmospheric pollution and large volume of gas for transportation and storage [3]. Thus separation process of CH4 and CO2 from natural gas should be performed to minimize or eliminate the CO2 impurity.
This work was supported by the MOSTI and Universiti Sains Malaysia (Project number: 6013373 and 6071169). Mohd Azmier Ahmad and Abdul
Latif Ahmad are the members of Membrane Science and Technology Research Cluster of Universiti Sains Malaysia. Wan Mohd Hafiz Faisal Wan Harun and Noor KhalilahAbdul Rashid are postgraduate students working on
carbon molecular sieve membrane. The correspondence author can be contacted via e-mail: [email protected] (M.A. Ahmad).
There are numerous separation methods which are commonly being used for CO2 removal from natural gas such as amine treat and pressure swing adsorption (PSA). Generally, amine treat needs solvent regeneration, large footprint for offshore applications and lack of robustness against fluctuations of feed composition. Meanwhile PSA is highly capital intensive and requires significant energy consumption [4]. These constraints might limit the productivity of purified CH4 in natural gas processing.
In the last two decades, membranes separation process has emerged as an alternative to overcome the problems raised by the conventional separation processes. Inorganic membrane particularly carbon molecular sieve (CMS) membrane is the latest membrane technology which can withstand extreme conditions in natural gas processing [5]. The pore size of the CMS membrane is relatively smaller than the other inorganic membrane and can be controlled during membrane preparation step. Thus CMS membrane can be used to separate a mixture of gases such as CH4 O2, N2 and CO2. This offers advantages for the upgrading of crude natural gas [6].
In this work, a standard response surface methodology (RSM) design, known as central composite design (CCD) was applied to study the variables for preparing the CMS membrane. CCD helps to optimize the effective parameters with a minimum number of experiments, as well as to analyze the interaction between the parameters [7]. The effects of carbonization temperature, thermal soak time and polymerization temperature were studied simultaneously to obtain a high CO2 permeance and CO2/CH4 permselectivity of CMS membrane.
II. MATERIALS AND METHODS
A. Materials
Furfuryl alcohol (98% purity) purchased from Merck (M) Sdn. Bhd. was used without further purification. Oxalic acid, sodium chloride and sodium sulphate were purchased from Fisher Scientific (UK) and were used as received. The α-alumina (>98% purity) was supplied by Sigma-Aldrich (M) Sdn Bhd. Purified CO2 (99.95% purity), N2 (99.995% purity) and CH4 gases (99.95% purity) were supplied by Air Product (M) Sdn Bhd.
Application of RSM for Optimization of CMS
Membrane Synthesis from Polyfurfuryl Alcohol
for CO
2
/CH
4
Selectivity
Mohd Azmier Ahmad*, Wan Mohd Hafiz Faisal Wan Harun, Noor Khalilah
Abdul Rashid, Abdul
Latif Ahmad
B. CMS Membrane Preparation
The membrane support was prepared from α-alumina. The α-alumina particles were sieved and mixed with distilled water before pressed into disk shape. The disk was dried and calcined at temperature of 1300°C. For PFA solution preparation, the furfuryl alcohol was undergoing polymerization with utilizing oxalic acid as the catalyst. The process was carried out under reflux, in which 100 ml of furfuryl alcohol was mixed with 0.5 g oxalic acid. The mixture was subjected to vigorous stirring and temperature of 70°C. The polymerization times were varies according to design matrix. After the process completed, the water in the solution was removed by extraction using concentrated sodium chloride solution and sodium sulphate.
The polymer solution was deposited onto the support surface by dip coating. Then the sample was dried at 100°C and undergo carbonization step using wire wound tube furnace (Carbolite, model MTF 12/38/250). The heating rate was fixed at 2°C/min and 200 ml/min of nitrogen gas was purged into the system to provide inert atmosphere inside the quartz tube. The final temperature of carbonization and thermal soak time were varied according to design matrix. After the process completed, the sample was cool down to room temperature. Each samples performed two times coating-carbonization cycles to obtain pin-hole free CMS membrane.
C. Permeation Studies
CMS membrane sample was subjected to single gas permeability test at ambient temperature to determine the permeance and permselectivity. The system was maintained at 2.5 bar at feed section and vacuum at the permeate side. The permeation test applied variable volume-constant pressure method. Calibrated soap film flow meter was used to obtain the gas permeance penetrate traverse the membrane. The permeance of CMS membrane towards gas species can be defined by (1):
P=S . D (1)
where S and D are solubility coefficient and diffusion coefficient, respectively. The permeance denotes the rate at which a penetrant traverse a membrane. The selectivity of the membrane to specific gas is subject to the ability of the molecule to diffuse through the membrane. The permselectivity or ideal selectivity factor α, is simply the ratio of CO2 and CH4 permeance as shown in (2):
αCO2 CH4
⁄ = (
PCO2
PCH4) (2)
D. Design of Experiment
In this work, a standard RSM design, CCD was applied to develop a polynomial regression equation in order to analyze the correlation between CMS membrane preparation to the
responses. CCD consists of 2n factorial runs, 2(n) axial runs and six centre runs, where n is the number of factors. The variables used were carbonization temperature (x1), thermal soak time (x2) and polymerization time (x3). These three variables together with their respective ranges were chosen based on the preliminary studies as given in Table I. For three variables; 8 factorial points, 6 axial points and 6 replicates at the center points were employed, indicating that altogether 20 experiments, as calculated from (3) [8]:
𝑁 = 2n+ 2n + n
c= 23+ 2(3) + 6 = 20 (3)
where N is the total number of experiments required.
TABLE I
INDEPENDENT VARIABLES AND THEIR CODED LEVELS
Variables (factors) Code Coded variable levels
-α -1 0 +1 +α
Carbonization
temperature, °C x1 300 400 600 800 900
Thermal soak time, h x2 0.25 1.00 2.50 4.00 4.75 Polymerization time, h x3 5.25 7.00 10.50 14.00 15.75
The centre points are used to determine the experimental error and the reproducibility of the data. The axial points are located at (±α, 0, 0), (0, ±α, 0) and (0, 0, ±α) where α is the distance of the axial point from centre and makes the design rotatable. In this study, α value was fixed at 1.5. The experimental sequence was randomized in order to minimize the effects of the uncontrolled factor. The two responses were CO2 permeance (Y1) and CO2/CH4 permselectivity (Y2). Each response was used to develop an empirical model which correlated the response to the preparation variables using a second-degree polynomial equation as given by (4):
Y=βo+β1x1+β2x2+β3x3+β12x1x2+β13x1x3+β23x2x3+β11x12+β22x22 +β33x32 (4)
where Y is the predicted response, βo the constant coefficient, β1, β2 and β3 are the linear coefficients, β12 , β13 and β23 are the interaction coefficients, and β11, β22 and β33 are the quadratic coefficients. The term x1, x2 and x3 are the coded values of the CMS membrane preparation variables.
E. Model Fitting and Statistical Analysis
The experimental data were analyzed using a statistical software Design Expert software version 6.0.6 (STAT-EASE Inc., Minneapolis, USA) for regression analysis to fit the second-degree polynomial equation and also for the evaluation of the statistical significance of the equations developed.
F. Characterization of the Optimized CMS Membrane
XRD pattern of the sample was recorded by X-ray diffractometer (Philips PW1729 X-Ray Generator with Philips PW 1820 diffractometer). The instrument was operated with Kα radiation with a wavelength of 1.54Ǻ, 44 kV and 100mA. The data were collected in a range of 0-90° with a step length of 2θ=0.02°. Based on the spectra, interlayer spacing (d002) in the samples can be calculated using Bragg equation as shown in (5):
where d002 is the interlayer spacing, θ is the diffraction angle and λ is the X-ray wavelength of 0.154nm. The functional group of the sample was characterized by using Fourier transform infrared (FTIR) spectroscopy (FTIR-2000, Perkin Elmer). The surface area, total pore volume micropore volume and pore size distribution of the sample were characterized by N2 (77 K) adsorption in Micromeritics ASAP 2020 volumetric adsorption apparatus. The surface area was determined using Branauer-Emmett-Teller (BET) equation. Dubinin-Radushkevich (DR) equation was used to calculate the micropore volume over a range of relative pressure of 1.1×10⁻⁵ to 0.02. The total pore volume (Vt) was obtained at a relative pressure of 0.99. Pore size distribution (PSD) was obtained from Horvath-Kawazoe (HK) analysis. Prior to measurement, the samples were degassed at 393K for 12 h in the degas pot of the adsorption analyser. Scanning electron microscopy (SEM) was used to characterized the morphology of CMS membrane (JSM-6460 LV, model JEOL). SEM images were examined using an accelerating voltage of 15kV. Transmission electron microscope (TEM) images were obtained with a Philips CM12 TEM with Document Version 3.2 image analysis. This instrument operates up to an accelerating voltage of 120 kV.
III. RESULTANDDISCUSSION A. Development of Regression Model Equation
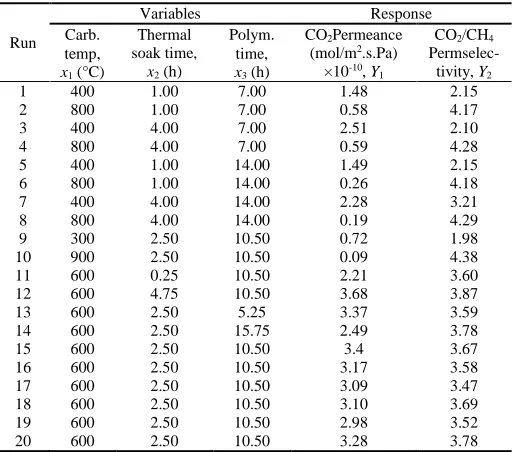
The complete design matrix for preparing CMS membranes and responses data are given in Table II. The CO2 permeance was found to range from 9.0×10⁻¹² to 3.68×10 -10mol/m2.s.Pa. The permeance trend shows low permeance at
low and high carbonization temperature. The highest permeance obtained by carbonization at mild condition. While for CO2/CH4 permselectivity, the response value was range from 1.98 to 4.38 with high permselectivity was obtained at high temperature.
TABLE II
DESIGN MATRIX FOR CMS MEMBRANES PREPARATION
Run
Variables Response
Carb.
temp, x1 (°C)
Thermal soak time,
x2 (h)
Polym.
time, x3 (h)
CO2Permeance (mol/m2.s.Pa)
×10-10, Y 1
CO2/CH4
Permselec-tivity, Y2
1 400 1.00 7.00 1.48 2.15
2 800 1.00 7.00 0.58 4.17
3 400 4.00 7.00 2.51 2.10
4 800 4.00 7.00 0.59 4.28
5 400 1.00 14.00 1.49 2.15
6 800 1.00 14.00 0.26 4.18
7 400 4.00 14.00 2.28 3.21
8 800 4.00 14.00 0.19 4.29
9 300 2.50 10.50 0.72 1.98
10 900 2.50 10.50 0.09 4.38
11 600 0.25 10.50 2.21 3.60
12 600 4.75 10.50 3.68 3.87
13 600 2.50 5.25 3.37 3.59
14 600 2.50 15.75 2.49 3.78
15 600 2.50 10.50 3.4 3.67
16 600 2.50 10.50 3.17 3.58
17 600 2.50 10.50 3.09 3.47
18 600 2.50 10.50 3.10 3.69
19 600 2.50 10.50 2.98 3.52
20 600 2.50 10.50 3.28 3.78
For both responses, quadratic model were suggested according to the sequential model sum of square. The final empirical formula model for CO2 permeance and CO2/CH4 permselectivity responses in term of coded factor are presented in (6) and (7), respectively:
𝑌1= 3.24 − 0.57𝑥1+ 0.32𝑥2− 0.18𝑥3− 1.39𝑥12−
0.26𝑥22− 0.26𝑥32− 0.24𝑥1𝑥2− 0.062𝑥1𝑥3−
0.04𝑥2𝑥3 (6)
𝑌2= 3.64 + 0.87𝑥1+ 0.13𝑥2+ 0.11𝑥3− 0.25𝑥120.0011𝑥22
−0.023𝑥32− 0.099𝑥1𝑥2− 0.14𝑥1𝑥3+ 0.14𝑥2𝑥3 (7)
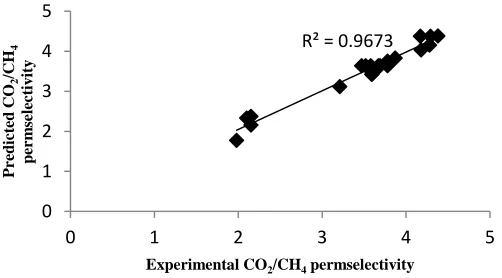
The quality of the models was evaluated based on standard deviation and correlated coefficient, R2 value. The capability of the model to predict the response is translated to small standard deviation and closer of R2 value to unity. The standard deviation of (6) and (7) were 0.45 and 0.19, respectively. The R2 for (6) and (7) were 0.9320 and 0.9673, respectively. These indicate that 93.2% and 96.73% of the total variation in the CO2 permeance and permselectivity, respectively were attributed to the experimental variables studied. These values were considered high as the value were close to unity and lead to small variation in CO2 permeance and CO2/CH4 permselectivity predicted from these models.
B. Analysis of variance
Analysis of variance (ANOVA) has been employed to further justify the significance of the models. For each response, the statistical significance of quadratic model was determined by F-value and Prob.>F. F-value is a measurement of variance of data about the mean, based on the ratio of mean square of group variance due to error. Significant model possesses high F-value and Prob.>F less than 0.05. The ANOVA for quadratic model of CO2 permeance and CO2/CH4 permselectivity were presented in Tables III and IV, respectively.
TABLE III
ANOVA FOR CO2 PERMEANCE OF CMS MEMBRANE
Source Sum of squares
Degree of freedom
Mean square
F
value Prob > F
Model 27.72 9 3.08 15.22 0.0001
x1 4.02 1 4.02 19.88 0.0012
x2 1.26 1 1.26 6.22 0.0318
x3 0.41 1 0.41 2.02 0.1857
x12 19.83 1 19.83 98.03 < 0.0001
x22 0.68 1 0.68 3.38 0.0959
x32 0.72 1 0.72 3.56 0.0887
x1x2 0.44 1 0.44 2.18 0.1702
x1x3 0.031 1 0.031 0.15 0.7025
TABLE IV
ANOVA FOR CO2/CH4 PERMSELECTIVITY OF CMS MEMBRANE
Source squares Sum of Degree of freedom square Mean value F Prob > F
Model 10.92 9 1.21 32.92 < 0.0001
x1 9.52 1 9.52 258.37 < 0.0001
x2 0.21 1 0.21 5.80 0.0368
x3 0.16 1 0.16 4.35 0.0637
x12 0.63 1 0.63 17.17 0.002
x22 0.00001 1 0.00001 0.0004 0.9853
x32 0.006 1 0.006 0.15 0.7044
x1x2 0.078 1 0.078 2.12 0.1764
x1x3 0.15 1 0.15 4.03 0.0725
x2x3 0.15 1 0.15 4.18 0.0682
For CO2 permeance, the model F-value of 15.22 and Prob>F was 0.0001 implied that the model was significant. In this case x1, x2 and x12 were significant model terms whereas x3, x22, x32, x1x2, x1x3 and x2x3 were insignificant model terms to the response. While for CO2/CH4 permselectivity quadratic model, the model F-value of 32.92 and Prob>F less than 0.0001 implied that the model was significant. The x1, x2 and x12 were significant model terms whereas x3, x22, x32, x1x2, x1x3 and x2x3 were insignificant model terms to the response. Based on the statistical result obtained, the model was adequate to predict the CO2 permeance and CO2/CH4 permselectivity within the range of variable studies. In addition, Figs. 1 and 2 show the predicted values versus the experimental values for CO2 permeance and CO2/CH4 permselectivity, respectively. It can be seen that the response models show good fits to the experimental data that reflected to good predictions of the models.
Fig. 1. Predicted value versus experimental value of CO2 permeance.
Fig. 2. Predicted value versus experimental value of CO2/CH4 permselectivity.
C. CO2 permeance and CO2/CH4 permselectivity Based on the Tables 3 and 4, the F-value show the carbonization temperature gives the greatest impact on both responses followed by thermal soak time and polymerization time. Figs. 3 and 4 show the three dimensional response surface which was constructed to show the interaction effect of the carbonization temperature and thermal soak time on CO2 permeance and CO2/CH4 permselectivity, respectively. For these plot, the polymerization time was fixed at zero level (t=10.5 h). At low carbonization temperature, the CO2 permeance was low, which contributed to the low CO2/CH4 permselectivity. This scenario was contributed by the formation of dead-end channel due to insufficient energy to break the polymer chain [9]. The CO2 permeance was increased with carbonization temperature until it reached maximum value around 600°C. However the CO2 permeance shows extreme reduction at higher carbonization temperature. Meanwhile CO2/CH4 permselectivity was increased at full range of carbonization temperature.
Fig. 3. Three dimensional response surface plot of CO2 permeance (Effect of carbonization temperature and thermal soak time, x3=10.5 h).
Fig. 4. Three dimensional response surface plot of CO2/CH4 permselectivity (Effect of carbonization temperature and thermal soak time, x3=10.5 h). R² = 0.932
0 0.5 1 1.5 2 2.5 3 3.5 4
0 1 2 3 4
Pr
ed
ic
te
d
C
O2
p
er
m
ea
n
ce
(m
o
l/
m
2.s.
Pa
)
×
10
-10
Experimental CO2permeance (mol/m2.s.Pa) ×10-10
R² = 0.9673
0 1 2 3 4 5
0 1 2 3 4 5
Pr
ed
ic
te
d
C
O2
/C
H4
p
er
m
sel
ec
ti
v
it
y
Fuertes and Centeno [10] have reported the same result for CMS membrane derived by phenolic resin. They have summarized the pores were initially developed at low carbonization temperature. Carbonization treatment at 800°C contributes to further pores development and lead to higher gas permeance. The selectivity was increased as well due to development of ultramicropore that restrict the large gas passage throughout the membrane [11]. Further carbonization at higher temperature caused the micropore to shrink and lead to permeance reduction.
D. Process optimization
It is necessary to find out the optimal point as a compromise between higher CO2 permeance and CO2/CH4 permselectivity values. The desirability function approach is one of the most widely used methods for optimization of multiple response processes. In this case, Design Expert software with desirability function was applied to compromise between both responses. The experimental conditions with the highest desirability together with the predicted and experimental result of both responses are presented in Table 5.
TABLE V MODEL VALIDATION
Carb
Temp (°C)
Therm soak time (h)
Polym time (h)
CO2 permeance (mol/m2.s.Pa) ×10-10
CO2/CH4 permselectivity
Pred. Act. Err.
(%) Pred. Act. Err. (%) 620 4.0 11.4 3.14 3.09 1.61 3.90 3.86 1.03
The optimum CMS membrane was obtained by using carbonization temperature, thermal soak time and polymerization time of 620°C, 4 h and 11.4 h, respectively. The optimum CMS membrane showed CO2 permeance and CO2/CH4 permselectivity of 3.09×10⁻¹⁰ mol/m2.s.Pa and 3.86 for CO2 permeance and CO2/CH4 permselectivity, respectively. The error for CO2 permeance and CO2/CH4 permselectivity were only 1.61% and 1.03%, respectively. The small error between the predicted and the actual values indicate the small deviation between the experimental value and the value predicted from the model.
E. Characterization of optimized CMS membrane
Fig. 5 illustrates the X-Ray Diffraction (XRD) pattern of CMS membrane carbonized at optimum condition.
Fig. 5. Diffraction pattern of optimized CMS membrane
The broad peak is corresponding to the amorphous structure of the sample. The peak at 2θ=23.2° is corresponding to (002) plane in non-graphitizing carbon [12]. The d002 was found to be 3.73Å. The second peak was observed at 2θ=44.2°, corresponding to (100) plane. The intensity of (100) plane was relatively low compared to (002) plane. The d-spacing of (100) was found to be 2.05Å. Same peak at (002) plane was found by Song et al. for CMS membrane derived from polyacrilonitrile at 450 to 950°C of carbonization. It proofs the tendency towards the formation of stacking structure of aromatic layer in turbostratic carbon [13]. At this stage, the chain was rearranged and the systemic pore network was formed due to carbonization treatment [14].
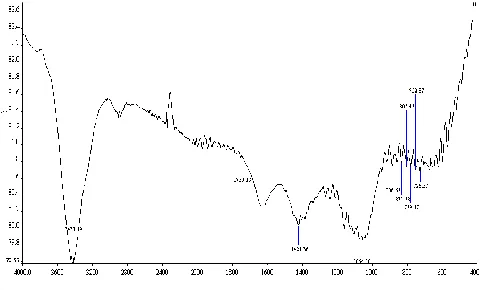
Peak at 1064, 1421 and in the range of 709 to 960 cm-1 were corresponding to the polyaromatic and various derivates of aromatic group in the carbon such as 1,2,4-trisubst.benzene, 1,3,5-trisubst. benzene, 1,2,3-trisubst. benzene, monosubst. benzene and m-disubst. benzene. Peaks appeared at 1750 and 3437 cm-1 indicate the formation of carbonyl group and hydroxyl group, respectively.
Fig. 6. Infrared spectrum of optimized CMS membrane.
Fig. 7. Morphology of CMS membrane; (a) cross section (b) surface.
Two layers of carbon films can be observed due to the double coating of CMS membrane to avoid pin-hole formation and micro crack as illustrated in Fig 7(a). The thickness of the carbon film was around 7µm. From Fig. 7(b), the CMS membrane surface was defect-free indicates that the membrane has good mechanical properties and can withstand swelling or drying conditions.
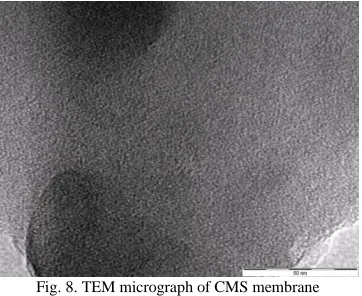
The microstructure morphology of CMS membrane was illustrated in Fig. 8. The “black” region corresponds to carbon matrix. Carbon matrix was tight and arranged randomly indicate the amorphous characteristic of CMS membrane. Meanwhile the “white” region considered to be the microvoid of CMS membrane. The cavity was formed because of the misalignment of carbon matrix.
Fig. 8. TEM micrograph of CMS membrane
The microvoid creates the ultramicroporosity of CMS membrane which was formed by channelling of evolved gas through PFA matrices during carbonization [15]. The pore size
was found to be less than 1 nm, which suitable for gas permeation test.
IV. CONCLUSIONS
The effects of carbonization temperature, thermal soak time and polymerization time on CO2 permeance and CO2/CH4 permselectivity were successfully studied by using CCD. Two quadratic models were developed to correlate the preparation variables to the two responses. Carbonization temperature was found to be the most significant effect on both responses. In contrast, the polymerization time was insignificant on both responses. Optimum preparation conditions of CMS membrane were 620 °C, 4 h and 11.4 h for carbonization temperature, thermal soak time and polymerization time which resulted 3.09×10⁻¹⁰ mol/m2.s.Pa and 3.86 of CO2 permeance and CO2/CH4 permselectivity, respectively.
REFERENCES
[1] Y. Xiao, B.T. Low, S.S. Hosseini, T.S. Chung, D.R. Paul, “The strategies of molecular architecture and modofocation of polyimide-based membranes for CO2 removal from natural gas-A review”, Progr. Polymer Sci., 34, 2009, 561-580.
[2] X. Wang, “The state-of-the-art in natural gas production”, J. Natural Gas Sci. Eng., 1, 2009, 14-24.
[3] M. Safari, A. Ghanizadeh, M.M.M. Rahmati, “Optimization of membrane-based CO2-removal from natural gas using simple models considering both pressure and temperature effect”, Int. J. Greenhouse Gas Contr., 3, 2009, 3-10.
[4] A.K. Datta, P.K. Sen, “Optimization of membrane unit for removing carbon dioxide from natural gas”, J. Membr. Sci., 283, 2006, 291-300. [5] S.P.J. Smith, V.M. Linkov, R.D. Sanderson, L.F. Petrik, C.T.
O’Connor, K. Keiser, “Preparation of Hollow fibre composite carbon-zeolite membrane”, Micropor. Mater. Mater, 4, 1995, 385-390. [6] A.F. Ismail, L.I.B David, “Future direction of R&D in carbon
membranes for gas separation”, Membr. Techn., 2003, 4-8.
[7] Y.F. Yeong, A.Z. Abdullah, A.L. Ahmad, S. Bhatia, “Process optimization studies of p-xylene separation from binary xylene mixture over silicalite-1 membrane using response surface methodology”, J. Membr. Sci., 341 (2009) 96-108.
[8] M.A. Ahmad, R. Alrozi, “Optimization of preparation conditions for mangosteen peel-based activated carbons for the removal of Remazol Brilliant Blue R using response surface methodology”, Chem. Eng. J., 165, 2010, 883-890.
[9] L.I.B. David, A.F. Ismail, “Influence of the thermostabilization process and soak time during pyrolysis process on the polyacrylonitrile carbon membranes for O2/N2 separation”, J. Membr. Sci., 213 (2003), 285-291.
[10] A.B. Fuertes, T.A. Centeno, “Carbon molecular sieve membranes from polyetherimide”, Micropor. Mesopor. Mater., 26 (1998), 23-26. [11] S. Lagorsse, F.D. Magalhaes, A. Mendes, “Carbon molecular sieve
membranes: Sorption, kinetic and structural characterization”, J. Membr. Sci., 241, 2004, 275-287.
[12] C.J. Anderson, S.J. Pas, A. Arora, S.E. Kentish, A.J. Hill, S.I. Sandler, G.W. Stevens, “Effect of pyrolysis temperature and operating temperature on the performance of nanoporous carbon membranes”, J. Membr. Sci., 322 (2008) 19-27.
[13] C. Song, T. Wang, Y. Qiu, J. Qiu, H. Cheng, “Effect of carbonization atmosphere on the structure changes of PAN carbon membranes”, J. Porous Mater., 16, 2009, 197-203.
[14] S.S. Tzeng, Y.G. Chr, “Evolution of microstructure and properties of phenolic resin-based carbon/carbon composites during pyrolysis”, Mater. Chem. Phys., 73, 2002, 162-169.