Aspects of Hydrology, Tidal and Water Storage
Capacity For Simulating Dike Model of Channel and
Retention Basin
S. IMAM WAHYUDI
1,HENNY PRATIWI A.
1, ABDUL ROCHIM
1AND DIDIER MAROT
21
Department of Civil Engineering, Faculty of Engineering, Sultan Agung Islamic University, (UNISSULA), Semarang, Indonesia
2
Institute de Recherche en Genie Civil et Mechanique (GEM), IUT de Saint Nazaire, Univesité de Nantes, Nantes, France
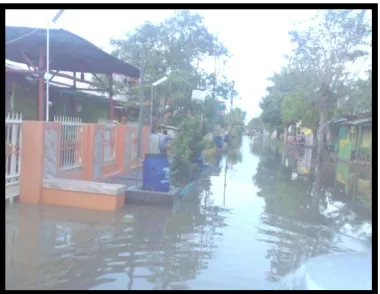
Abstract-- Tidal flood occurred in some cities in the northern coast of Central Java, Indonesia among others Semarang and Pekalongan. Special for Pekalongan, it has a population of 273,900 people with an area of 4,525 hectares, but 1,920 hectares is inundated by tidal flood. Tidal flood occurs because the sea level is higher than its land. This case has begun 10 years ago and continues to evolve to this day. The cause of the tidal flood is sea level rise, land subsidence and land use changed. Method of handling this problem is done by dividing into 7 sub-drainage system, 2 systems using gravity flow, while 5 other sub-systems using Polder system. This article aims to obtain hydrological analysis and tidal analysis, hydraulics for the dike of channel and retention pond in polder system. The principle of polder system drainage is to isolate an area of the seawater, so it is necessary to remove water pumping. Polder system infrastructure that is needed is a drainage system, retention ponds, dikes, weirs and pump stations.
Index Term--Tidal Flood, hydrologic, Tide, Dike
I. INTRODUCTION
Pekalongan is one of the important cities in Central Java Province.Pekalongan is a city government, industrial city (batik and convection), city production of fisheries and aquaculture. The total area of Pekalongan is 4,525 Ha. The rapid development of the city makes changes to land use and necessity of city infrastructure is increasing rapidly.
Pekalongan located in low-lying northern coast of Java Island; with a height of approximately 1 meter above sea level and ground level tend to be flat.In the north part of its surface is lower than sea level, so the water flowing into the sea is difficult for even the most territory is inundated by water when the tide occurs (Wahyudi, S, Imam, 2010).
Inundation occurs because local rainfall, runoff flooding from rivers and during high tides (rob).Floods in Pekalongan inundate nine villages in three districts; they are North Pekalongan, West Pekalongan and East Pekalongan, or 25 percent of the city area. The location of the inundation is including hundreds of homes, roads and productive land such as rice fields, plantations, batik industry and other activities of citizens. The puddle causes interference itching skin disease on society.
The purpose of this study is to analyze the parameters of hydrology, hydraulics, tides, the capacity of the channel and an embankment on the basis of the modeling of the channel and retention pond.
The method used in this study includes collection data of regional rainfall and tidal. Then analyzing the hydrological, hydraulics and tides aspects.Previous studies to determine the condition of an inventory of drainage area and inundation, is done by tracking the drainage (sewer) existing and record and / or make a sketch of the required drainage and existing buildings. Inundation inventory conducted with interviews community leaders or expert. Data collected include the location of an inundation, the frequency of inundation, depth of inundation, duration of inundation and the effect felt by the community.
II. RESEARCH AREA
Fig. 1. Illustration of the tidal flood (rob) in Pekalongan
III. HYDROLOGICAL ANALYSIS
Hydrological analysis is made based on rainfall data and catchment area.The analysis was performed to get a discharge plan that is calculated from rainfall with a certain return period. In the continuous process of hydrological analysis are as follows: Rainfall data obtained from secondary data collection by taking the nearest rain stations. Based on rainfall data for more than 10 years. Rainfall station nearest the location of work is Pekalongan Station No. 111, Station Kuripan Kidul Medono Station No. 122 and 123.Rainfall data is processed to obtain the maximum daily rainfall intensity. Then the maximum daily rainfall annual three done by finding the maximum rainfall of daily rainfall data for each year of rainfall recording station for ten years. Based on maximum rainfall values then calculated the average of the maximum amount of rainfall. The following table is an example of the maximum daily rainfall at one rainfall station.
TABLE I
DAILY MAXIMUM RAINFALL
Years
Station No.111 PEKALONGAN
(x
1)
1994
132
1995
101
1996
192
1997
107
1998
106
1999
215
2000
122
2001
98
2002
102
2003
105
2004
125
2005
103
2006
236
2007
285
2008
99
2009
490
2010
265
2011
282
2012
233
2013
189
Rainfall plans estimation made with 3 (three) methods, they are Gumbel, Log Pearson Type III and Rational. Each of these methods to use statistical parameters including mean, standard deviation, coefficient of variation and coefficient of skewness (Ratna Musa et al., 2014). The
following table is recapitulation of the analysis of calculation rainfall in three methods.
TABLE II
RECAPITULATION OF RAINFALL PLAN CALCULATION
Drainage service area is the extent of the area where the water is discharged through the channels of drainage to the environment of this collector. The total area is measured from the scale map of the area with the help of the Autocad program in accordance of catchment area.
Then the drainage discharge is from analysis of the rainfall (M. Ruslin Anwar, 2011). By assumption, this drainage is in the urban area. So that infiltration is considered almost non-existent and there are no inundation permitted. The amount of evaporation is considered zero because the rain is usually not hot air condition.
Calculation formula for drainage discharge using the Rational Method
Q = I x A x C x Cs (1)
where:
Q = discharge flood peaks on designing in T-year Period (l / sec), which occurs in the estuary watershed
I = rainfall intensity (l / detik.ha)
A = Area of watershed (ha)
C = coefficient streaming
C s = coefficient Retention
To calculate the drainage discharge is used return period (n) 5 years to obtain a discharge with a 5-year return period (Q5). Here's an example of the calculation that
described drainage discharge from one of the sub-systems. Based on the data Rplan for 5 years of return period from
Rational method obtained 130 mm / day were subsequently
converted to obtain the rainfall intensity data at 15.05 lt / dt.ha. By entering the drainage coefficient of 0.9 and a retention coefficient is taken as 0.8 (residential and urban areas) also extensive drainage services that have been computed at 230 ha, then the process flow according to the method of rational calculation can be determined by multiplying the parameters. The discharge of drainage for 5 years return periods is:
Q 5 = 0.9 x 0.8 x 15.05 x 230
= 1646.67 liters / sec = 1.65 m 3 / sec
Analogs to the description above for the calculation of other drainage discharge plan (Q) of each drainage channel made tables presented in Table III.
TABLE III
DRAINAGE DISCHARGE CHANNELS
IV. ANALYSIS OF TIDAL ELEVATION
Tidal influence on the system in the study area. At the time of tide water level low areas will be inundated by tidal water from entering through the channel estuary and river, especially with rain, the flooding will be hampered into the sea because of high sea level (Arnoud Molenaar, 2008). Observation of tidal sea level aims to determine the nature of tidal heights by making direct measurements of sea level during the 30 (thirty) consecutive days on job sites with wearing the board / peilschal. Observations / sea level readings on the board performed each interval of 60 minutes.
Furthermore, based on the components of tidal elevation predicted tide for 30 days in accordance with the observation time. Forecasting results compared with observations in the field to see its suitability. Here are the results of the tidal analysis in the study area.
Return Period (Year's)
Gumbel method(M
m)
Log Pearson method(
Mm)
Rational Method
(Mm)
CR plan
(Mm)
2 167.0 180.00 88.0 0 88.00
5 206.0 204.00 130.00 130.00
10 231.0 212.00 156.00 156.00
20 255.0 215.00 169.00 169.00
25 263.0 217.00 176.00 176.00
50 287.0 219.00 214.00 214.00
Luas Layanan Q 2th Q 5th
(Ha) m3
/dt m3
/dt
1 3 4=CxCsxIx1/1000 5=CxCsxIx1/1000
I
1 1.1 D. Banyuurip 307 2,25 3,33
2 1.2 D. Boyolangu 173 1,27 1,87
3 1.3 D. Bina griya 111 0,81 1,20
4 1.4 D. Podosugih 417 3,06 4,52
1.117 7,39 10,92
II
1 2.1 D. Kandang Panjang 230 1,32 2,86
2 2.2 D. Perintis Kemerdekaan Ka 48 0,28 0,60
3 2.3 61 0,35 0,76
4 2.4 D. Pabean 152 0,87 1,65
5 2.5 D. Patriot Ka 42 0,24 0,52
6 2.6 D. Patriot Ki 53 0,30 0,66
7 2.7 D. Bandengan 165 0,95 2,05
8 2.8 D. Kranding 93 0,54 1,16
9 2.9 D. Krematorium 101 0,74 1,25
10 2.10 D. Penggelontoran Kota 325 1,87 4,04
11 2.11 D. Jeruksari 28 0,16 0,35
1.083 7,63 15,88
D. Perintis Kemerdekaan Ki
No Kode
2
Nama Saluran Drainase
TOTAL LUAS SUB SISTEM SUB SISTEM BREMI
SUB SISTEM BANDENGSARI
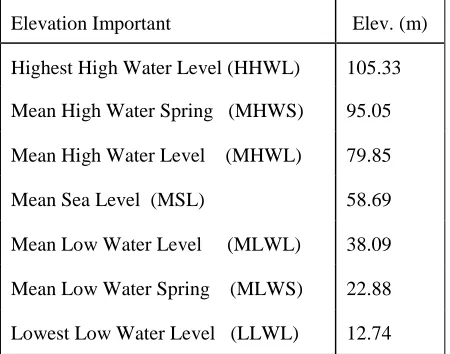
TABLE IV
RESULTS OF THE ANALYSIS OF TIDAL ELEVATION
Elevation Important Elev. (m)
(cm) Highest High Water Level (HHWL) 105.33
Mean High Water Spring (MHWS) 95.05
Mean High Water Level (MHWL) 79.85
Mean Sea Level (MSL) 58.69
Mean Low Water Level (MLWL) 38.09
Mean Low Water Spring (MLWS) 22.88
Lowest Low Water Level (LLWL) 12.74
From reference of the tidal elevations above Zo obtained by + 58.69 cm were used as reference zero elevation to the other. Further elevation of ± 0,00 tied to a reference elevation and converted giving a reference elevation in planning channel basis.
V. D
IKE OFC
HANNEL ANDR
ETENTIONP
ONDA
NALYSISThe current drainage conditions have not all form a good drainage system, so it needs to be improved in the preparation of the layout of the existing drainage system. Preparation of layout of drainage system based on the following matters: plan drainage lines cultivated using the channel / river that already exist, All the city roads improved drainage of the road into a drainage area, drainage channels with each other made to form a drainage network (drainage system). Plan for new drainage path is chosen such that minimal land use and does not pass through the middle of the settlement but still consider the technical rules, land elevation in some locations is lower than sea level, retention pond system water discharged into the sea by a system of pumps and automatic gates.
The amount of discharge of each drainage channel is calculated based on the total area of drainage services. The amount of discharge of each drainage scheme presented in the form of discharge channels for understanding and implementation to the future. Scheme of drainage channels can be seen in Figure 2 below.
Fig. 2. Schematic of a polder drainage sub-system in Pekalongan City
VI. CAPACITY ANALYSIS OF RETENTION POND (BASIN) Retention basin serves as a reservoir of water from drainage channels before pumping into the sea. In this system there are 3 sub drainage channels, which also functioned as the storage of long channels (Anne L. Breton et Al., 2008). Some principles in the analysis of the capacity retention pond is:
Reservoir volume = Inlet Volume - Outlet Volume
Difference of inlet and outlet flow is reservoir volumechange
The formula is used:
Where:
Q in = Water entering to the reservoir (m 3 / sec) P = Pump capacity of (m 3/sec)
ds / dt = rate of change of reservoir deposits
For the time interval t, the equation of reservoir flood can be written
In order to simplify the matter of a simplified form:
D. PATRIOT Ka
D. JERUKSARI D . P A B E A N D . P E N G . K O T A D . P E R IN T IS K . K a D . P E R IN T IS K . K i D . K R A N D IN G D . B A N D E N G A N D . K A N D A N G P A N J A N G LAUT JAWA Sta. Pompa Renc. Tanggul/Jalan
Renc. Jalan Lingkar
A = 230 Ha Q = 2.86 m3/dt
L = 2.470 m
A = 95 Ha Q = 4.04 m3/dt
L = 4.440 m A = 53 Ha
Q = 0.66 m3/dt
L = 1.290 m A = 42 Ha Q = 0.52 m3/dt L = 1.230 m
A = 53 Ha Q = 0.76 m3/dt L = 1.050 m A = 152 Ha
Q = 1.65 m3/dt
L = 840 m A =2.11 Ha Q = 0.35 m3/dt
L = 400 m A = 528 Ha Q = 1.16 m3/dt
L = 2.223 m
A = 165 Ha Q = 2.05 m3/dt L = 2.782 m
Atandon= 6 Ha
Qinlet = 15.99 m3/dt
Q pompa= 1 m3/dt
D. PATRIOT Ki
Ket : Rencana pompa 4 buah
RUAS 1
Qoutlet = 4 m3/dt
Kolam Retensi t) P 0.5 (S t) 0.5P (S t 2) Q 1 (Q
The equation used as the basis of the simulation, as the results in Table V below.
TABLE V
RESULTS OF SIMULATION CAPACITY OF RETENTION BASIN
Based on the simulation results in the table above of required flood discharge hydrograph, pump capacity and volume of retention pool.Then examined freeboard generated in the simulation. The freeboard is used to determine the dimensions and models of the dike.
CONCLUSION
To create a model of dikes Eco hydraulics in the drainage system of Polder requires hydrologic analysis, the tidal and retention pond capacity. The parameters needed to construct dike on the channel and retention pond. The new model dike will be a research perspective.
ACKNOWLEDGEMENTS
A big thank you is directed at all those who helped this research. Among them are Ditlitabmas Dikti, academic community of UNISSULA Semarang and government of Semarang City and Pekalongan City, as well as our research partner from Universite de Nantes, France.
REFERENCES
[1] Anne L Breton et Eric Beaudet, 2008, L'utilisation des terreaux en
horticulture et la rehabilitation des tourbieres, L'echo des tourbieres, no 15.
[2] Arnoud Molenaar, 2008, Rotterdam Waterplan transition in urban water
management, Public Works, Water Management Dept., March 2008, Rotterdam
[3] Helmer Johan et al., 2009, Rotterdam Polder System and Plan of K.
Banger Polder in Semarang, Waterboard HHSK Rotterdam
[4] M. Ruslin Anwar, 2011, The Rainfall-Rainoff Model Using of The
Watershed Physical Charactristic Approach, Internasional Journal of
Civil & Environmental Engineering, IJCEE-IJENS, ISSN 2077-1258, Vol:11 No:6, December 2011, p71-75
[5] Ratna Musa, Muhammad Saleh Pallu, Lawalenna Samang, Mukhsan
Putra, 2014, Experimental Study of Hydrograph Model of Catchment Area Based on Regoinal Characteristic, Internasional Journal of Civil & Environmental Engineering, IJCEE-IJENS, ISSN 2077-1258, Vol:14 No:03, June 2014. P11-16
[6] Wahyudi, 2010, Pengembangan Sistem Polder Untuk Penanganan Banjir
Rob Akibat Kenaikan Muka Air Laut dan Penurunan Tanah, UNISSULA, ISBN 978-602-8420-36-5.
[7] Wahyudi S., Imam, Moh. Faiqun Ni’am, Gilbert Le Bras, 2012, Problem,
Causes and Handling Analysis of Tidal Flood, Erosion and Sedimentation in Northern Coast of Central Java, Internasional Journal of Civil & Environmental Engineering, IJCEE-IJENS, ISSN 2077-1258, Vol:12 No:4, August 2012, p65-69
[8] Wahyudi, S. Imam, Gilbert Le Bras, Henny Pratiwi Adi, 2011, Issues,
Methods and Institutional Management to Overcome Tidal Flood in La Brier (France), Rotterdam (Netherlands) and Perspecties in Semarang
(Indonesia), The 25th ICID European, 16-20 May 2002, Groningen, The
Netherlands.
Slamet Imam Wahyudi is a Professor of Civil Engineering at Sultan Agung Islamic University (UNISSULA) Semarang Indonesia. He obtained B. Eng in Civil Enginering from Diponegoro University Semarang Indonesia, DEA and Doctor in Civil Eng. from EC. Nantes,& Univ. de Nantes, France, 1995 & 1998.
Henny Pratiwi Adi is a Senior Lector of Civil Engineering at Sultan Agung Islamic University (UNISSULA) Semarang Indonesia. She obtained B. Eng in Civil Enginering from UNISSULA Semarang Indonesia, Master from Univ. Atmajaya and Doctor in Civil Eng. from Univ. Diponegoro, Semarang, Indonsia.
Abdul Rochim is a Lector of Civil Engineering at Sultan Agung Islamic University (UNISSULA) Semarang Indonesia. He obtained B. Eng in Civil Enginering from UNISSULA Semarang Indonesia, Master from Institut Teknologi Bandun and Doctor Student in Civil Eng. from Univ. de Nantes, France (in present)
Didier MAROT is a Professor of Civil Engineering at Univ. de Nantes, France. He obtained Doctor in Civil Eng. from EC. Nantes,& Univ. de Nantes, France, 1998.
Routing Time Q flood Pump 0,5 Pt El.
Pond Freeboard Periods (hour) (m3/s) (m3/s) (m3) (cm) (m)
0 0 0
1 1 38.821 4 7200 -2.5 2.80
2 2 10.340 4 7200 -1.265 1.57
3 3 7.191 4 7200 -0.979 1.28
4 4 5.706 4 7200 -0.832 1.13
5 5 4.828 4 7200 -0.756 1.06
6 6 0.041 4 7200 -0.850 1.15
7 7 0.019 4 7200 -1.088 1.39
8 8 0.010 4 7200 -1.328 1.63
9 9 0.006 4 7200 -1.567 1.87
10 10 0.004 4 7200 -1.807 2.11
11 11 0.003 4 7200 -2.047 2.35