SOCIO-DEMOGRAPHIC PROFILE AND TIME
ICTC CLINIC OF A TERTIARY CARE HOSPITAL OF WEST BENGAL, INDIA
Supratik Roy
KPC Medical College & Hospital, Kolkata, West Bengal, India
A R T I C L E I N F O
INTRODUCTION
HIV continues to be a major global public health issue, having claimed more than 35 million lives so far. In 2016, 1.0 million people died from HIV-related causes globally[1]. In 2016, an estimated 36.7 million people were living with HIV (including 1.8 million children) – with a global HIV prevalence of 0.8% among adults[2]. Around 30% of these same people do not know that they have the virus[2]. This modern
still a major issue as far as morbidity and mortality are concerned. So, prevention still remains the only best remedy for this dreaded disease.
Now, coming to India, the adult HIV prevalence at national level has continued its steady decline from an estimated peak of 0.38% in 2001-03 through 0.34% in 2007 and 0.28% in 2012 to 0.26% in 2015[3]. Though HIV prevalence in India is declining but low penetration of Information, Educati Communication (IEC) activities is still a matter of concern. Integrated Counseling and Testing Centres (ICTC’s) are key entry points for a wide range of interventions in HIV awareness, detection, prevention and care in India. HIV counseling and testing services were started in India in 1997.
International Journal of Current Advanced Research
ISSN: O: 2319-6475, ISSN: P: 2319-6505,
Available Online at www.journalijcar.org
Volume 7; Issue 5(G); May 2018; Page No.
DOI: http://dx.doi.org/10.24327/ijcar.2018
Copyright©2018 Supratik Roy and Kunal Kanti Majumdar
License, which permits unrestricted use, distribution, and reproduction in any medium, provided the original work is properly
Article History:
Received 20th February, 2018 Received in revised form 20th March, 2018 Accepted 8th April, 2018 Published online 28th May, 2018
Key words:
ICTC, Seropositive, HIV, socio-demographic profile, time-series analysis.
*Corresponding author: Kunal Kanti Majumdar
KPC Medical College & Hospital, Kolkata, West Bengal, India
DEMOGRAPHIC PROFILE AND TIME-SERIES ANALYSIS OF SEROPOSITIVES ATTENDING
ICTC CLINIC OF A TERTIARY CARE HOSPITAL OF WEST BENGAL, INDIA
Supratik Roy and Kunal Kanti Majumdar*
KPC Medical College & Hospital, Kolkata, West Bengal, India
A B S T R A C T
Background: Integrated Counseling and Testing Centres
range of interventions in HIV awareness, detection, prevention and care in India especially in a situation when 30% of those infected with the virus globally are unaware of their seropositive status. The objective of this study was to assess the socio
and time-series analysis of seropositive attendees at a selected ICTC.
cross-sectional record based study was done for the period January’11 to December’15 wherein information regarding 6798 attendees of the ICTC of KPC Medical College & Hospital, Kolkata, India were collected and analyzed.
133(1.96%) tested positive for HIV with a male to female ratio of about 3:1 and Tuberculosis (44.36%) as a major co-morbidity. Overall, the seropositivity rate gradually increased over the period from 1.78% (2011) to 2.26% (2015) but surprisingly the predicted seropositivity rate for the year 2016 showed a lower rate of 1.99%. 31 age group showed maximum seropositivity (36.09%) and unprotected heterosexual route was the commonest (61.65%) mode of infection.78% of spouses of seropositives were found to be HIV positive. Conclusion: This study showed a rising trend of seropositivity rate during the study period which indicates the need for continuous interventional measures.
HIV continues to be a major global public health issue, having lives so far. In 2016, 1.0 million related causes globally[1]. In 2016, an estimated 36.7 million people were living with HIV (including with a global HIV prevalence of 0.8% same people do not know that they have the virus[2]. This modern pandemic is still a major issue as far as morbidity and mortality are concerned. So, prevention still remains the only best remedy
IV prevalence at national level has continued its steady decline from an estimated peak 03 through 0.34% in 2007 and 0.28% in 2012 to 0.26% in 2015[3]. Though HIV prevalence in India is declining but low penetration of Information, Education and Communication (IEC) activities is still a matter of concern. Integrated Counseling and Testing Centres (ICTC’s) are key entry points for a wide range of interventions in HIV awareness, detection, prevention and care in India. HIV ing services were started in India in 1997.
As on 31st August 2016, there are 20,756 ICTCs in India[3]. An ICTC is a place where a person is counseled and tested for HIV, of his own free will or as advised by a medical practitioner. So, voluntary cou
centres could be considered one of the cost
reducing HIV transmission in developing countries like India. And, coming to West Bengal, as per the recent statistics[4], though the prevalence is showing a steady
being 0.21% [4] but still the number of people living with HIV(PLHIV) in the state covers 6%[4] of the total PLHIV in India. So, in the face of this changing scenario, this study to assess the socio-demographic profile of seropositives w of immense importance to the policy
stakeholders in bringing about the change that is the need of the hour. Additionally, time-series analysis was done to assess the trend of the disease in the near future.
MATERIALS AND METHODS
Study Design – Cross-sectional study based on record
analysis.
Study Setting – This study was conducted in the ICTC of KPC
Medical College & Hospital (KPC MCH) of Kolkata, West Bengal, India.
StudyPeriod – January 2011 to December 2015 i.e. a span of
5years.
International Journal of Current Advanced Research
6505, Impact Factor: 6.614
www.journalijcar.org
; Page No. 12692-12696
//dx.doi.org/10.24327/ijcar.2018.12696.2240
Supratik Roy and Kunal Kanti Majumdar. This is an open access article distributed under the Creative Commons Attribution License, which permits unrestricted use, distribution, and reproduction in any medium, provided the original work is properly
Kunal Kanti Majumdar
KPC Medical College & Hospital, Kolkata, West Bengal,
SERIES ANALYSIS OF SEROPOSITIVES ATTENDING
ICTC CLINIC OF A TERTIARY CARE HOSPITAL OF WEST BENGAL, INDIA
Integrated Counseling and Testing Centres (ICTC’s) provide for a wide range of interventions in HIV awareness, detection, prevention and care in India especially in a situation when 30% of those infected with the virus globally are unaware of their was to assess the socio-demographic profile series analysis of seropositive attendees at a selected ICTC. Methodology: A sectional record based study was done for the period January’11 to December’15 ees of the ICTC of KPC Medical College & Hospital, Kolkata, India were collected and analyzed. Result: Among 6798 attendees, 133(1.96%) tested positive for HIV with a male to female ratio of about 3:1 and all, the seropositivity rate gradually increased over the period from 1.78% (2011) to 2.26% (2015) but surprisingly the predicted seropositivity rate for the year 2016 showed a lower rate of 1.99%. 31-40years ) and unprotected heterosexual route (61.65%) mode of infection.78% of spouses of seropositives were This study showed a rising trend of seropositivity need for continuous interventional
August 2016, there are 20,756 ICTCs in India[3]. An ICTC is a place where a person is counseled and tested for HIV, of his own free will or as advised by a medical practitioner. So, voluntary counseling and testing at these centres could be considered one of the cost-effective ways of reducing HIV transmission in developing countries like India. And, coming to West Bengal, as per the recent statistics[4], though the prevalence is showing a steady decline, presently being 0.21% [4] but still the number of people living with HIV(PLHIV) in the state covers 6%[4] of the total PLHIV in India. So, in the face of this changing scenario, this study to demographic profile of seropositives will be of immense importance to the policy-makers and other stakeholders in bringing about the change that is the need of series analysis was done to assess the trend of the disease in the near future.
MATERIALS AND METHODS
sectional study based on record
This study was conducted in the ICTC of KPC & Hospital (KPC MCH) of Kolkata, West
January 2011 to December 2015 i.e. a span of
Research Article
Study Population – All clients of the ICTC of KPC MCH during the study period(n=6798).
Sampling Technique – Complete enumeration of all clients
who attended the ICTC of KPC MCH during the study period (January 2011 to December 2015) were considered.
DataCollection -- All data pertaining to the above mentioned
period were collected from Patient Information Details (PID) register and other relevant registers with the help of a structured proforma prepared from Operational Guidelines for ICTC by NACO maintaining strict anonymity of the clients. All records were cross-checked and validated from different registers.
Data Analysis – The data were analyzed and two softwares
namely R software version 3.4.2 and SPSS (Statistical Package for Social Sciences) version 22.0 were used. Z-test and Chi-square tests were performed where applicable at 5% level of significance. For statistical analysis, two important concepts that were used are:
Missing Data Analysis
Wherein the two missing values in the record were calculated by Mean Imputation method from the remaining data in the records.
ARIMA model (Auto-Regressive Integrated Moving Average) of degree AR(1) and MA(1) have been used to model the time series dependence.
To model the time series dependence, ARMA(1,1) model have been used as because i) the scatter plot shows the data being too scattered, so simple trend analysis could not be done and ii) this is also a predictive model. The analysis has been carried out by fitting the mathematical trend equation“ yt = α + βyt-1 + et + γet-1” where ‘yt’ denotes percentage of HIV positive cases, ‘t’ denotes the time-points (months) during the study period 2011-15, α is the intercept, e is the random error and β, γ are co-efficients of AR(1) and MA(1) respectively (Table 1).
Table 1 Time-series analysis using ARMA(1,1)
log likelihood = -90.21, aic = 188.41
These are the indicators of model performance which indicate that this model is the best out of all other models. So, the final fitted model is:
yt = (1.9231) + (0.6755) yt-1 + et + (-1.0000)et-1
From the above equation, it can be seen that the time-series yt denoting seropositivity rate depends on the previous time points and as β and γ are not close enough to zero, so the value of yt will never be only the mean value (i.e. α) and will keep varying with time (t). So, the ARMA model has been fitted for accurately predicting the future seropositivity rates based on the past records.
RESULTS
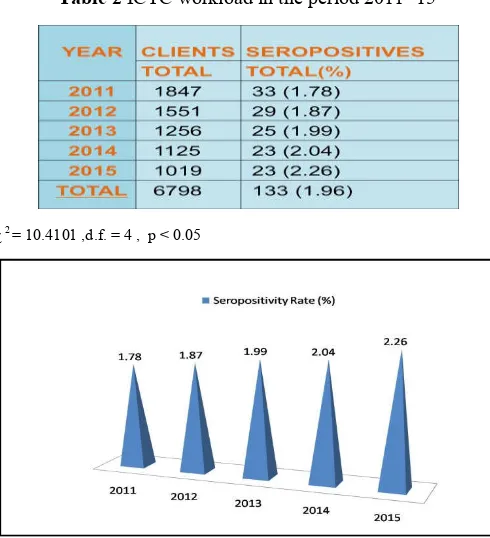
There were total 6798 clients of the ICTC of KPC Medical College & Hospital, Kolkata in the period from 2011 to 2015 of which 133(i.e. 1.96%) came out to be seropositive. The total number of clients attending the clinic showed a steady decline over the period of 5years i.e. from 1847 in the year 2011 to 1019 in the year 2015 but surprisingly the seropositivity rate showed a steady increase over the period from 1.78% in 2011 to 2.26% in 2015. (Table 2, Fig 1).
Table 2 ICTC workload in the period 2011- 15
χ 2 = 10.4101 ,d.f. = 4 , p < 0.05
Fig 1 Seropositivity rate among the clients during the period 2011-15
Table 3 Sex distribution of clients and seropositives
Bengal, India
Table 4 Annual seropositivity rate at the study ICTC according to gender
However, the difference in seropositivity rate between males and females was not found to be significant (p > 0.05) (Table 4).
Clients referred from DOTS clinic accounted for the highest number (44.36%) of seropositives (Fig 2). Surprisingly, all these seropositives were also found to have confirmed tuberculosis upon cross-checking of the referral records. From among the 133 seropositives, 25.57% underwent healthcare provider initiated HIV testing (i.e.prescribed by a doctor) and 21.05% walked in directly.
Table 5 Demographic, socio-economic and transmission route profiles of HIV positives
About 36% of total seropositives belonged to 31-40years age group followed by 26% from >40 years age group. It was observed that majority of seropositives (65.41%) had education upto primary level. Regarding occupation, 31.58% were involved in some kind of business followed by daily labour (23.31%), salaried employment (21%) and housewives (16.5%). Seropositivity was highest (66.17%) among the married and lowest (09.02%) among those separated or divorced. Majority of seropositives were from urban setting (54.1%). Heterosexual route was found to be the most common route of transmission (61.65%) among our seropositive clients whereas transmission through blood and blood products (04.51%) was found to be of least significance (Table 5). Transmission from parent to child was seen in 7.52% of cases.
Table 6 HIV status of spouse (n=32)
About 36.4% of the spouses of seropositives consented to be tested for HIV. Majority (78.13%) of the tested spouses were found to be HIV positive (Table 6).
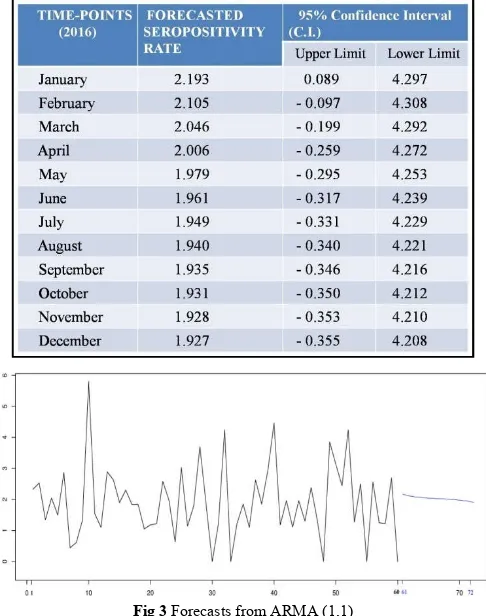
Dependence is very common in time series observations. ARMA(1,1) model has been used for this time-series analysis and for predicting the serpositivity rates for the next 12 months of the ensuing year 2016 (Table 7, Fig. 3). The final forecasted seropositivity rate for 2016 came out to be 1.99%.
Table 7 Forecasted seropositivity rates for the year 2016
In this graph (Fig 3), x-axis denotes the time points 1-72 where 1-60 refers to the time-points(60 months) during the 5-years’ study period and 61-72 refers to the forecasted period(i.e. 2016) while y-axis denotes the seropositivity rates. Here, it can be seen that although the seropositivity rates during the study period shows frequent fluctuations but the predicted seropositivity rates for the future time-points shows very little fluctuation (which is probably because the seasonal, cyclic, etc fluctuations have been filtered during the forecast) with a slight declining pattern over the months.
DISCUSSION
This study was intended to give an overview of profile of seropositive clients who visited our ICTC. The number of male clients attending the clinic clearly outnumbered the females by a ratio of about 3:1 which is in conformity with our male-dominated Indian society. Such male predominance was also observed by other studies such as those by Singh H R [5] and Z Ahmed [6]. But the difference in seropositivity rate between males and females was not found to be significant (p >0.05) in this study. The prevalence of HIV seropositivity among ICTC clients in the present study was noted to be 1.96%, which is similar (1.86%) to a study conducted in North India during the period 2009-13 [7]. Although, there was an increasing trend of seropositivity rate over the 5years study period which is in sharp contrast to the national level which shows a decreasing trend [3] over the years. The study also showed a steady decrease in the number of attendees over years which might be due to decrease in public awareness and decrease in referrals which reflects lack of inter-sectoral co-ordination among different departments. Clients referred from DOTS clinic accounted for the highest number of seropositives (44.36%) who were also found to have confirmed tuberculosis thereby indicating tuberculosis as the most important co-morbidity. This finding is very close to the national level which stands at 45%[8]. Most of the seropositive clients (>60%) were from the economically productive age group of 21-40yrs which is alarming indeed and is similar to other Indian studies [9] and about 2/3rd of the seropositives had only upto primary education. Most of the seropositives were businessmen (31.58%) followed by daily-wage earners and housewives indicating poor attendance of high risk groups (HRGs) in ICTC in comparison to general population. Among female seropositives, more than 70% were housewives which was also found in other studies [9].
With regard to marital status, majority (66.17%) of study population were married which was also found by Jayrama S
et al [10]. About 54% seropositives were from urban setting
which might be due to the urban location of this test centre. Heterosexual route was the most common route of transmission (61.65%) which too was similar to other studies[9,11] but lower than the national average of 88.2%[12,13]. About 5% of patients revealed blood and blood products as the route of transmission in the present study which although much higher than the national average of 1%[12] was found lower than in another study(6%) done in West Bengal[13]. Coming to seropositive status of spouses, it was found that majority (63.64%) did not even consent to be tested which might be due to the lack of motivation, taboo and ostracism related to this dreaded disease. Among those consented (36.36%), about 78% came out to be seropositive indicating the need for proper counseling of the seropositive
spouses so that majority of them could be tested. Lastly, the forecasted seropositivity rates for the year 2016 showed a declining pattern although the rates during the study period 2011-15 showed an increasing trend.
CONCLUSION
AIDS continues to be one of the dreaded diseases as it has still got no definitive cure. So, the primary concern should be prevention of this disease for which diagnosis of this disease among the seropositives is of utmost importance. This brings us to the very purpose of this study based on the sociodemographic profile of the seropositives which gave us an overall idea about the predominant age group, education, marital status, occupation, modes of transmission, etc. The major area of concern found in this study was the decreasing trend of attendees over the years in the study ICTC clinic which was found out to be due to lack of HIV test kits, inadequate cross-referral between ICTC and other
departments, inadequate voluntary attendance and
unsatisfactory spouse testing. So, activities should be vigorously planned to increase attendance at ICTC, particularly with reference to self initiated clients. The planning and designing of IEC (Information, Education and Communication) activities should be based on socio-demographic profile and risk behavior pattern of a particular area.
Limitations of Study
As this study was hospital based, the results obtained from the study were influenced by the catchment area of hospital, care-seeking behaviour of population and social stigma associatedwith the disease. Hence generalizing the results to the population would be inappropriate. A better alternative could be a community-based study. Secondly, it was a record-based study and so, errors in recording of data and incomplete and missing data was always a possibility. Another limitation was the unavailability of data for two of the months in the study period due to irregular supply of HIV test kits during that period. However, this limitation was overcome by Mean Imputation Method.
Acknowledgements
I am really thankful to the authorities of the ICTC of KPC MCH for their kind support in providing all the relevant information required for this study.
Funding: No funding sources. Conflict of Interest: None declared.
Ethical Approval: This study was approved by the Institutional Ethics Committee of KPC Medical College & Hospital, Kolkata.
References
1. HIV/AIDS key facts. Available
at:http://www.who.int/mediacentre/
factsheets/fs360/en/. Last accessed on 8 November 2017.
2. UNAIDS Factsheet 2017. Available at
:http://www.unaids.org/en/resources/fact-sheet. Last accessed on 17 November 2017.
Bengal, India
4. India HIV Estimations 2015 - Technical Report. Available at :http://indiahivinfo. naco.gov.in /naco/resources/india-hiv-estimations-2015-technical-report. Last accessed on 20 November 2017.
5. Singh H R, Singh N GB, Singhl TB. Estimation of CD4+ and CD8+ Lymphocytes in HIV Infection and AIDS Patients in Manipur. Indian journal of medical
microbiology. 2007; 25 (2):126-132.
6. Ahmad Z, Zaheer M S, Rabbani M U, Khan T, Rewari B B, Pandey D K. Clinical and Demographic Profile of Patients of AIDS in and around Aligarh. Journal of
Indian Academy of Clinical Medicine. 2003;
4(2):121-26.
7. Siddharth Rao PS, Bajpai S, Pandey P, TN Dhole, Hem Chandra. Profile of Seropositives Visiting a HIV Screening Centre of a Tertiary Care Teaching Institute in North India. IJHR. 2016 ; 3(1): 46-50.
8. UNAIDS Country factsheets INDIA 2016. Available at :http://aidsinfo.unaids.org/ #quicklinks-details. Last accessed on 17 November 2017.
9. Gupta M (2009). Profile of clients tested HIV positive in a voluntary counseling and testing center of a district hospital, Udupi. Indian J Community Med; 34:223-26. 10. Jayarama S, Shenoy S, Unnikrishnan B, Ramapuram J,
Rao M. Profiles of Attendees in VCTC of a Medical College in Coastal Karnataka. Indian Journal of
Community Medicine.2008; 33(1):43-46.
11. Gupta V, Singla N, Lehl S S, Chander J. Clinico-epidemiological Profile of HIV Infection over a Period of Six Years in a North Indian Tertiary Care Hospital.
Indian Journal of Med Microbol.2007; 25:171.
12. Govt. of India. Ministry of Health & Family Welfare.Dept.of AIDS Control.National AIDS Control Organization.Annual Report 2011-12. Available from:http://www.nacoonline.org/upload/Publication/An
nual%20Report/Annual%20report%202012-13_English.pdf [Last accessed on 2012 Aug 8].
13. Ghosh S, Mukherjee S, Samanta A. Profile of HIV seropositive patients attending Integrated Counseling & Testing Centre (ICTC): an experience from a medical college in West Bengal,India. GJMEDPH.2013; 2(5): 1-8.
How to cite this article:
Supratik Roy and Kunal Kanti Majumdar (2018) 'Socio-Demographic Profile and Time-Series Analysis of Seropositives Attending Ictc Clinic of A Tertiary Care Hospital of West Bengal, India', International Journal of Current Advanced
Research, 07(5), pp. 12692-12696. DOI: http://dx.doi.org/10.24327/ijcar.2018.12696.2240