Abstract—Under disasters, the destruction of some key nodes in the lifeline system generally leads to the entire disastrous consequence. In order to increase the reliability of lifeline network by protecting the key nodes in network, the paper proposes a method to identify the key nodes in lifeline systems by evaluating the node importance based on variable fuzzy clustering. The paper takes water supply network system as an example and establishes the node importance evaluation indices considering both network topology and resource supply factors. The variable fuzzy clustering method is adopted for cluster analysis of nodes in a case study demonstrated. And the results show that the key nodes in water supply network can be objectively identified by variable fuzzy clustering method. This methodology can help decision makers who work on disaster prevention and reduction of urban lifeline system to build the effective disaster prevention plans.
Index Terms—lifeline system, node importance, variable fuzzy clustering, network topology, resources supply.
I. INTRODUCTION
The failure mode of lifeline systems under disasters is mostly due to the damages of several key nodes which cause a chain reaction in the entire network. Severe cases would even lead to the collapse of the entire system, which enlarges the scope and severity of the destruction by natural disasters. Therefore, the evaluation of the node importance in the lifeline network is a very meaningful work. Identifying the key nodes by the evaluation of node’s importance would increase the reliability of the lifeline network by focusing on the protection of these critical network nodes.
Recent years, the node’s importance in the network has been considered by many researchers [1]-[5]. But most of their study objects are based on virtual network, instead of the physical network. The research in virtual network only focuses on the characteristics of the network topology. Node degree, interrelations and the shortest path were more studied without considering the characteristics of resource supply in the lifeline systems network. However, lifeline network is a kind of physical network. The process of resource allocation and transmission should be considered as key factors when evaluating the node’s importance [6]. Lifeline system includes power supply system, water supply system, gas supply system, communications system, transportation
Manuscript received February 20, 2014; revised April 27, 2014. This work was supported by the National Natural Science Foundation of China under Grant No.51208081, and IRDR-China.
Mingyuan Zhang is with the Dalian University of Technology, Liaoning, P. R. China (e-mail: myzhang@ dlut.edu.cn).
Shisen Feng is with the Industry Section, Development Research Centre of Dalian People’s Government, Dalian, P. R. China (e-mail: shisen_80@126. com).
system and so on. The water supply system was studied as an example in this paper. The evaluation indices of node’s importance were selected according to two aspects, network topology and resource supply.
Also, the variable fuzzy clustering method is adopted for cluster analysis of nodes in the network. According to the cluster analysis, the node’s importance can be categorized easily..
II. THE SELECTION AND CALCULATION METHOD OF NODE
IMPORTANCE EVALUATION INDEX
The ultimate aim for node’s importance evaluation is to identify the key nodes in lifeline networks. And the reliability of the disaster defense system can be increased by focusing on the protection of the critical nodes in the network. Therefore, the selection of the influence factors should reflect both network topology and resource supply when evaluating the node importance of lifeline systems.
A. Nodal Water Supply Level
In the water supply network, the nodal water supply level of the node v1 which connects directly with water source is defined as level 1. , Any other level derived from v1 can be confirmed gradually according to the flow direction in the network. Higher the node’s water supply level is, greater the influence it has to the entire water supply network, vice versa.
For water supply network, the node’s importance depends on the location. Obviously, the importance of the high-level nodes which are located upstream is different from the low-level ones which are located downstream. The ability to access and control resources of high-level nodes is stronger than the low-level ones. The former node exerts greater influence on the entire water supply network so that the high-level nodes are more important than the low-level nodes. Therefore, nodal water supply level is selected out as one of the network topology factors as well as an evaluation index of the node’s importance in water supply network.
The incidence matrix M (G) is defined as follows:
1 1 0 ij
m
−
⎧ ⎪
=⎨ ⎪
⎩ (1)
Using the incidence matrix M(G), water supply nodes’ water supply level can be confirmed gradually according to the flow direction in the pipes. The method is introduced by the following example, shown in Fig. 1.
Evaluating the Node Importance in Lifeline Systems Based
on Variable Fuzzy Clustering
Mingyuan Zhang and Shisen Feng
Fig. 1. Example for confirming nodal water supply level.
According to Fig. 1, the water supply network’s incidence matrix M(G) is obtained as following.
1 1 0 0 0 0
1 0 1 0 0 0
1 0 0 1 0 0
( ) 0 1 0 0 1 0
0 0 1 1 0 0
0 0 0 1 1 0
0 0 0 0 1 1
M G
−
⎡ ⎤
⎢ − ⎥
⎢ ⎥
⎢ − ⎥
⎢ ⎥
=⎢ − ⎥
⎢ − ⎥
⎢ ⎥
−
⎢ ⎥
⎢ − ⎥
⎣ ⎦ (2) The nodal water supply level of node v1 which is directly connected with water source is defined as level 1, that is
L(1)=1. According to M(G), the node vector a1(the first column vector of M(G))of v1 can be obtained as
a1T=(1,1,1,0,0,0,0). By searching out all the nonzero elements in the vector as a1 (1) =1, a1 (2) =1, a1 (3) =1, the pipes of level 1 are found as e1, e2, e3. Based on this, the first row vector b1 of M(G) which is corresponded with e1 was found out, and then, all the elements of “-1” and their column number in the row vector could be figured out. Judging from
b1=(1, -1, 0, 0, 0, 0), the downstream node of pipe e1 can be obtained, b1(2)=-1. e2,e3 can be analyzed in the same way: judging from b2=(1, 0, -1, 0, 0, 0)and b3=(1, 0, 0, -1, 0, 0,
b2(3)=-1 and b3(4)=-1. So the nodal water supply level of node v2, v3, v4 is level 2, that is L(2)=2, L(3)=2, L(4)=2.
On the basis of the nodes with confirmed levels, the water supply levels of the rest nodes in the network can be also obtained easily by the same method. In this example, the final result of nodal water supply level is: L(1)=1, L(2)=2, L(3)=2,
L(4)=2, L(5)=3, L(6)=3.
B. Nodal Degree
In water supply network, the nodal degree D (i) is defined as the number of edges associated with the node vi, which reflects the connectivity of the nodes in the network.
The node importance also depends on the node connectivity in water supply network. To some extent, more the paths are connecting, greater the influence it exerts on the entire network connectivity and the more important status it is in water supply network. Therefore, nodal degree is selected from network topology factors as another evaluating index of node importance in water supply network.
The adjacency matrix A(G) is defined as 1node is connected to node
0node isn't connected to node ij
i j
a
i j
⎧ ⎪
=⎨ ⎪ ⎩
(3)
According to the definition above, the adjacency matrix
A(G) of the network shown in Fig. 1 is obtained 0 1 1 1 0 0
1 0 0 0 1 0 1 0 0 1 0 0 ( )
1 0 1 0 1 0 0 1 0 1 0 1 0 0 0 0 1 0 A G
⎡ ⎤
⎢ ⎥
⎢ ⎥
⎢ ⎥
=⎢ ⎥
⎢ ⎥
⎢ ⎥
⎢ ⎥
⎣ ⎦ (4) The nodal degree D(i) of vi can be gained easily by counting the element of “1” in row I or column I of A(G). The result is: D(1)=3,D(2)=2,D(3)=2,D(4)=3,D(5)=3,D(6)=1. A large number of researches show that the nodal water demand and pressure are two of the most important indicators in the service performance evaluation of water supply network [7].
C. Nodal Water Flow Percentage
The nodal water flow percentage FP (i) refers to the percentage node I accounts for in the total supply of the entire network. FP (i) is defined as follows
( ) ( ) F i FP i
F =
(5) where F (i) denotes the water demand of node i,F denotes the total supply of the entire water supply network.
The resource demand for each node accounts for different proportion of total supply so that the importance of each node is different obviously. The larger proportion the node accounts for, more important it is and the greater influence it would exert on the resource supply of the entire network when it suffers disaster, vice versa. Based on this, the nodal water flow percentage is selected from resource supply factors as an evaluating index of node importance in water supply network.
EPANET 2.0 is a water distribution system modeling software package developed by the Water Supply and Water Resources Division of the United States Environmental Protection Agency’s (EPA). It performs extended-period simulation of hydraulic and water-quality behavior within pressurized pipe networks and is designed to be “a research tool that improves our understanding of the movement and fate of drinking-water constituents within distribution systems”. In view of EPANET 2.0’s powerful and convenient hydraulic analysis capability, it is adopted.
After the basic information of water supply network being input into EPANET 2.0, the flow through each node can be obtained by the calculation of EPANET 2.0 and thus the percentage of the network’s total supply each node accounts for can be also obtained.
D. Nodal Average Value of Water Pressure Reducing
The buried pipelines of water supply network have the following characteristic: wide spatial distribution, huge number and indiscoverable failure position. When the network suffers from disasters, most of the nodes which are damaged slightly are hard to be found and recovered, however, only the nodes damaged very seriously and obviously can be found and recovered in time. Because of this, the water supply network is always in the working state of leakage and low pressure after disasters. In order to meet the water demand right after disaster, the minimum water pressure of nodes is one of the most important hydraulic conditions. If the actual nodal pressure is still higher than the required minimum pressure, usually the users can accept it. However, if the actual pressure is lower than the allowable value, the water demand would not be guaranteed. Due to the cascading failure of network, if some nodes or edges were damaged in the disaster, most of nodes in the network would be affected. In a sense, the APR can reflect the disaster reliability and importance of the node. Therefore, nodal average value of water pressure reducing is also selected from resource supply factors as an evaluation index of node importance.
The disaster simulation program which is developed on the basis of EPANET 2.0 can be used for simulating the situation of water supply network under disaster. The same level disaster damage was respectively imposed to each node in the network. Assume that there is a water supply network with N nodes, after N times of simulation, the APR(i) can be obtained by following formula
( ) ( , 1, 2,..., ) 1
j i i j
PR
APR i i j N
N → ≠
= =
−
∑
(6) where PRj→i is the value of water pressure reducing of node i when node j suffers the simulated disaster.
III. VARIABLE FUZZY CLUSTERING
After selecting and calculating the node importance evaluating indices, an effective classification and sort method is needed. Recent years, a large number of practical results showed that the variable fuzzy clustering method is a good option. It made a breakthrough for the traditional fuzzy clustering iterative model. The clustering results are gained in a more balanced way by dynamic iteration of index weight, relative membership degree with cluster center [8-9]. Based on this, the variable fuzzy clustering method is adopted for clustering analysis of lifeline system nodes.
A. Variable Fuzzy Clustering Iterative Model [10-11]
Suppose that there is a set of n samples needed to be clustered according to the eigenvalue of m indexes, the sample set can be expressed as follows
( )
m n ij m n
X × = x × (7) where xij is the eigenvalues of index i at sample j,
i=1,2,…,m; j=1,2,…, n.
Due to m, indexes have different physical dimension. The original data should be normalized before the clustering
analysis. After normalizing, the matrix X is transformed into normalized index eigenvalue matrix R.
( ) m n ij m n
R× = r × ,0≤ ≤rij 1 (8) Assume n samples would be clustered to c classes according to the m indexes and the fuzzy clustering matrix is defined as follows
( ) c n hj c n
U× = u × (9)
where uhj denotes the relative membership degree of sample j
belonging to class h. It should subject to constraints
1 1 c
hj h
u = =
∑
,0≤uhj≤1, 1
0
n hj j
u
=
>
∑
(h=1,2,…,c;j=1,2,…,n) (10) In fuzzy clustering, the characteristics of clustering c are described by fuzzy clustering center. The fuzzy clustering center matrix can be described as follows
( ) m c ih m c
S × = s × ,0≤sih≤1 (11) Different indexes have different effects to clustering results. Weights are inducted into indexes. Index weight vector is defined as follows
1 2
( , , , m) ( )i
w= w w " w = w (12)
Such that
1 1 m
i i
w = =
∑
,0≤wi≤1 (13)
The difference between sample j and class h can be represented by generalized index weighted distance:
1
1
m p p
hj i ij ih i
d w r s
=
⎧ ⎡ ⎤ ⎫
=⎨ ⎣ − ⎦ ⎬
⎩
∑
⎭ (14) where p is the variable distance parameter, it is usually preferable to p = 1 or 2. p = 1 represents the Hamming distance, p = 2 represents the Euclidean distance.Based on the generalized index weighted distance, relative membership degree is inducted as weight., After being generalized, the index weight distance is obtained as follows
hj hj hj
D =u d (15) In order to gain the optimal fuzzy clustering matrix and optimal fuzzy cluster center matrix, the objective function can be established as
2 2
1 1 1 1 1
min ( , )hj ih n c hj hj n c hj m i ij ih p p
j h j h i
F u s u d u w r s
α α
= = = = =
⎧ ⎡ ⎤ ⎫
⎪ ⎡ ⎤ ⎪
= = −
⎨ ⎢⎣ ⎣ ⎦ ⎥⎦ ⎬
⎪ ⎪
⎩
∑∑
∑∑ ∑
⎭ (16)where a is variable parameter for optimization criterion, a =1 represents the least absolute deviation criteria, a =2 represents the least square criteria.
A Lagrange Function would be constructed as follows
2
1 1 1 1
( , , )hj ih n c hj m i ij ih p p (c hj 1)
j h i h
L u s u w r s u
α
λ λ
= = = =
⎧ ⎡ ⎤ ⎫
= ⎨ ⎣ − ⎦ ⎬ − −
⎩ ⎭
∑∑
∑
∑
Demand 0 hj L u ∂ =
∂ , ih 0
L s ∂ =
∂ , 0
L
λ ∂ =
∂ (18) The variable fuzzy clustering iteration model is obtained as follow
1
1
1
1
m p p
i ij ih c
i
hj m p
k
i ij ik i
w r s u
w r s
α − = = = ⎧ ⎡ ⎤ ⎫ ⎪ ⎢ ⎡ − ⎤ ⎥ ⎪ ⎣ ⎦ ⎪ ⎢ ⎥ ⎪ =⎨ ⎬ ⎢ ⎥ ⎪ ⎡⎣ − ⎤⎦ ⎪ ⎢ ⎥ ⎪ ⎣ ⎦ ⎪ ⎩ ⎭
∑
∑
∑
(19) 2 1 1 2 1 1 n p hj ij j ih n p hj j u r s u − = − = =∑
∑
,p 1
α=
(20) The optimal fuzzy clustering matrix uhj∗ would be obtained by dynamic iteration of index weighting and relative membership degree with cluster center and thus grade eigenvalue vector H can be also gained by the following formula
1 2
(1, 2, , )( ) (hj , , , n)
H= " c u∗ = H H " H (21)
IV. CASE STUDY
A. Case Background
The variable fuzzy clustering iterative model above would be applied to fuzzy clustering analysis of the nodes in water supply system of an area. The water supply network of the case is shown in Fig. 2 and the node properties and pipe properties of the network are respectively shown in Table I and Table II.
Fig. 2. The graph of a water supply network.
TABLEI:DATA OF THE NODES
Node ID
Elevation
(ft) Demand(L/s)
1 13.6 0 2 23.2 40.1 3 17.8 38.8 4 18.8 14.6 5 18.3 35.1 6 23.9 50.8 7 25.1 39.9 8 19.1 51.2 9 17.3 82.3 10 17.3 43.4 11 18.7 56.4 12 20.2 30.6 13 22.0 40.8
B. Calculation Process of Index
The 4 factors of nodal water supply level, nodal degree, nodal water flow percentage, and nodal average value of water pressure reducing are selected as node importance evaluation indexes in the water supply network. The method described in the first part of the paper is used for calculating the indexes.
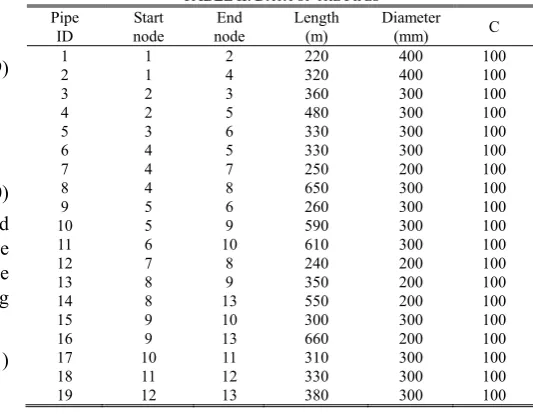
TABLEII:DATA OF THE PIPES
Pipe ID Start node End node Length (m) Diameter (mm) C
1 1 2 220 400 100
2 1 4 320 400 100
3 2 3 360 300 100
4 2 5 480 300 100
5 3 6 330 300 100
6 4 5 330 300 100
7 4 7 250 200 100
8 4 8 650 300 100
9 5 6 260 300 100
10 5 9 590 300 100
11 6 10 610 300 100
12 7 8 240 200 100
13 8 9 350 200 100
14 8 13 550 200 100
15 9 10 300 300 100
16 9 13 660 200 100
17 10 11 310 300 100
18 11 12 330 300 100
19 12 13 380 300 100
C. Nodal Water Supply Level and Nodal Degree
According to Fig. 2, the incidence matrix M (G) and adjacency matrix A (G) can be drawn, shown in Eq. (22) and Eq. (23). Based on this, the nodal water supply level L (i) and nodal degree D (i) can be also obtained, shown in Table III.
1 1 0 0 0 0 0 0 0 0 0 0 0
1 0 0 1 0 0 0 0 0 0 0 0 0
0 1 1 0 0 0 0 0 0 0 0 0 0
0 1 0 0 1 0 0 0 0 0 0 0 0
0 0 1 0 0 1 0 0 0 0 0 0 0
0 0 0 1 1 0 0 0 0 0 0 0 0
0 0 0 1 0 0 1 0 0 0 0 0 0
0 0 0 1 0 0 0 1 0 0 0 0 0
0 0 0 0 1 1 0 0 0 0 0 0 0
( ) 0 0 0 0 1 0 0 0 1 0 0 0 0
0 0 0 0 0 1 0 0 0 1 0 0 0
0 0 0 0 0 0 1 1 0 0 0 0 0
0 0 0 0 0 0 0 1 1 0 0 0 0
0 0 0 0 0 0 0 1 0 0 0 0
M G − − − − − − − − − = − − − − −1
0 0 0 0 0 0 0 0 1 1 0 0 0
0 0 0 0 0 0 0 0 1 0 0 0 1
0 0 0 0 0 0 0 0 0 1 1 0 0
0 0 0 0 0 0 0 0 0 0 1 1 0
0 0 0 0 0 0 0 0 0 0 0 1 1
⎡ ⎤ ⎢ ⎥ ⎢ ⎥ ⎢ ⎥ ⎢ ⎥ ⎢ ⎥ ⎢ ⎥ ⎢ ⎥ ⎢ ⎥ ⎢ ⎥ ⎢ ⎥ ⎢ ⎥ ⎢ ⎥ ⎢ ⎥ ⎢ ⎥ ⎢ ⎥ ⎢ ⎥ ⎢ ⎥ ⎢ ⎥ ⎢ ⎥ ⎢ ⎥ ⎢ ⎥ − ⎢ ⎥ ⎢ −⎥ ⎢ ⎥ − ⎢ ⎥ ⎢ − ⎥ ⎢ ⎥ ⎢ ⎥
⎣ ⎦ (22)
0 1 0 1 0 0 0 0 0 0 0 0 0 1 0 1 0 1 0 0 0 0 0 0 0 0 0 1 0 0 0 1 0 0 0 0 0 0 0 1 0 0 0 1 0 1 1 0 0 0 0 0 0 1 0 1 0 1 0 0 1 0 0 0 0 0 0 1 0 1 0 0 0 0 1 0 0 0 ( ) 0 0 0 1 0 0 0 1 0 0 0 0 0 0 0 0 1 0 0 1 0 1 0 0 0 1 0 0 0 0 1 0 0 1 0 1 0 0 1 0 0 0 0 0 1 0 0 1 0 1 0 0 0 0 0 0 0 0 0 0 0 1 0 1 0 0 0 0 0 0 0 0 0 0 0 1 0 1 0 0 0 0 0 0 0 1 0 0 0 1 0
D. Nodal Water Flow Percentage
The nodal water flow percentage FP (i) of each node in the water supply network can be calculated by the program of EPANET 2.0 which has powerful hydraulic characteristics analysis function (results shown in Table III).
E. Nodal Average Value of Water Pressure Reduction
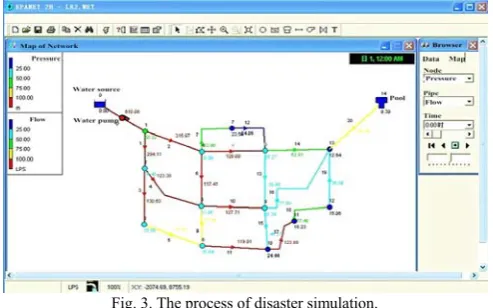
The disaster simulation program which is developed on the basis of EPANET 2.0 can be used for simulating the situation of water supply network under disasters which is shown in Fig. 3. The same level disaster damage is respectively imposed to nodes No.2-No.13 in the network. The final results of nodal average value of water pressure reducition APR (i) (shown in Table III) would be calculated as the average of 11 times of simulation.
Fig. 3. The process of disaster simulation.
The calculation results of evaluation index were shown in Table III.
TABLEIII:THE CALCULATION RESULTS OF EVALUATION INDEX
Node ID L(i) D(i) FP(i) APR(i)
2 2 3 7.65% 19.60%
3 3 2 7.40% 23.37%
4 2 4 2.79% 19.19%
5 3 4 6.70% 24.34%
6 4 3 9.69% 23.60%
7 3 2 7.61% 34.20%
8 3 4 9.77% 27.02%
9 4 4 15.71% 30.32%
10 5 3 8.28% 31.01%
11 6 2 10.76% 30.31%
12 7 2 5.84% 28.88%
13 4 3 7.79% 19.88%
F. Normalization of Index Character Values
When an index is a beneficial type of index, which means bigger, better, the normalization formula would be described as follows
max ij ij
ij j
x r
x =
(24)
min
, min 0
1 , min 0 max
ij j
ij j ij
ij
ij
ij j ij
j
x
x x
r
x
x x
⎧
⎪ ≠
⎪
=⎨
⎪ − =
⎪
⎩ (25)
When the index is coasty type of index, Which means smaller, better, the normalization formula would be described
as follows
maxj xij, minj xij denote maximum, minimum eigenvalues of index i, respectively. The normalization results are shown in Table IV.
TABLEIV:NORMALIZATION OF INDEX CHARACTER VALUES DATA
Node ID L(i) D(i) FP(i) APR(i)
2 1.0000 0.7500 0.4870 0.5731
3 0.6667 0.5000 0.4710 0.6833
4 1.0000 1.0000 0.1776 0.5611
5 0.6667 1.0000 0.4265 0.7117
6 0.5000 0.7500 0.6168 0.6901
7 0.6667 0.5000 0.4844 1.0000
8 0.6667 1.0000 0.6219 0.7901
9 0.5000 1.0000 1.0000 0.8865
10 0.4000 0.7500 0.5271 0.9067 11 0.3333 0.5000 0.6849 0.8863 12 0.2857 0.5000 0.3717 0.8444 13 0.5000 0.7500 0.4959 0.5813
G. Variable Fuzzy Clustering Analysis
Depending on the 4 node importance evaluation indexes of water supply network, the node importance can be divided into 4 classes(c=4): I, II, III, IV. From Class I to Class IV, the node importance is gradually reduced. The calculation of uhj and sih is précised to the level that ε1=ε2=0.001 When α = 2, p
= 2, the clustering can convergence to a more reasonable calculating result [12]. Based on this, the paper takes α = 2, p
= 2 and supposes the original fuzzy clustering matrix which should satisfy the constraint equation (10).The optimal fuzzy clustering results could be obtained by using fuzzy clustering iterative model, shown in Table V.
TABLEV:RESULTS OF OPTIMAL FUZZY CLUSTERING MATRIX
Node ID Ⅰ Ⅱ Ⅲ Ⅳ
2 0.2677 0.6009 0.0708 0.0606
3 0.1237 0.5773 0.0803 0.2187
4 0.7259 0.1578 0.0698 0.0465
5 0.9043 0.0477 0.0348 0.0133
6 0.0849 0.7969 0.0600 0.0582
7 0.1278 0.2292 0.1469 0.4961
8 0.4186 0.1560 0.3677 0.0577
9 0.0157 0.0144 0.9593 0.0105
10 0.1330 0.2229 0.2050 0.4390
11 0.0202 0.0459 0.0300 0.9039
12 0.0497 0.0993 0.0517 0.7993
13 0.1026 0.8167 0.0377 0.0430
H. Results and Discussion
Based on Table V, the grade eigenvalue vector H can be calculated by using Eq. (21) as follows Hj=(1.9243,
2.3940,1.4368,1.1570,2.0916,3.0113,2.0645,2.9647,
2.9501,3.8176,3.6006,2.0211).
According to the range of classification (shown in Table VI), nodal fuzzy clustering results could be obtained, shown in Table VII.
TABLEVI:THE RANGE OF CLASSIFICATION
Classificatio n
Range
Ⅰ 1 < Hj≤ 1.5
Ⅱ 1.5 < Hj≤ 2.5
Ⅲ 2.5 < Hj≤ 3.5
Ⅳ 3.5 <
TABLEVII:NODAL FUZZY CLUSTERING RESULTS
Classification Node ID
Ⅰ 4
Ⅱ 2, 5, 6, 8, 13
Ⅲ 3, 7, 9, 10, 11, 12
Ⅳ None
In addition, the sorting result of nodal importance in the water supply network can be also obtained, in decreasing order of importance : 4→2→5→6→13→8→3→9→7→10
→11→12.
Considering the two aspects of network, topology and resource supply, the node clustering results show that most of the nodes in the network belong to Class III (important), less nodes belong to Class II (more important) and, however, only a few nodes belong to Class I (the most important).
Analysis results show that the key nodes in the lifeline network can be objectively identified by using variable fuzzy clustering method.
V. CONCLUSIONS
Water supply system is studied as an example in this paper. Considering the two aspects of network, topology and resource supply, 4 factors of nodal water supply level, nodal degree, nodal water flow percentage and nodal average value of water pressure reducing are selected as node importance evaluation indexes. The calculation method of evaluation indexes are also given in the paper. It has been proved that practically more reasonable clustering results can be drawn by variable fuzzy clustering method, which was demonstrated by the case study.
Results showed that the key nodes in lifeline network can be objectively identified by using variable fuzzy clustering method. This methodology can help decision makers who work with disaster prevention and reduction of urban lifeline system for the better plan upon the node importance in lifeline system. Disaster management can be simplified and made more efficiently by focusing on the protection of these key nodes in network. Serious consequence caused by the damaged key nodes can be avoided. The reliability of lifeline system can be also improved.
ACKNOWLEDGMENT
The financial support provided by the National Natural Science Foundation of China under Grant No.51208081, and IRDR-China.
REFERENCES
[1] L. C. Freeman, “A set of measures of centrality based upon betweenness,” Sociometry, vol.40, pp. 35-41, 1977.
[2] H. W. Corley and D. Y. Sha, “Most vital links and nodes in weighted networks,” Oper Res Lett, vol. 1, pp.157-160,1982.
[3] E. Nardelli, G. Proietti, and P. Widmayer, “Finding the most vital node of a shortest path,” Theoretical Computer Science, vol. 296, no. 1, pp. 167-177, February 2001.
[4] Y. Tan, J. Wu, and H. Deng, “Evaluation method for node importance based on node contraction in complex networks,” Systems Engineering-Theory& Practice, vol.11, no. 11, pp. 79-83, November 2007.
[5] C. Jing and S. Linfu,” Evaluation of Node Importance in Complex Networks,” Journal of Southwest Jiaotong University, vol. 44, no. 3, pp. 426-429, June 2009.
[6] R. Lu, “Study on the evaluation of water supply network vulnerability,” Ph.D. dissertation, Hefei University of Technology, China, 2007. [7] C. Liu and S. He, “Fuzzy evaluation method for serviceability of
post-earthquake water supply network,” Journal of Tianjin University, vol.43, no. 8, pp. 690-696, August 2010.
[8] S. Chen, J. Yuan, and Y. Li, “Fuzzy clustering iterative model and its application based on variable fuzzy set,” Journal of Dalian University of Technology, vol. 48, no. 6, pp. 881-886, December 2008.
[9] M. Zhang, U. Liu, and Y. Yuan,” Research on the assessment of Urban comprehensive disaster-bearing capacity based on variable fuzzy clustering,” Journal of Catastrophology, vol. 27, no. 1, pp.135-138, February 2012.
[10] S. Chen, “Theory and model of fuzzy clustering iteration,” Fuzzy Systems and Mathematics, vol.18, no .2, pp. 57-61, February 2004. [11] S. Chen, “Unified theory and model of variable fuzzy clustering and
pattern recognition,” Journal of Dalian University of Technology, vol. 49, no. 2, pp. 307-312, April 2009.
[12] S. Chen, M. Li, and S. Wang, “Rationality analysis and application test of variable fuzzy clustering iterative mode’, Journal of Dalian University of Technology, vol. 49, no. 6, pp. 932-936, December 2009.
Mingyuan Zhang was born in Liaoning, on 13 July, 1981. She received her B.S in 2003; she received her M. E and D. E from in Dalian University of Technology (DUT), China.
She is an associate professor at DUT. She researches on construction management and critical infrastructure.
Shisen Feng was born in Liaoning, on 14 April, 1980. He received his B.S in 2003; He received his M.S in 2007, and He is now candidate for Ph.D in Dalian University of Technology (DUT), China.
He is an associate researcher at Industry Section, Development Research Centre of Dalian People’s Government, Dalian, P.R.China. He researches on construction management.