ISSN 0000 ©2013 WEJ Journal
Impact of temperature fluctuation on yield and
quality traits of different safflower genotypes
Reda Shabana
1, Ashraf A. Abd El Mohsen
1, Hasnaa, A. H. Gouda
2and Hoda, S. Hafez
21. Department of Agronomy, Faculty of Agriculture, Cairo University, Giza, Egypt 2. National Organization for Drug Control and Research, Ministry of Health, Cairo, Egypt.
Corresponding author E-mail: [email protected], [email protected].
ABSTRACT: Growth and development of safflower are affected by different uncontrollable environmental conditions. Oil contents of safflower are largely influenced by temperature fluctuations. Temperature variations in the field can be created by sowing crops at different dates in the season. The objective of this work was to investigate the effect of different planting dates (i.e., 1st November, 15th November and 1st December), and thermal temperatures (growing degree days, GDD) on yield and quality traits of four genotypes (two local land races, i. e. G 21 and G 81 and two exotic genotypes from Cyprus i. e. G 45 and G 48) and a commercial cultivar (Giza 1). Six environments were created (three different planting dates during 2006/07 and 2007/08). The experimental design was a randomized complete blocks design with three replications. Safflower genotypes exhibited significant differences for seed, oil and protein yields, oil content, heat units accumulation and fatty acids composition. Seed yield was positively correlated (r=0.97**) with growing degree days (GDD) to maturity. The results showed that the seed, oil and protein yield, decreased significantly as the planting dates were delayed. Linear regression equation revealed that increases of one unit (15-day interval) than the optimum date decreased yield by 29.64 kg/fed. The first planting date (1 November) produced the highest seed yield (581.70 kg/fed), whereas the third planting date (1 December) produced the lowest seed yield (522.42 kg/fed). The first planting date yielded the highest average oil yield compared to the other planting dates. Although a positive linear relationship was achieved between accumulated heat units during the period of oil synthesis and until physiological maturity, the R2 value was very low. The average values of oil content were highest in seeds for genotype G 45 (34.21%). Giza 1 had on average the lowest oil content (29.55%). High linoleic acid was dominant in all the five safflower genotypes. Pronounced variation in the main unsaturated fatty acids of oil (linoleic and oleic) was obvious in different environments and was very high. The linear association between heat units and concentration of either oleic or linoleic acid was also discussed.
Key words: Safflower, Planting date, Varying environments, Temperature, Correlation, Regression, Coefficient of determination, Heat units accumulation, Seed yield, Oil content, Fatty acids.
INTRODUCTION
Edible oil is a major constituent of our routine daily diet. Egypt has been facing chronic shortage of it and a large quantity of edible oil is being imported annually from other countries to bridge the gap existing between local production and consumption. At present, edible oil requirement of the country is more than one million tons annually and less than 10 % of it is met by local production. Safflower is an important aromatic and medicinal plant. Due to high oil content in seed, it is also cultivated as an oil crop. Carthamine (C21H22O11), a coloring substance found in the flowers of this plant, is used as colorant in food-processing industry and was found to inhibit platelets coagulation and delays bleeding (Huang 1993).
75 Safflower growth as well as composition and quality of its seeds are influenced by many factors like genotype, environment and agronomic practices. Environmental variables can be classified to predictable and/or unpredictable factors (Allard and Bradshaw 1964). Planting date is among the predictable factors (i. e., those that occur in a systematic manner or under human control). Sowing time is a major agronomic factor affecting both seed and oil yield in safflower (Tomar 1995 and Gecgel et al 2007). Therefore, determining optimum sowing time and selecting suitable variety for growing regions are necessary to obtain safflower with high yield and quality.
Environmental factors can make the difference between a good and a bad season. Besides, it reveals the adaptive potentiality of genotypes. Temperature is a major environmental factor that determines the rate of plant growth and development. Global warming with ensuing elevates heat stress is a recent phenomenon that poses a serious threat to crop productivity allover the world. Documented increases in global temperatures, forecasted by several climate models in many countries of the world, have stimulated interest on the direct effects of temperature and other climatic variables on plant growth, yield and quality of oil crops. Genotypes behave differently under different environmental conditions. Safflower is a temperate zone crop but it can perform well under various climatic and soil conditions. Temperature variations in the field can be created by sowing crops at different dates in the season. The crop will grow at different temperature, sunshine and relative humidity.
Having wider adaptability, different safflower genotypes require different total number of cumulative degree days or heat units for growth, development and maturity. All physiological and morphological developments occurring in plant are markedly influenced by temperature. Different sowing dates might result in different environmental conditions during grain filling and oil synthesis. In particular, the fatty acid composition is known to differ with cultivars and environmental conditions (Connor and Sadras 1992). The growing degree days (GDD), or heat unit (HU) is the most common index used to estimate plant development. The accumulation of these heat units determines the maturity of crop as well as performance and quality of the end product.
The genotype-environment interaction is the key factor in the assessment of crop variety performance in terms of quantity and quality of the product. Environmental variables such as temperature, sunshine and rainfall affect plant growth and development differently. It has been concluded that temperature regulates plant growth and development processes. The rate of plant development is mainly temperature driven (Ritche and Ne Smith 1991). Thus, modern plant breeders need to close the gap between actual and potential yield via the modeling of the impact of temperature variation on yield and quality of a number of genotypes. In that context, well-adapted local land races and/or cultivars as well as exotic improved genotypes might be used as donors to improve a target genotype.
The objectives of this study were to (i) evaluate the effects of planting dates on yield, oil content and fatty acid composition of five safflower genotypes and (ii) modeling the relationships between heat unit accumulation and seed, oil, protein yield and fatty acid composition of safflower genotypes, planted at different dates.
MATERIALS AND METHODS
Experimental location and plant materials
The present study was carried out at the Agricultural and Research Station, Faculty of Agriculture, Cairo University, Giza, Egypt (30° 02'N Latitude and 31° 13' E Longitude, Altitude 22.50 m), during 2006/2007 and 2007/2008 growing seasons. Five genotypes (G) of safflower, representing two local land races, i.e. G 21 and G 81, two exotic genotypes introduced from Cyprus, i.e. G 45 and G 48 and one commercial cultivar, i.e. Giza 1 were used in this study.
Difference in temperature for growth, development and maturity was created by planting safflower genotypes at different dates in the season thus giving a wide range of temperature from planting till maturity.
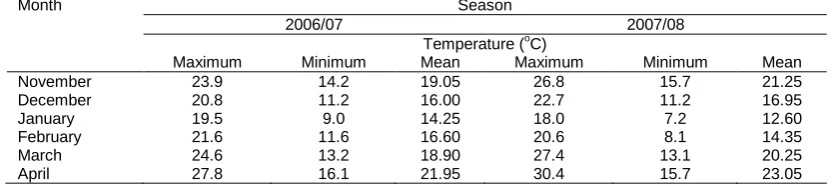
Meteorological data records were obtained from the Agrometeorological Station on the site. Monthly maximum, minimum and mean temperature during the study of 2006/07 and 2007/08 seasons are shown in Table (1). The baseline temperature used for growing degree days (GDD) computations was 5o C. Meteorological conditions varied widely between seasons.
The cumulative heat units (CHU)for different growth stages were calculated by the equation of Dwyer and Stewart (1986).
CHU= b
t
t
T
T
T
12
2
min)
max
(
76 development is 5°C (Sadras and Hall 1988). Cumulative heat units (∑CHU) are then summed over the time period of interest.
Table 1. Monthly maximum, minimum and mean temperature during 2006/07 and 2007/08 seasons.
Month Season
2006/07 2007/08
Temperature (oC)
Maximum Minimum Mean Maximum Minimum Mean
November 23.9 14.2 19.05 26.8 15.7 21.25
December 20.8 11.2 16.00 22.7 11.2 16.95
January 19.5 9.0 14.25 18.0 7.2 12.60
February 21.6 11.6 16.60 20.6 8.1 14.35
March 24.6 13.2 18.90 27.4 13.1 20.25
April 27.8 16.1 21.95 30.4 15.7 23.05
Experimental environments
The experiment was carried out at six environments (2 years x 3 sowing dates); details of the six environments are given in Table (2).
Table 2. The six manipulated environments used in this study.
Environment Growing season Planting date
E1 2006/2007 First November
E2 2006/2007 Mid November
E3 2006/2007 First December
E4 2007/2008 First November
E5 2007/2008 Mid November
E6 2007/2008 First December
Experimental layout and crop management
The five safflower genotypes were evaluated at three different dates of planting (November 1, November 15 and December 1) for two successive years i.e., 2006/07 and 2007/08. The five genotypes were planted in a randomized complete block design (RCBD) with 3 replications. Planting in each replicate was done in a 3-row plot of 3 m long a spacing of 0.60 m between and 0.30 m within the hills. The size of plot was (5,4 m2).
Seeds were planted in hills and each hill received about five seeds and was immediately irrigated. In these experiments, 30 Kg/fed of P2O5 as ammonium phosphate and 15 Kg/fed of nitrogen as urea were applied prior to sowing and 20 Kg/fed of nitrogen as urea used as top dressing at the start of stem elongation. Seedlings were later thinned to two plants per hill after four weeks of planting. Weeding was carried out twice manually; the first weeding was done four weeks after planting while the second weeding was done eight weeks after planting. Crop harvesting was carried out 150-165 days after planting from the beginning of April to beginning of May at physiological maturity stage. All other practices were done according to recommendations.
Recording of observations Growth and yield characteristics
Data recorded on a plot basis. They were: days to flowering (DF) as number of days from planting time to 50% flowering, days to maturity (DM) and seed yield per plot. All plants from each plot were harvested and were left in the field until full drying to determine seed yield/plot, seed yield/fed, seed oil yield/fed and seed protein yield/fed. Oil yield and protein yield were calculated by multiplying seed yield × seed oil percentage and seed protein %, respectively.
Chemical traits
The oil and protein contents (%) were measured on randomly selected seed samples of each plot. Samples were obtained in the third week of May in both years. A total of 90 samples for the five genotypes were analyzed in terms of protein, oil content and fatty acid composition (palmitic, oleic, linoleic and linolenic ). Seed protein % was calculated by multiplying N (%) × 5.75; oil content of the samples was measured using the soxhlet extraction method with hexane, while fatty acids (palmitic, olic, linoleic and linolenic acids) composition were determined by gas liquid chromatograph (GLC) according to AOAC (1990) .
Statistical analyses
77 variances by using Bartlett's test (Snedecor and Cochran 1983), combined analysis of variance was performed. The least significant difference (LSD) test at probability level of 5% was used to determine the statistical differences between means when the F value was significant. The data were statistically analyzed by using the computer statistical software package MSTAT-C (Freed et al 1989) and for drawing the diagrams, Excel software was used.
RESULTS AND DISCUSSION
Combined analysis of variance
The results of variance analysis revealed significant differences among the genotypes (G), planting dates (D) and G x D interactions for the parameters tested, indicating the presence of variability among genotypes as well as among the environments and that performance of genotypes is different from one environment to another (Tables 3 and 4).
The analysis of variance showed that mean squares for genotypes were significant for all traits studied. This indicates the existence of a high degree of genetic variability in the material under this study, and that is reflected in the broad range observed for each trait (Table 3). Such a significant variation in all studied characteristics is a valuable source for several breeding purposes.
Table 3. Combined analysis of variance for studied crop phenology and yield traits of 5 safflower genotypes evaluated across two years and three planting dates.
Source of variability df Mean squares
Days to flowering
Days to maturity
Seed yield kg/fed
Oil yield kg/fed
Protein yield kg/fed
Years (Y) 1 6.17 8.10 11562.95** 1232.02* 167.96
Planting dates (D) 2 3164.63** 4193.67** 27511.71** 3166.31** 4931.65**
Y x D 2 1.90 50.03 173.90 233.36 351.32**
R (DY) 12 16.27 20.82 827.15 124.30 33.83
Genotypes (G) 4 680.47** 733.65** 29887.54** 2133.83** 567.89**
Y x G 4 19.80 39.26 2993.04 391.83 136.43*
D x G 8 84.73** 78.24** 5819.08** 695.69** 690.79**
Y x D x G 8 4.41 24.65 4640.28** 625.15** 476.50**
Error 48 11.11 21.32 1375.68 183.91 47.81
*, ** Significant at 5 and 1% level of probability, respectively, using the F test
This result confirms the results of other researchers (Ahmad et al 2001 and Golkar et al 2011 a). The year × genotype, planting date × genotype, and year × planting date × genotype effects were significant for most studied traits, indicating significant genotype × environment interactions. Hence, environmental effects are important in understanding plant growth and should be given consideration in safflower breeding programs.
Combined analysis across years and planting dates indicated highly significant (P≤0.01) mean squares for the genotypes for all the characters (Table 3). This suggests that some of the genotypes were evidently superior to others in these traits. The highly significant differences (P≤ 0.01) of the combined analysis across planting dates and years indicate the performance fluctuation of the five genotypes in their responses to the different environments. There are also tremendous changes in yield ranks of the genotypes across environments, which may considered as a good criterion in explaining some of the yearly variation in yield.
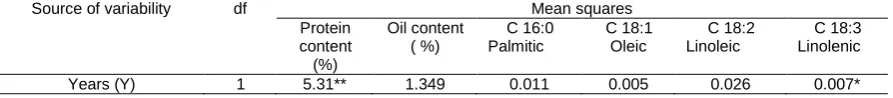
The results of the combined analysis showed that there were significant differences between planting dates and genotypes for seed oil and fatty acid composition (Table 4). Highly significant mean squares (P ≤ 0.01) were also recorded due to planting date (D) for protein, oil content and the three unsaturated fatty acids (i.e., oleic, linoleic and linolenic). ANOVA results for protein, oil content, palmitic, oleic, linoleic and linolenic acid showed significant mean squares (P≤0.01) due to the interaction of genotype by planting date (DxG), except palmitic acid. Variances due to genotype x year x planting date interaction was, however, not significant for all studied traits, except protein and oil content. Similarly variances due to years and the years by planting dates interactions were not significant (P>0.05) for all studied traits, except for protein content and linolenic acid, respectively. Otherwise, variances due to interactions of years and genotypes (YxG) were significant for protein, oil content, oleic and linolenic acid.
Table 4. Combined analysis of variance for seed-quality related traits in safflower genotypes.
Source of variability df Mean squares
Protein content
(%)
Oil content ( %)
C 16:0 Palmitic
C 18:1 Oleic
C 18:2 Linoleic
C 18:3 Linolenic
78
Planting dates (D) 2 55.83** 5.956** 0.028 4.276** 26.872** 0.655**
Y x D 2 9.66** 1.138 0.121 0.002 0.0001 0.002
R (DY) 12 0.16 0.351 0.109 0.003* 0.035 0.001
Genotypes (G) 4 14.79** 88.734** 1.764** 7.634** 13.615** 0.319**
Y x G 4 7.47** 3.505** 0.089 0.003* 0.004 0.003*
D x G 8 7.95** 2.128** 0.458** 0.703** 7.608** 0.496**
Y x D x G 8 8.04** 2.091** 0.102 0.002 0.007 0.002
Error 48 0.18 0.379 0.111 0.001 0.203 0.001
*, ** Significant at 5 and 1% level of probability respectively using the F test
Safflower development and crop phenology
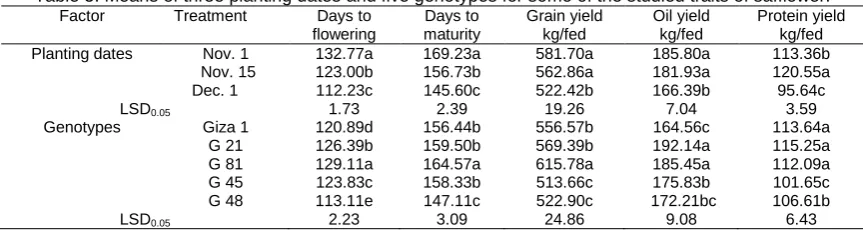
Environmental factors, especially temperature is the key factor that influences plant growth and development. Significant differences among different genotypes for heat units depicted that different genotypes have varying maturity periods. However, higher heat units accumulated by early planted crop during both years reflected that the optimum planting date of a particular crop is early planting to have good output. Means of days to flowering, days to maturity, seed, protein, oil yield and quality traits for the safflower genotypes tested are presented in Tables 5 and 6.
Table 5. Means of three planting dates and five genotypes for some of the studied traits of safflower.
Factor Treatment Days to
flowering
Days to maturity
Grain yield kg/fed
Oil yield kg/fed
Protein yield kg/fed
Planting dates Nov. 1 132.77a 169.23a 581.70a 185.80a 113.36b
Nov. 15 123.00b 156.73b 562.86a 181.93a 120.55a
Dec. 1 112.23c 145.60c 522.42b 166.39b 95.64c
LSD0.05 1.73 2.39 19.26 7.04 3.59
Genotypes Giza 1 120.89d 156.44b 556.57b 164.56c 113.64a
G 21 126.39b 159.50b 569.39b 192.14a 115.25a
G 81 129.11a 164.57a 615.78a 185.45a 112.09a
G 45 123.83c 158.33b 513.66c 175.83b 101.65c
G 48 113.11e 147.11c 522.90c 172.21bc 106.61b
LSD0.05 2.23 3.09 24.86 9.08 6.43
Means followed by similar letter in the same column are not significantly different at 5% level of probability.
Days to flowering (DF)
Statistical analysis of the data revealed that planting dates (D) significantly affected days to 50% flowering (Table 5). Crop planted on November 1, took maximum number of days to flowering (132.77). Days to flowering trait were enhanced with the delay in planting and minimum number (112.23) was recorded by sowing on December 1. Thereafter, further delay in planting decreased number of days to flowering. This variation in days to flowering might be due to variation in temperature prevailed by the crop growth. Arslan et al (1997) reported that high temperatures at flowering and pollination stages resulted in fruitless of small flowers and reduction of yield and yield components of safflower varieties.
Studied genotypes started to flower at different times. According to means comparison (Table 5) mean number of days to flowering (DF) of genotypes was significant at the probability level of 1% and there were considerable differences among them so that G 48 had the lowest DF (113.11) followed by Giza 1 (120.89). Genotypes with shorter vegetative growth reached to their reproductive growth stage sooner. This result supports that reported by Alizadeh (2005) and Golkar et al (2011 b).
Days to maturity (DM)
Analysis of the data revealed that planting dates (D) significantly affected days to maturity (Table 5). Crop planted on November 1, took maximum number of days to maturity (169.23). Days to maturity decreased with delay in planting and minimum days to maturity (145.60 days) were determined when planting took place on December 1. This reduction in days to maturity in case of late planting may be due to unfavorable photoperiod and high temperature conditions that forced the crop to end up the life cycle rapidly at the cost of reduction in yield and yield components. These findings agree with those of Dadashi and Khajehpour (2004), who found that number of days from planting to emergence, stem elongation to head visible, head visible to flowering initiation and termination of flowering to physiological maturity were significantly reduced with delay in planting as the result of increase in temperature during these periods.
Means of days to maturity (DM) of genotypes were significantly different (p≤ 0.05). Entry 48 had the greatest DM (147.11 days) and Giza 1, entry 45 and entry 21 stood in next rank (with DM of 156.44, 158.33 and 159.50 days, respectively).
79
Seed yield
Usually planting dates and genotypes play an important role in yield and yield components as well as quality traits. At first planting date, due to increased plant height, number of branches, number of heads per plant, seed yield per plant, thousand seed weight and suitable environmental growing conditions, safflower genotypes could produce high seed yield, compared to second and third planting date used in this study
.
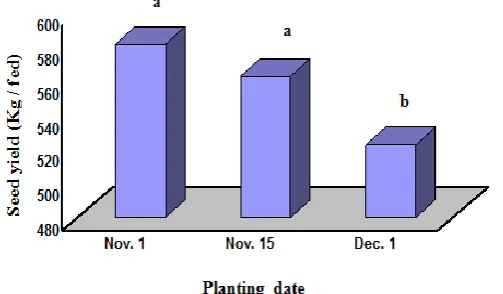
As seen in Table 5, the seed yield was significantly affected by planting dates and genotypes. The first planting date (Nov. 1) produced the highest seed yield (581.70 kg /fed), whereas the 3rd planting date (Dec. 1) produced the lowest seed yield (522.42 kg /fed). Based on the three planting dates data, seed yield was decreased as planting date delayed from 1st November to 1st December. This decrement equal to 59.38 kg/fed (Fig. 1). Mirzakhani (2002) reported a significant difference among seed yield in three sowing dates. Sowing time is a major agronomic factor affecting both seed and oil yield in safflower (Tomar 1995 and Gecgel et al
2007). Therefore, determining optimum sowing time and selecting suitable variety for growing regions are necessary to obtain safflower with high yield and quality. Heidari (2004) reported that postponing the sowing date in addition to temperature increase showed great effect on developmental stage from germination to flowering.
Fig. 1. Mean productivity (seed yield in kg/fed) under the three planting dates. Columns with the same letter are not significantly different at P=0.05 according to LSD test.
Reduction of seed yield at second and third sowing date compared to first sowing date was 3.24% and 10.19%, respectively. Early planting date resulted in the prevailing of optimum temperature for better flowering and pollination. When choosing a sowing date, attention must first be paid to the maturity of the variety. By contrast, in case of early flowering due to late planting, maximum growth and yield will not be achieved.
Alessi et al (1981) reported that delayed sowing shortened the growing season. Juknevicius and Pekarskas (2002) in two year study found that the highest seed yield was obtained in the earliest sowing date and was 2000 kg/ha. They observed that 9-18 day delaying in sowing, decreased seed yield by: 510-850 kg/ha. Similar results were reported by Ozel et al (2003), Ozbay (1994), Samanci and Ozkaynak (2003) and Nikabadi et al
(2008). These results also support our findings.
80
0 1 2 3 4
450 500 550 600 650
Y= 614.9 - 29.64 x R2 = 0.95
Planting date s (Nov. 1 , Nov. 15 and De c. 1)
S
ee
d
y
ie
ld
(k
g
/fe
d
d
a
n
)
Fig. 2. The relation between planting dates and seed yield which follows the linear equation: of Y=614.9 – 29.64 x
Significant differences were also observed among safflower genotypes for seed yield (Fig. 3). The highest seed yield (615.78 kg/fed) was recorded by entry No. 81 followed by entry No. 21 (569.39 kg/fed) which was not statistically different from Giza 1 (556.57 kg/fed). The lowest seed yield (513.66 kg/fed) was recorded by entry No. 45.
Fig 3. Comparison of mean seed yield (kg/fed) of the five safflower genotypes.
Columns with the same letter are not statistically different at the p=0.05 according to LSD test.
Environmental factors, especially temperature, are the key factor which influences plant growth and development. Significant differences among different genotypes for growing degree days (GDD) depicted that different genotypes have varying maturity periods. However, higher GDD accumulated for early planting during both seasons provided the clue that the best planting time of a particular crop is early planting to have good output. Environmental factors, especially temperature during the period of seed development and maturation, might have affected yield and yield attributes.
81
1500 1600 1700 1800 1900 2000 2100 2200
450 500 550 600 650
Y= 233.3 + 0.18 x R2= 0.86
Growing degree days
S
ee
d
y
ie
ld
(
kg
/f
ed
)
Fig 4. Relationship between growing degree days and seed yield (kg/fed) (means of six environments)
Oil and protein yield
Since oil yield equals to: seed yield × oil content, hence oil yield was also affected significantly by planting dates and genotypes (Table 5). Similar results were reported by Ozel etal (2003), Ozbay (1994) and Samanci and Ozkaynak (2003). Besids, Omidi and Sharifmogadas (2010) showed that late planting in safflower caused a significant decrease in seed and oil yields.
Statistically significant effect of planting date on oil yield was obtained which agrees with studies of Ozel et al (2004). Due attention to Table 5, the highest oil yield was achieved in 1 November planting date. In general results of this study showed that the first planting date produced the highest oil yield (185.80 kg/fed) and the third planting date had the lowest oil yield (166.39 kg/fed). But no significant differences were seen between first and second planting date. A deviation in the oil yield per feddan values is observed; this might be due to different planting dates, oil content, seed yield per feddan, genotypes and ecological conditions under which the experiments were carried out.
The minimum oil yield (164.56 kg/fed) was obtained from the commercial cultivar Giza 1. On the other hand, the highest oil yield (192.14 kg/fed) was obtained from genotype 21 (Table 5). Differences among genotypes for oil yield may be attributed to their genetic potential as well as interactive effects of environmental variables during seed development and crop physiological maturity. Also Mirzakhani (2010) reported that the effect of cultivar on oil yield was significant.
Linear relationship (Figure 5) between GDD and oil yield (kg/fed) was existed across the six environments and is a good support to the above findings.
1500 1600 1700 1800 1900 2000 2100 2200 150
160 170 180 190 200 210
Y= 76.88 + 0.06 x
R
2= 0.70
Growing degree days
O
il
y
ie
ld
(
k
g
/f
e
d
)
Fig 5 . Relationship between growing degree days and oil yield (kg/fed)
82 Protein yield was influenced by planting date (P≤0.01) and genotype (P≤0.05). The present study suggest that November 1 is the most optimum time of planting of safflower crop, because the crop sown on November 1 produced the maximum seed yield.
Genotypes evaluated in this study produced different amounts of protein yield (kg/fed). Genotype 21 produced the maximum (115.25 kg/fed) protein yield which was significantly different from genotype 45 and genotype 48 but statistically at par with the rest of the genotypes (Table 5). Egyptian local cultivar Giza 1 produced 113.64 kg/fed protein yield which was statistically at par with the genotypes (G 81 and G 21).
Seed-quality related traits
With respect to seed quality, effect of planting date on most qualities was significant. The results of analysis of variance showed a significant difference among safflower genotypes for protein, oil, and fatty acid contents of seed (Table 4). The values for oil and protein content (%), palmitic, oleic, linoleic and linolenic acid content of safflower genotypes are given in Table (6).
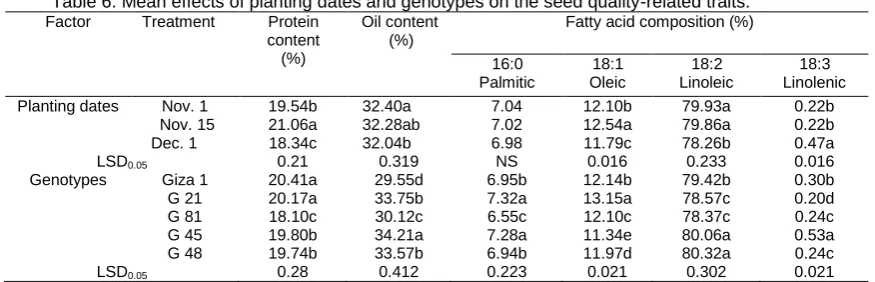
Table 6. Mean effects of planting dates and genotypes on the seed quality-related traits.
Factor Treatment Protein
content (%)
Oil content (%)
Fatty acid composition (%)
16:0 Palmitic
18:1 Oleic
18:2 Linoleic
18:3 Linolenic
Planting dates Nov. 1 19.54b 32.40a 7.04 12.10b 79.93a 0.22b
Nov. 15 21.06a 32.28ab 7.02 12.54a 79.86a 0.22b
Dec. 1 18.34c 32.04b 6.98 11.79c 78.26b 0.47a
LSD0.05 0.21 0.319 NS 0.016 0.233 0.016
Genotypes Giza 1 20.41a 29.55d 6.95b 12.14b 79.42b 0.30b
G 21 20.17a 33.75b 7.32a 13.15a 78.57c 0.20d
G 81 18.10c 30.12c 6.55c 12.10c 78.37c 0.24c
G 45 19.80b 34.21a 7.28a 11.34e 80.06a 0.53a
G 48 19.74b 33.57b 6.94b 11.97d 80.32a 0.24c
LSD0.05 0.28 0.412 0.223 0.021 0.302 0.021
Means followed by similar letter in the same column are not significantly different at 5% level of probability.
Seed protein content (%)
The effect of planting date on protein content was statistically significant (P≤0.01). The data regarding the seed protein content showed that there were significant differences in the quality of the five safflower genotypes tested under the varying climatic conditions of the three planting dates. Genotypes differed significantly in their protein content. The Egyptian commercial cultivar accumulated significantly higher protein (20.41%) than other genotypes except genotype 21 (20.17%) while genotype 81 gave the lowest (18.10%) protein content. Dajue and Mundel (1996) assessed safflower accessions from 52 countries for protein and amino acid composition. They found that protein ranged from 10 (Iran genotypes) to 26.1% (India and Turkey genotypes) with an average of 17.5%. Besides, protein content values obtained were different from those estimated on a whole seed basis (Bahlavani 2005 and Vorpsi et al 2010).
Seed oil content (%)
The results of analysis of variance showed a significant difference among planting dates and safflower genotypes for protein, oil and fatty acid contents of seed (Table 4).
Oil content of seeds is a very important economic trait for safflower cultivars and considered one of the most important factors affecting the success of safflower introduction in new areas (Bassil and Kaffka 2002). Oil contents and oil yield were affected significantly by genotypes (G), planting date (D) and (GxD) interaction in the present study. According to analysis of variance (Table 4), planting date affected significantly oil content (p ≤ 0.05). Data indicated that delaying planting date reduced oil content. Oil content is known to change depending on factors like cultivar, soil characteristics and climate (Rahamatalla et al 2001).
Significant differences among the planting dates were observed for oil content in our study. Crop planted on 1st of November accumulated the highest oil (32.40%) among the three planting dates. The least oil (32.04%) was gained by the crop planted on 1st of December, which was similar to the crop planted on 15th of November. In third date (1 December) oil content was reduced due to increasing temperature.
83 They observed that both varieties maturated early and oil content of them increased with an average with 6-7 % in the earliest planting date. Robertson et al (2004) indicated that increasing the temperature by 1 oC lead to decrease oil content by 1.7%. Rajput et al (1991) contributed decreasing oil content and increasing protein content to delaying planting date.
Positive linear relationship was obtained between heat units from flower initiation to harvesting and oil content % (Fig. 6). In that context, Hill and Knowles (1968) noticed that the weight of safflower seed increased most rapidly during the first 15 days after flowering, and reached maximum weight in about 28 days. They claimed that oil content increased 5-10 fold in the period 10-15 days after flowering.
475 500 525 550 575 600 625
30 31 32 33 34 35
Y= 29.53 + 0.004 x
R
2= 0.16
Heat units
O
il
c
o
n
te
n
t
%
Fig. 6. Relationship between heat units and oil content
The oil content and fatty acids composition of the examined safflower genotypes differed from each other. Safflower genotypes showed statistical differences on the basis of oil content (p≤0.01). According to Table 6, the lowest oil content of 29.55% was obtained from the commercial cultivar Giza 1. On the other hand, the highest oil content was obtained from genotypes 45 and 21 (34.21 and 33.75%, respectively), which is related to genetic potentiality of genotypes 45 and 21. The differences among genotypes were significant.
Oil content of safflower cultivars from differentproduction areas of the world was ranged from 26.72-35.78 % in Greece(Koutroubas and Papadoska 2005), 26.3-28.5 % in rainfed vertisols (Gawand et al 2005), 31.3-36.3 % in Turkey (Arslan and Kucuk 2005) and 31.26-33.4% in Albania (Vorpsi et al 2010). Evaluating our results of oil content measurements, it can be established that our results are in accordance with those of previous reports.
Fatty acid composition
Oil quality is a significant concern of consumers, particularly for the contents of oleic and linoleic acids which are proven as healthy sources of oil for human body. Safflower is thought to be one of the highest quality vegetable oils and its oil consists of mainly palmitic, stearic (in a very low percentage), oleic and linoleic acids. The two healthy unsaturated components (i.e. 18:1 and 18:2) represent more than 92% of the fatty acid composition (Table 6).
Thus, the quality of safflower oil is generally associated with the relative concentration of oleic and linoleic acids. A probable reason for low and high palmitic acid concentration in oil of different safflower genotypes may be due to the effect of temperature during the physiological maturity stage. Due to high linoleic acid the safflower oil is also being valuable in various types of industry (Eren et al 2005).
Apparently, genotype and sowing time where it is planted are important factors affecting fatty acid composition of safflower oil. That climatic conditions, particularly temperature during growing season and development stages of seed, changed composition of fatty acids was indicated by Lajara et al (1990) and Nagaraj and Reddy (1997). Depending on high or low temperatures, fatty acids affect positively and negatively on each other (Hamrouni et al 2004). Gecgel et al (2007) reported that there was an inverse relationship between the development of the C18:1 and the C18:2 acids.
84 of linolenic acid
.
No significant differences were observed in different planting dates for palmitic acid. Planting dates significantly affected linoleic acid. The crop planted on 1st of November gave the highest (79.93%) linoleic acid, which was significantly different from the third planting date. The lowest (78.26%) linoleic acid concentration was observed in the crop planted on 1st of December.Ahmad and Hassan (2000) reported that oleic acid of sunflower increased with increasing maturity temperature. The probable reason for the increase and decrease of oleic and linoleic acid of different safflower genotypes may be due to the effect of temperature and moisture during the growing season (Fig.7 and 8). However, Roberston (1981) reported that linoleic acid content varied inversely with the oleic acid content. In that context, Hill and Knowles (1986) reported that the expression of the genes governing differences in fatty acid composition began about 10 days after flowering. One of the earliest study on the effects of temperature on the fatty acid compositions was done on three safflower genotypes in California, USA (Bartholomew 1971).
Positive linear (Fig. 7) relationship was computed between oleic acid and heat units. By contrast, negative linear relationship (Fig. 8) between linoleic acid and heat units was computed in the period from flowering to maturity. It is obvious that the increase in olic acid concentration was corresponded with a decrease of similar magnitude in linoleic acid concentration. Bartholomew (1971) observed in three safflower genotypes that either the high or the low linoleic types was down slightly and oleic acid was up at a corresponding amount with the increase in temperature during oil synthesis and until physiological maturity. Our data support that earlier data. Inverse relationship between oleic and linoleic acid are supportive to earlier findings. Note that, b value in our data was positive (b= 0.004) for oleic acid while it was negative by a similar magnitude (b= - 0.005) for linoleic acid.
475 500 525 550 575 600 625
11 12 13 14
Y= 10.11 + 0.004 x R2= 0.16
Heat units
O
le
ic
a
c
id
%
Fig. 7. Relationship between heat units and oleic acid
Fig. 8. Relationship between heat units and linoleic acid
Samanci and Ozkaynak (2003) reported that seed yield, oil content, palmitic acid, stearic acid, and oleic acid contents decreased as linoleic acid content increased from 50.86 to 55.72% with delay in planting dates. The effect of genotype on fatty acids was greater than that of environment. They reported that increase in
L
ino
leic
a
85 climate temperatures resulted in a decrease of linoleic and linolenic acid synthesis and increase in oleic acid synthesis. Dajue and Mundel (1996) reported the means of fatty acid content of lines of different origin as palmitic acid 7.1%, stearic acid 3.2%, oleic acid 21.5% and linoleic acid 67.4%.
Fatty acid composition for safflower has been determined by a couple of genes (O/ol). High linoleic (75-80 %) and low oleic acids (10-15 %) have been determined by the gene pair OlOl, while the gene pair olol has determined low linoleic acid (12-30 %) and high oleic acid (64-83 %) (Baydar 2000). Based on the results of the present study, it may be speculated that all genotypes under study are homozygote dominant (OlOl) in terms of fatty acid composition.
Environmental factors such as soil and climatic ones have played an important role in change of fatty acid composition and temperature is the most important factor affecting fatty acid composition (Baydar and Turgut 1999). Oleayl-PC desaturaze and linoleayl-PC desaturaze enzymes have converted oleic acid to linoleic and linoleic acid to linolenic acid, respectively. The activities of both enzymes have been decreased by high temperatures resulting in the decrease in linoleic and linolenic acids synthesis and the increase in oleic acid synthesis (Pleines and Friedt 1989). In the light of these findings, it can be concluded that an increase in temperature promotes a higher synthesis of oleic acid but a lower synthesis of linoleic acid. This is in harmony with the present results.
The statistical evaluation of the fatty acid composition of safflower seeds was given in Table (6). Palmitic acid of safflower genotypes ranged from 6.55% in genotype 81 to 7.32% in genotype 21. Oleic acid content showed the highest variation in the studied genotypes. Oleic acid ranged from 13.15 (genotype 21) to 11.34% (genotype 45). Linoleic acid content varied from 78.37% in to genotype 81 to 80.32% in No. 48 genotype.
The ranges of 6–8%, 16–20% and 70–75% for palmitic, oleic and linoleic acids, respectively, for safflower cultivars have been reported by other workers such as (Fernandez-Martinez et al 1993, Johnson et al 1999 and Cosge et al 2007). These discrepancies in protein, oil and fatty acid composition of seed of the safflower genotypes reported here and elsewhere were mainly due to the genes and environmental effects that could jointly influence these traits in safflower (Knowles and Ashri 1995). Further research to resolve these discrepancies is needed to understand the direction of gene effects on the one hand, and the knowledge of interplay between the genes and environments on the other. The high variation observed for the biochemical traits of the seed of safflower genotypes could be attributed to the influences of these traits by the genotype used, the prevailing environment and their interactions (Cosge et al 2007).
Thus, we performed oil analyses to determine the content of afore mentioned fatty acids in the present study. The genotypes 21 and 48 showed the highest content of oleic (13.15%) and linoleic (80.32%) acids could be considered as good material for oil quality improvement of safflower. More studies are needed to model the impact of intra-and inter- seasonal variation on yield and quality of safflower genotypes from diverse origins.
CONCLUSION
The results from the present study indicated that seed, oil, protein yield and seed quality-related traits of safflower have been affected significantly by the genotypes and growing conditions under different planting dates. To have good output in terms of yield and yield characteristics, GDD accumulation plays a vital role in modeling safflower to the expected global warming in the years to come. Differencesamong various safflower attributes might be due to thedifferent climatic conditions that are based on temperature prevailing during the crop life cycle. It is therefore, concluded on the basis of the above mentioned results that late planting of safflower would resultin reduction of seed and oil yield along with yieldattributes as the crop completes its life cycle in shortduration, accumulating less heat units.
REFERENCES
Ahmad S, Hassan FU. 2000. Oil yield and fatty acid composition of spring sunflower. Pakistan J. Biological Sciences3:2063-2064. Ahmad G, Quresh Z, Iqbal A. 2001. Response of sunflower hybrids to different planting dates at Peshawar Valley. Sarhad J. Agric. 17:
561-564.
Alessi J, Power JF, Zimmerman DC.1981. Effects of seeding date and population on water-use efficiency and safflower yield. Agron. J. 75: 783-787.
Alizadeh K.2005. Evaluation of safflower germplasm by some agronomic characteristics and their relationships on grain yield production in the cold dry land of Iran. Int. J. Agri. Biol., 7(3):389-391.
Allard RW, Bradshaw AD. 1964. Implications of genotype-environment interaction in applied plant breeding. Crop Sci. 4:503-507. AOAC.1990. Official method of analysis. Association of Official Analytical Chemist, (AOAC). Washington DC. USA.
Arslan B, Kucuk M. 2005. Oil content and fatty acid composition of some safflower cultivars in Van (Turkey). VIth International Safflower Conference, Istanbul 6-10 June 2005: 167-175.
86
Bahlavani MH.2005. Some technological and morphological characteristics of safflower (Carthamus tinctorius L.) from Iran. Asian J. of Plant Sci. 4 (3): 234-237.
Bartholomew SB.1971. Temperature effects of the fatty acid composition of developing seeds in safflower, Carthamus tinctorius. Thesis, University of California.
Bassil ES, Kaffka SR. 2002. Response of safflower (Carthamus tinctorius L.) to saline soils and irrigation: I. Consumptive water use. Agric. Water Manag. 54: 67- 80.
Baydar H.2000. The oil synthesis, the quality and the importance of the breeding for improved quality in the plants. Ekin. 4:50-57.
Baydar H, Turgut I.1999. Variations of fatty acid composition according to some morphological and physiological properties and ecological regions in oilseed plants. Turkish J. Agric. Forest. 23: 81-86.
Connor DJ,. Sadras VO.1992. Physiology of yield expression in sunflower. Field Crops Research30: 333–389.
Cosge B, Gurbuz B, Kiralan M.2007. Oil content and fatty acid composition of some safflower (Carthamus tinctorius L.) varieties sown in spring and winter. Int. J. Nat. Eng. Sci. 1:11–15.
Dadashi N, Khajehpour MR.2004. Effects of temperature and day length on developmental stages of safflower genotypes under field conditions. J. of Crop Prod. and Proce. 7(4): 83-102.
Dajue L, Mundel HH.1996. Safflower. 7. Institute of Plant Genetics and Crop Plant Research, Gatersleben/International Plant Genetic Resources Institute, p. 83, Rome, Italy.
Demurin YA, Skoric D, Veresbaranji I, Joric S.2000. Inheritance of increased oleic acid contents in sunflower seed oil. Helia 23: 87-92. Dwyer LM, Stewart DW.1986. Leaf area development in field grown maize. Agron. J. 78: 334-343.
Eren KD, Başalma S, Er Uranbey C.2005. Effect of growing in winter and spring on yield components and quality of some safflower (Carthamus tinctorius L.) cultivars in Ankara. VIth International Safflower Conference, Istanbul 6-10 June : 154-161.
Esendal E. 1997. Agro-physiology outlook on safflower. In, Proceedings of the 4 th
International Safflower Conference. Ed. A. Corleto and H. H. Mundel. Bari, Italy. 2-7 June, pp:155-163.
Fernandez-Martinez JM, Rio M, Haro A.1993. Survey of safflower (Carthamus tinctorius L.) germplasm for variants in fatty acid composition and other seed characters. Euphytica 69:115-122.
Freed R, Einensmith SP, Gutez S, Reicosky D, Smail VW, Wolberg P.1989. User’s Guide to MSTAT-C Analysis of Agronomic Research Experiments. Michigan State University, East Lansing, U.S.A.
Gawand PB, Tambe SI, Reddy BN.2005. Evaluation of productivity of safflower cultivars under moisture and nutrient management in rainfeed Vertisols. VIth International Safflower Conference, Istanbul 6-10 June :205-209.
Gecgel U, Demirci M, Esendal E.2007. Fatty acid composition of the oil from developing seeds of different varieties of safflower (Carthamus tinctorius L.). J. Amer. Oil Chem. Soc. 84: 47-54.
Golkar P, Arzani A, Rezaei AM.2011a. Genetic variation in safflower (Carthamus tinctorious L.) for seed quality-related traits and inter-simple sequence repeat (ISSR) markers. Int. J. Mol. Sci. 12:2664-2677
Golkar P, Arzani A, Rezaei AM.2011b. Determining relationships among seed yield, yield components and morpho-phenological traits using multivariate analyses in safflower (Carthamus tinctorious L.). Annals of Biol. Res. 2 (3):162-169.
Hamrouni I, Touati S, Dhifi W, Chahed T, Ayachi S, Salah H, Marzouk B.2004. Glycerolipid evolution during safflower seed formation and ripening. J. Food Lipids 11:297-311.
Heidari ZP.2004. The effect of temperature and day length on safflower generative and reproductive growth (Kuseh cultivar). M.Sc. Thesis., Industrial University of Isfahan. (In Persian)
Hill AB, Knowles PF. 1968. Fatty acid composition of developing seeds of different varieties of safflower. Crop Sci. 8: 275-277. Huang KC.1993. The Pharmacology of Chinese Herbs. Bacaraton CRC, press, pp:344.
Johnson RC, Bergman JW, Flynn CR. 1999. Oil and meal characteristics of core and non-core safflower accessions from the USDA collection. Genet. Resour. Crop Evol. 46: 611–618.
Juknevicius S, Pekarskas J.2002. Influence of safflower (Carthamus tinctorius L.) sowing time on seed yield, chemical composition, yield structure, growth and development. Agriculture Scientific articles (4) 80:50-59
Kaleem S, Hassan FU, Saleem A.2009. Influence of environmental variations on physiological attributes of sunflower. Afr. J. Biotechnol. 8: 3531-3539.
Knowles PF, Ashri A.1995. Safflower Carthamus tinctorius (Compositae). In Evolutionof Crop Plants, 2nd ed.; Smartt, J., Simmonds, N.W., Harlow. K., Eds.; Longman: Harlow, UK, :47–50.
Koutroubas SD, Papakosta DK. 2005. Adaptation, grain yield and oil content of safflower in Greece. VIth International Safflower Conference, Istanbul 6-10 June :161-167.
Lajara JR, Diaz U, Diaz Q. 1990. Definite influence of localization and climatic conditions on fatty acid composition of sunflower seed oil. J. Am. Oil Chem. Soc. 67:618-623.
Mirzakhani M. 2002. Effects of planting date on yield and yield components of spring safflower cultivars in Markazi province. Iran J. Agric. Sci. 4: 138-151.
Mirzakhani M. 2010. Comparison of oil yield and some agronomic traits of pre-chilled spring safflower cultivars with winter cultivars. Plant Sci. Res. J., 23 (3):43-55.
Nagaraj G, Reddy PS.1997. Some factors influencing safflower seed and oil quality. International Safflower Conference Bari, Italy pp:347-349.
Nikabadi S, Soleimani A, Dehdashti SM, Yazdanibakhsh M. 2008. Effect of sowing dates on yield and yield components of spring safflower (Carthamus tinctorius L.) in Isfahan region. Pak., J. of Bio. Sci. 11 (15):1953-1956.
Omidi AH, Sharifmogadas MR.2010. Evaluation of Iranian safflower cultivars reaction to different sowing dates and plant densities. World Applied Sciences Journal 8 (8): 953-958
Ozbay D.1994. The effect of sowing date on yield and yield characters of varieties of safflower (Carthamus tinctorius L.).www.Ozbay Dede.com.
Ozel A, Demirbilek T, Copur O, Gur A, Tarihi G.2003. The effect of different sowing date and intra-row spacing on petal yield and some agronomic characters of safflower (Carthamus tinctorius L.) under the Harran Plain arid conditions. J. Agric Fac. HR. U. 8 (3/4):1-7.
Ozel A, Demirbilek T, Gur A, Copur O.2004. Effects of different sowing dates and intra-row spacing on yield and some agronomic traits of safflower (Carthamus tinctorius L.) under Harran PlainÕs arid conditions. Turk. J. Agric. 28:413-419.
Pleines S, Friedt W.1989. Genetic control of linolenic acid concentration in seed oil of rapeseed (Brassica napus L.) Theor. App. Genet. 78: 793-797.
87
Rajput RL, Sharma MM, Verma OP, Chauhan DVS.1991. Response of rapeseed (Brassica napus L.) and mustard (Brassica juncea) varieties to date of sowing. Ind. J. Agron. 36: 153-155.
Ritchie JT, Ne Smith DS.1991. Temperature and crop development. In: J. Hanks and J.T. Ritchie (eds.). Modeling Plant and Soil Systems. Amer. Soc. of Agron., Madison, Wis., USA p. 5-29.
Roberston JA.1981. Effect of planting date on sunflower seed oil content, fatty acid composition and yield in Florida. J. Am. Oil. Chem. Soc. 58: 698-701.
Robertson MJ, Holland JF, Bambach R. 2004. Response of canola and Indian mustard to sowing date in the grain belt of north-eastern Australia. Aust. Expet. J. Agric. 44: 43-52.
Sabale E, Deokar RR.1997. Influence of sowing dates on yield attributes of two safflower varieties. Annals of Plant Physiology 11:6-9. Sadras VO, Hall AJ.1988. Quantification of temperature, photoperiod and population effects on plant leaf area in sunflower crops. Field
Crops Research 18: 185-196.
Samanci B, Ozkaynak E.2003. Effect of planting date on seed yield, oil content and fatty acid composition of safflower (Carthamus tinctorius) cultivars grown in the mediterranean region of Turkey. J. of Agron. and Crop Sci. 189 :359-362.
Smith PF.1962. Mineral analysis of plant tissues. Ann. Rev. Plant Physiol. 13: 81-108. Snedecor GW, Cochran WG.1983. Statistical Methods (Sixth ed.). Oxford and IBH, New Delhi.
Steel RGD, Torrie JH, Dickey DA.1997. Principles and Procedures of Statistics: A Biometrical Approach. 3rd ed. McGraw-Hill, New York. Tomar SS.1995. Effect of soil hydrothermal regimes on the performance of safflower planted on different dates. J. of Agron. and Crop Sci.
175:141-152.