Volume 31, 2011
56
THE CHARACTERISTIC FREQUENCY
BANDS ANALYSIS OF BRAIN WAVE
DURING LEARNING
Fu-Chien Kao, �ei-�e �i, �an-Chieh ��ien, Chih-�un�� �an���ei-�e �i, �an-Chieh ��ien, Chih-�un�� �an�� DAYEH University, Taiwan E-mail: [email protected], [email protected],
[email protected], [email protected]
Ab�tract
The traditional E-learning often offers the online examination to assess the learning effect of a student after completion of the online learning. Basically, this traditional learning assessment mechanism is a passive and negative assessment mechanism, which cannot provide an real-time learning warning mechanism for teachers or students to find out problems as early as possible (including such learning conditions as “absence of mind” resulting from poor learning stage or physical or psychological factor), and the post-assessment mechanism also cannot assess the learning effectiveness provided by the online learning system. This research paper attempts to acquire the electroencephalogram to analyze the characteristic frequency band of the brainwave related to learning and formulate the learning energy index (LEI) for the learner at the time when the learner is reasoning logically via the brain-wave detector based on the cognitive neuroscience. With the established LEI, the physical and psychological conditions of an online leaner can be provided instantly for teachers for assessment. Given that the learning system is integrated into the brainwave analytic sensing component, the system not only can provide learners an instant learning warming mechanism, but also help teachers and learning partners to further understand the causes of learning disorder of learners, and can also provide relevant learning members with timely care and encouragement. This research will discuss and analyze such subjects as the electroencephalogram difference between the traditional print textbooks and the multi-medium textbooks, whether the development of exercise habit will be help to learning by means of a view of cognitive neuroscience except for the analysis of characteristic frequency band of the brainwave represented at the time when learners adopt diverse learning methods.
Key words: cognitive neuroscience, electroencephalogram, learning energy index.
Introduction
57 ���� �� h���� ����e�st������� �������es ���� e���ess��� th���hts ���� �ee����s ��� �������es�� the ���� �� ����e�st������� ����es ���� �e�e��t��� c��sc���s�ess�� th���hts ���� �ee����s�� the ���� �� �e������ �e� �����e���e�� �e�s����� ���� j��������� s������ �����e�s�� est����sh��� ���� ����e�e�t��� ����s�� �h�ch ��e the �s��ch�����c�� �ct���t�� c��se�� ��� the ��te����e�t �ech���s� �� �����.
c����t��� �e��s th�t the ��e�� ��e�e����e�t �� ������������s �s c��se��� �e��te�� t� �����e���e�� �e������ ���� ��te����e�ce�� ���� ��st �e t���s��tte�� ��� ����� ���� �e�t�� �ct���t�es. the c����t��e �s��ch�����sts e��h�s��e�� th�t �e������ �s � ���cess �� ���t��t��e��� �ece�����s e��h�s��e�� th�t �e������ �s � ���cess �� ���t��t��e��� �ece����� e��h�s��e�� th�t �e������ �s � ���cess �� ���t��t��e��� �ece������� th�t �e������ �s � ���cess �� ���t��t��e��� �ece����� th�t �e������ �s � ���cess �� ���t��t��e��� �ece������e������ �s � ���cess �� ���t��t��e��� �ece����� �ess��es ���� c�e�t��e th�������� ���� ������ th�t the �����t��� �� h���� c����t��� c����� �e c��s���e�e�� �s � ���cess �� ���cess��� ���t� ��� c����te�. the�� �tte��te�� t� �se the h���� �����the�� �tte��te�� t� �se the h���� ����� t� s�����te the ��e��t��� ���� �� c����te��� ��e� ������������s �s � ���t� ���cess��� s��ste��� �h�ch c�� �ct��e��� se�ect �ess��es �e�e��te�� ��� e�������e�t ���� c�� ���cess ���� st��e ���the� th����h �e�t�� �ct���t�es s� �s t� �e �e����� ��� �������t��� �et��e��� ���� e�t��ct��� �he� �eq���e��. thethe �e�e���t �������t��� ���cess ����e �s �s sh��� �� f����e 1 �at���s���� �� sh������� 1����� ����e�� �at���s���� �� sh������� 1����� ����e�� 1��5�..
Fi��ure 1: Information proce��in�� model.
c��s�st��� �� �e������ c������� ���� �the� s�ste�t�c���� ce��s�� the ce�e���� s�s�e���s �� the ce�e���s����� ������ �� the c������ c���t�� ���� �s the ��st st����e�t ������e�� �����. the ce�e���� �s ��s� c��s���e�e�� �s the ce�t��� �e����s s��ste��� �h�ch �s the se�s����� c��t������� ��� th������ ���� �ece��es �ess��es �e�e��te�� ��� the e�te���� e�������e�t s� �s t� ���e ��t c�������s �e��te�� t� ������s �ct���t�es ���� e�te���� �eh�����s th����h the ��te���t��� �� the �e���� s��ste� �� the ce�e���� ���� the c����e� th���hts ���� �ct���s �� the �����. i� �ece�t ��e��s�� ��th the ������ ��e�e����e�t �� the �e���c�� tech������es ���� the ������e�e�t �� the ��etect��� ��st���e�ts�� ��� ���ts �� the ce�e���� ���� the�� �e�e���t ���ct���s h��e �ee� ���the� �����. th����h ��se���t��� �� the ���ct��� ���� the se�s���� �e�ce�t��� �� the ������� �e c�� ���� th�t e�e��� ���t �� the ����� c��t���s � �����e�e�t t�s�. the �e�e���t ���ct����� ���ts �� the ����� c��t��� the ����et�� ���e�� the �cc���t�� ���e�� the te������ ���e ���� the ����t�� ���e�� �� �h�ch the ����et�� ���e �s ��c�te�� �t the t�� �� the he��� ���� the �ec����t��� ce�te� �� the ���es�� ���� the �ee������ the �cc���t�� ���e �s ��c�te�� �t the ��te� ����� ���� �es���s���e ��� the ��s��� �ec����t��� ���� �e��te�� t� the �����t�es �� ����� �ec����t��� ���� �e��et��� �e�������� ���� the ����t�� ���e �s ��c�te�� �t the ���ehe��� ���� �es���s���e ��� ��t��� c��������t����� th������ ���� j�����e�t ���� �����e� s������ ���� �s the c�������e� �� ch�e� �� the �����..
Volume 31, 2011
58 � ���ct����� �e���sc�e�ce ��� ��te��e������ �������t��� t���s��ss��� ���� c������c�t��� �he� the c����t��e �eh����� �� the ����� �s �ese��che��. W�th the ��e�e����e�t �� the �e���sc�e�ce�� tech������es ���� ��st���e�ts ��� �ese��ch �� h���� ����� h��e �ee� s������c��t��� ������e�� �� �ece�t ��e��s. sc�e�t�sts �se ������ce�� ��st���e�ts s�ch �s ����et�c �es����ce ������� �mri��� �es����ce ������� �mri����mri���mri��� ���ct����� ����et�c �es����ce ������� �fmri��� c����te���e�� t�������h�� �ct��� ��s�t��� e��ss��� t�������h�� �pet��� ����et� e�ce�h�������h�� �me���� e�ect��e�ce�h������� �ee���� etc. t� e�����e the ce�e���� �ct���t�es s� th�t �ese��che�s c�� ���the� ���� the �e��t���sh�� �et�ee� ����� ���� �e�t�� �ct���t�es�Je�se��� 200�� �he� h���� �s c�������� ��t � s�ec��� �ct���. the �����c�t��� �� the e�ect��e�ce�h������� �� the h���� ������ �s ���������te��� 40 ��e��s e����e� th�� the me�. the e�ect��e�ce�h������� �s ������� �se�� ��� �ec������� the ��te�t��� �����e�e�ce �� the ������� ���� the me� �s �se�� ��� �ec������� the ����et�c ��e��� �� the �����. b�th �� the� ��e ��te� �����e�� ��� e������t��� �� the ��te�t��� e�c�te�e�t s���ce �� the �����. the e�ect��e�ce�h������� �s ch���cte���e�� ��� �������s��e �e�s��e�e�t�� ���-������t����� h��he� t��e �es���t����� t���s����t�����t�� ���� ��� c�st�� s� th�s �ese��ch �����ts the e�ect��e�ce�h������� t� st����� �ts ch���cte��st�c ��eq�e�c�� ������.
Electroencephalo��ram Mea�urement
the e�ect��e�ce�h������� �s the e�ect������et�c s����� �e�e��te�� ��� the �e���� �ct���t�es �� the ������� �h�ch �s the �ess��e t���s��tte�� ��� the c������ �e��e �s��� the e�ect��che��c�� ���cess. the �e��es c���e�t the che��c�� s����� ��t� the e�ect��c s����� th����h �e�e�se �� the che��c�� s��st��ce. these e�ect��c s�����s ��e ������� �e�e��te�� ��� the ��� �e��e�����t��. the �e����s c��s�st��� �� �e��es ��e ce��s s�ec������ ��� t���s��tt��� e�ect��c s�����. the �e����s ���� ������ce the �ct��� ��te�t��� t� t���s��t �ess��e �he� the �ece�t��s �� the ce�� s����ce h��e �ece��e�� the �e���t���s��tte�s. d���e�e�t st�����t���s ���� h��e �����e�e�t t���s��ss��� s�����s. rh��th��c ��te�t��� ch���es ���� �cc�� �he� the �e��e �����se �s t���s��tte�� �et�ee� the �e��es ���� the �e��e ���e�s. these �e�� ��te�t��� ch���es c��s�st �� the e�ect��c�� �h��th�s ���� the t���s�e�t ���sch���e. it �s the s�-c���e�� e�ect��e�ce�h������� �he� these �e����s �e�e��te the �es��t��t ��te�t��� ch���es.
the e�e���� �� e�ect��e�ce�h������� �ct��� �s ��� �ess th�� �the� �s��ch�����c�� s�����s �� the h���� ������ �e.�. e�ect��c���������� ���� e�ect������������� s� �t �s ������c��t t� �ec���� the e�ect��e�ce�h�������. the ���� �e�s�� �s th�t �ts s����� �s s� �e�� th�t the �e�s�����e brainwave is about 1 to 100μV and the frequency range is from 0.5 to 100Hz �J. �. We�ste��� 1���� �he�
the ��������e s�����s ��ss th����h the �e����es�� the ce�e���s����� ������ ���� s���� ���� �e�ch the sc���. the e�ect��e�ce�h������� ��s�c����� h�s the s���ch������t����� ���� ���� �e ���ecte�� ��� �����e�e�t ������ st�tes ���� ��s� h��e �����e�e�t ch���cte��st�cs �� �����e�e�t s�ee���� �e�����s. the e�ect��e�ce�h������� �s c��t�����s��� �e�e��te�� ���� st��� �ee�s �ct��e e�e� �� � �e�s�� �s �� � st�te �� ��c��sc���s�ess �� ������� �s�ee�.
59 st�����s. bec��se the ������ �t th�t t��e �s �� � �e����s st�te�� ���� �s �e����� ��� �es���se t� the ��ts���e �t ���� t��e. u���e� th�s c�����t����� the c��s���t��� �� the �h��s�c�� st�e��th ���� the psychic energy is more intensified. The θ wave has a frequency between 4Hz and 8 Hz. �e�e������ s�e������� �ts �����t���e �s ���e�. th�s ���e ��te� ���e��s �� the ����et�� �e���� ���� te������ �e���� �� the ch�����e��� ���� ���� �cc�� �he� the e��t��� �� �����t �s s����esse�� �� the c��sc���s�ess �� � �e�s�� �s ��te����te���� the ������ �s �e���e�� �� �� the c�se �� �e���t�t���. i� addition, the θ wave is also found in many patients suffering from brain disease. The δ wave h�s � ��eq�e�c�� �et�ee� 0.2h� ���� 4h�. it ���� �ec��e ���e ������s �he� �e���e ���� �s�ee� ��ee���� �� ����es ���� �s�ee��� ���� ��t�e�ts s���e���� ���� se�e�e ������c ����� ���se�se. th�s ���e �s ������� ������ �� the �cc���t�� �e���� �� the ch�����e��� ���� the ����t�� �e���� �� the �����ts. f�� �e�e���t ���ct����� ���ts �� the ������� �e�e� t� f����e 2 �h��� 1��1�.
Fi��ure 2: Four functional area� of the brain.
the ��������e �e�s��e�e�t �s ��s�c����� �������e�� ��t� the ��������� t���e�� the ��e���e t���e ���� the ������� t���e. the ��s�t��� �� the e�ect����es ��� the ��������e �e�s��e�e�t h�s � ����ect �����e�ce �� �����t���e�� �h�se ���� ��eq�e�c�� �� the ��������e s������� s� the ��������e s�����s �e�s��e�� �t �����e�e�t e�ect����e ��s�t���s c����t �e c�����e�� ��th e�ch �the�. the i�te���t����� fe��e��t��� �� s�c�et�es ��� e�ect��e�ce�h�������h�� ���� c����c�� ne����h��s������� est����she�� � set �� 10-20 e�ect����e s��ste�. the t�� ��e� �� the �e�e���t e�ect����e ��s�t���s ��e �s sh��� �� �����e 3 �sch����� 1����. the ���st��ce �et�ee� e�ect����es �s ����e�� �� �cc������ce ��th the he��� st��ct��e. s��e �� ����s ��e �� the ��s����� the ����� ���� the ��st����. the ce�t��� ���e ���� the ��s��� t� the ����� �s �e��e����c���� ��th the ���e �� the ��st���� �t the ����t �� c�. the ���st��ce �� e�ch e�ect����e ����t �s s��ce�� ��se�� �� 10% �� 20% �� the �e�t�c�� ���� h������t�� �e��ths �� the he��� c��c���e�e�ce. e�ch e�ect����e ����t �s e���esse�� ��� the c������t��� �� �ette�s ���� �����ts. the ���st �ette� a �e��ese�ts the e�����e�� c �e��ese�ts the ce�t��� s��c�s �� the ����t�� ���e�� p �e��ese�ts the ����et�� ���e�� f �e��ese�ts the ����t�� ���e�� t �e��ese�ts the te������ ���e ���� o �e��ese�ts the �cc���t�� ���e. i� the sec���� ���ce �s �� e�e� ����e��� �t �s �� the ���ht ce�e������ ���� �� �� ����� ����e��� �t �s �� the �e�t ce�e����. i� the sec���� ���ce �s the �ette� Z�� �t �e��s the e�ect����e ����t �s ��c�te�� �� the ce�t��� ���e �� the ��s��� t� the �����. f�1 ���� f�2 ��e �es�ect��e��� ��c�te�� �� the �e�t ���� ���ht ����t�� ���e.
Volume 31, 2011
60 ��t ���� the� the ��ss�����t�� �� s���t���s sh��� �e ��t ��������. i� the ��te��e�e�ce c����t �e ������e�� ���e t� e�te���� ��ct��s�� the ���te� �� ���t��t��� ���ct��� sh��� �e �����e�� t� the h�������e ���� the s��t���e se����te��� t� e������te s�ch �����e�ce. th�s �ese��ch �����ts � s����e the�e-e�ect����e �e�s��e�e�t t� c����� ��t the �����c�t��� st����� �� �e�e���t ��������es ��se�� �� the c��s���e��t���s �� the t���s����t�����t�� ���� ��e�e����e�t�� etc.
Fi��ure 3: T-20 �tandard electrode International �ocation.
�e�i��n of EEG Mea�urin�� Module
W�th the c��t�����s ������e�e�t �� ��te���� tech������� ���� �e�s����� tech��������� the �e�s����� tech������� �� the ��������e h�s �ee� �cce�e��te�� �� �ece�t ��e��s. a �e���c�� �����e e�ect��e�ce�h�������h�� h��e�e��� �s h��e�� e��e�s��e ���� c�����c�te�� �� ���cess��� s�����s �� the ��c�e���. the�e���e�� �t �s �eq���e�� th�t the ��e��t��� sh��� �e c����e�� ��t ��� ����ess����� st��� ������� the �e�s��e�e�t. the ��������e �e�s����� ������e �����se�� �� th�s �ese��ch �s sh��� �s �� �����e 4�� �h�ch �s ��t ����� s���� �� s��e�� c���e��e�t t� c����� ���� e�s�� t� ��e��te ��t ��s� �s ��� �� ���ce�� ���� �s �����c���e t� �e��� �se�� �� ������s �����st��es �� the ��t��e c�����e�� t� the �e���c�� �����e e�ect��e�ce�h�������h. th�s �ese��ch �ses � s����e ������� s��ste� t� �e�s��e the ��������e. the �e�e���t e�ect����e ��s�t���s ��e �es�ect��e��� �� the ���ehe��� ���� the ���e� e�����e ���� �se�� ��� �ec������� s�����s �t f�1�� f�2�� a1�� etc. �� �h�ch the a1 �s the �e�e�e�ce ��te�t���. the �e�s����� ��s�t���s ��e �s sh��� �� f����e 5
61 Design of Brainwave Measuring Circuit
d����� �e�s��e�e�t�� h��� �� the he��� ���� ��e�e�t the e�ect����es ���� �e��� st�c��� s� �t �s ������c��t ��� the ���t�c����ts t� st�c� the e�ect����es �� the sc���. the�e���e�� the �e�s��e�e�t �� e�ect����es �s c����e�� ��t �t ��s�t���s �� the ���ehe��� f�1 ���� f�2 ���� the ���e� e�����e a1. a1 �s �se�� �s � �e�e�e�ce ��te�t���. a� �s���t��� �e�s��e sh��� �e t��e� s� �s t� ������ e�ect��c sh�c� ���e t� the e�ect��c �e����e �� the ���e� s������ �� ��st���e�t. the ���c� �������� �� �e�e���t ��������e �e�s����� c��c��t ���� the ��������e se�s�� ������ ��e ��esc���e�� �� �����e � ���� �����e 7. the ��e�������e� �ses the ��st���e�t �������e� t� c��t��e the �ect�� s����� �� the e�ect��e�ce�h������� �s the ��������� s����� ��th � �������c�t��� �� 50�� ���� �ses the Jfet ��e��t����� �������e� t� ��c�e�se the ���e����ce ��tch �et�ee� e�ect����es ���� c��c��t. the �s���t��� c��c��t �s �se�� ��� se����t��� s�����s ���� ���e� s������ s� �s t� ���tect the c��c��t �����st ������e. o�t�c�� �s���t��� �� t���s����e� �s���t��� �s �s������ �����te��. the ���������th �� the �����-��ss ���te� �s set �s 1h� t� 20h��� �� �h�ch the �����se �s t� sc�ee� ��t the ���� ��eq�e�c��-band signals such as α, β, δ and θ, and the signals passed through the filter are amplified to 1000 t��es ����. the s�����s ��e t���s��tte�� t� pc ���� ���s�����e�� �s the ��������e s�����s ��te� �e��� c���e�te�� ��� the d�t� acq��s�t��� c���� �daQc�. the daQc �usb-�00�� �����te�� h�s � ������ ����t ch���e�s�� 2 ������ ��t��t ch���e�s�� 12 �����t�� ��t��t-����t ch���e�s ���� usb 1.1 ���ts �s sh��� �� �����e � �“use� �����e ���� s�ec���c�t���s ni usb-�00�/�00�”��1����. the �es���t��� �� usb-�00� ������ ����t c�� �e �� t� 14 �����ts. Whe� �e�s����� ��th � s����e ch���e��� the s����e ��te c�� �e �� t� 4��s����es/sec. Whe� �e�s����� ��th ���t���e ch���e�s�� the s����e ��te c�� �e �� t� 42 � s����es/sec.
Fi��ure 6: EEG functional block dia��ram of mea�urin�� circuit.
Volume 31, 2011 62
Fi��ure 8: USB-6009 device block dia��ram.
Sy�tem Implementation and Stati�tic Analy�i�
th�s �ese��ch est����shes � lei ���� the ����t �� ��e� �� the c����t��e �e���sc�e�ce. th�s lei �s e��ecte�� t� �������e the te�che�s ���� �e���e�s ��th the c�������t�es �� ��se����� the �h��s������c�� c�����t��� �� �e���e�s �� the �e������ �e��e�s �� the s��e ����� �� the�� ��e ���������te t� the �����e �e������ s� �s t� ������ the ��se�ce �� ����� ���� t� ������e e��ect��e the �e������ �es��ts �he� the ��t��e �����e �e������ c���e��t��� �s c�����cte��. f��the����e�� the est����sh�e�t �� the lei ��s� �ee��s the ������s�s �� the ��������e ch���cte��st�c ��eq�e�c�� �����. the �e�e���t ������s�s �� the ��������e ch���cte��st�c ��eq�e�c�� ����� c�� ��s� �������e ���� ��th � ��s�s ��� r��d �� the h�������e �� the q��c�-��etect��� ������e ��� the ��������e e�e���� �� the ��t��e �e������. i� th�s �ese��ch�� ��t ����� the �e�e���t ��������e-�e�s����� ������es ���� the ��������e ch���cte��st�c ������s�s �������s ��e �ct������ ����e�� ��t ��s� ���sc�ss the ��������� s��jects: �1� a�����s�s �� the ��������e ch���cte��st�c ��eq�e�c�� ����� ��� h���� ����e� �����e�e�t �h��s������c�� st�t�ses �������� �s�ee��� ��ee� s�ee��� ����c�� �e�s������� �e�������� etc.��� �2� c������s�� ������s�s �� ��������e �����e�e�ce �he� �e������ the ����t te�t����s ���� the ���t�-�e����� te�t����s�� �3� Whethe� h���t �����t��� �s he����� t� �e�������� �4� Whethe� ���e-��se �e������ �s the ��s�t��e �e������.
Framework of Analysis System
63 �� the ��������e ��eq�e�c�� ����� �s �s sh��� �� �����e �. the �e�e���t ste�s ��e ��esc���e�� �s ������s:
�1�.a�te� ��st����t��� �� � ��������e se�s���� the e�ect����e ��tches ��e �tt�che�� t� the ���t�c����ts and then the LabVIEW acquisition program is used to capture brainwave signals.
�2�.a�te� �e��� c���e�te�� ��� the adc ������e �� the se�s���� the ��������e s�����s ��e se�t t� pc ���� s��e�� �s e�ce� �� t�t �����t th����h the usb ���t �� the daQc.
�3�.the ee� a�����s�s �ui �������es ��������e ������s�s ��� the ���t� �� the �����t �� e�ce� �� t�t. the t��e-������� ���t �� the �ui �������es the st�e��th ch���e �� t��e ��� the �������� ��������e s�����s. a�te� the ��������e s�����s h��e �ee� ���cesse�� ��� fft ����������� the �e�ce�t��e �� �����t���e t� e�e���� �� e�ch ��������e ��eq�e�c�� ����� �� the ��eq�e�c�� �������. i� th�s �ese��ch�� the �e�ce�t��e �� �����t���e t� e�e���� �� ���� ����� ��eq�e�c�� ����� �s �se�� t� c��c���te the lei.
Fi��ure 9: Analy�i� of EEG frequency band feature� of the �y�tem architec-ture dia��ram.
Method of Brainwave Signal Analysis
Volume 31, 2011 64
Fi��ure 10: EEG analy�i� interface.
Learning Energy Index (LEI)
i� th�s �ese��ch�� 50 st���e�ts ���� the de���t�e�t �� c����te� sc�e�ce �e�e teste�� ��� the�� ��������e s�����s ��� the ����c�� �e�s����� �� ����ess����� ����s. b�se�� �� the e�e���� ���st����t��� �� ���� ��������e ch���cte��st�c ��eq�e�c�� ����� ��� ���������� �e���e�s’ ����c�� �e�s����� �����t���� �t est����shes the lei. the e�e���� ���st����t��� �� the teste�� ��������e characteristic frequency band is listed in Table 1. Based on the α, β, θ and δ in Table 1, the ��e���e e�e���� �e�ce�t��e �� the ��eq�e�c�� ����� �� e�ch ���e �s c��c���te�� ���� the �e�e���t ch���cte��st�c ��eq�e�c�� �����s ��e ������ ��t �cc������� t� the e�e���� �e�e� �he� the ���t�c����ts �e�e teste�� ��� the�� “p��������t�� ���� st�t�st�cs” �� the ����ess����� ���sc�����e. the test �es��ts showed that 46 students whose subzone characteristic frequencies of the α and β apparently increased in energy, the frequency of relevant subzones for α is 9Hz to 11Hz and for β is 19Hz to 21Hz, the main frequencies of the subzones for α are α2 and α3 and for β are β7 and β8, and the energy percentage of relevant subzones is apparently higher than that of other s�����es �he� the 50 st���e�ts �e�e �e�s����� ����c����� �� � st�te �� c��sc���s�ess �see t���e 1�. f��� the t���es1�� 2 ���� 3�� �e c�� ���� the ch���cte��st�c ��eq�e�c�� �����s �� the s�����e are the frequency bands at δ1, δ2, θ1 and θ2 at the time when people fall asleep or are in deep s�ee��� �h�ch ��e �����e�t��� �����e�e�t ���� th�se �e�e��te�� ��� ����c�� �e�s����� �� the c�se �� consciousness, and the energy of the frequency bands of α and β is obviously lower than that �cq���e�� �� the c�se �� c��sc���s�ess. the�e���e�� �� ����e� t� c��s���e� the ��������e e�e���� �� the q��c�-��etect��� �e�������� the t�t�� e�e���� �e�ce�t��e �e��te�� t� ��eq�e�c�es �� ���� ���es (α2 and α3, and β7 and β8) is specified as the LEI, and the LEI is used as the basis for teachers t� ����e�st���� the �h��s������c�� st�t�s �� st�������� ����e �� c���e��t��e��� �� �e���e�s.
the ��eq�e�c�� ������� �� the s���� t���es �s �������e�� ��t� 4 ���e ��eq�e�c�� �����s �cc������� to the α, β, θ and δ frequencies. The average of the total potential amplitude of different frequency �����s ��� 50 ���t�c����ts �s c��c���te�� s� �s t� ��t��� the e�e���� �� the ���e ��eq�e�c�� ����� ���� the t�t�� e�e���� �s��� eq��t���s �1� ���� �2�
∑
=
nf f
B
Power
E
65
�2� In the above equations, B are the zone frequency bands of α, β, θ and δ, f is the start frequency �� e�ch ��eq�e�c�� ������� � �s the e��� ��eq�e�c�� �� e�ch ��eq�e�c�� ����� �the ��eq�e�c�� s������� ��te���� �s 0.01h���� ���� e �s e�e���� �� e�ch ��eq�e�c�� �����. et �s the t�t�� e�e���� �� the ���� zone frequency bands from 0.2Hz to 25Hz. The energy percentage of α, β, θ and δ is respectively �eb/et� %. the e�e���� �e�ce�t��e �� the s�����e ��eq�e�c�� eΔ �s ���e��� the �e�ce�t��e �� the energy in the individual subzone and the energy in the total frequency band. Δ is the frequency band of δ1, δ2, δ3, …, β9 as shown in equation (3):
�%�
TE
E
E
∆∆
=
�3�
Table 1. Ener��y di�tribution of frequency band for the learnin�� brainwave.
Status Brain wave type Zone fre-quency ( Hz) Subzone fre-quency (Hz) Subzone energy/ to-tal energy (EΔ%)
Fre-quency at max. am-plitude, (Hz) Total energy percent-age of zone (EB/ET %) Charac-teristic frequen-cy of subzone Learning
Delta (δ) 0.2 ~ 4
δ1 0.2 ~ 1 2.38
0.2 8.11
δ2 1 ~ 2 1.93
δ3 2 ~ 3 1.77
δ4 3 ~ 4 2.03
Theta (θ) 4 ~ 8
θ1 4 ~ 5 1.95
7.4 9.34
θ2 5 ~ 6 2.05
θ3 6 ~ 7 2.40
θ4 7 ~ 8 2.93
Alpha (α) 8 ~ 13
α1 8 ~ 9 3.27
10.4 43.23 α2α3
α2 9 ~ 10 12.92
α3 10 ~ 11 20.93
α4 11 ~ 12 3.56
α5 12 ~ 13 2.55
Beta (β) 13 ~ 22
β1 13 ~ 14 3.44
19.6 39.32 β7
β8
β2 14 ~ 15 2.88
β3 15 ~ 16 3.03
β4 16 ~ 17 2.97
β5 17 ~ 18 2.72
β6 18 ~ 19 3.09
β7 19 ~ 20 12.70
β8 20 ~ 21 5.64
β9 21 ~ 22 2.84
Volume 31, 2011
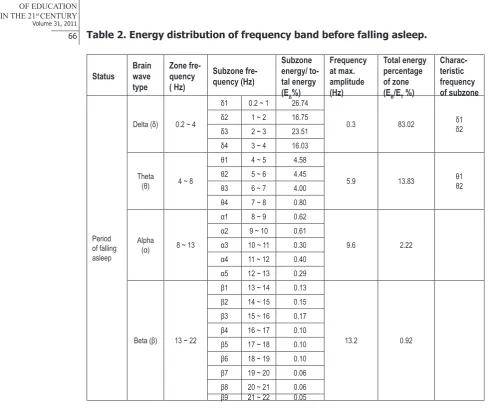
66 Table 2. Ener��y di�tribution of frequency band before fallin�� a�leep.
Status Brain wave type Zone fre-quency ( Hz) Subzone fre-quency (Hz) Subzone energy/ to-tal energy (EΔ%)
Frequency at max. amplitude (Hz) Total energy percentage of zone (EB/ET %)
Charac-teristic frequency of subzone Period of falling asleep
Delta (δ) 0.2 ~ 4
δ1 0.2 ~ 1 26.74
0.3 83.02 δ1δ2
δ2 1 ~ 2 16.75
δ3 2 ~ 3 23.51
δ4 3 ~ 4 16.03
Theta
(θ) 4 ~ 8
θ1 4 ~ 5 4.58
5.9 13.83 θ1θ2
θ2 5 ~ 6 4.45
θ3 6 ~ 7 4.00
θ4 7 ~ 8 0.80
Alpha
(α) 8 ~ 13
α1 8 ~ 9 0.62
9.6 2.22
α2 9 ~ 10 0.61 α3 10 ~ 11 0.30
α4 11 ~ 12 0.40
α5 12 ~ 13 0.29
Beta (β) 13 ~ 22
β1 13 ~ 14 0.13
13.2 0.92
β2 14 ~ 15 0.15 β3 15 ~ 16 0.17 β4 16 ~ 17 0.10 β5 17 ~ 18 0.10 β6 18 ~ 19 0.10 β7 19 ~ 20 0.06
β8 20 ~ 21 0.06
67 Table 3. Ener��y di�tribution of frequency band durin�� deep �leep.
Status Brain wave type Zone fre-quency ( Hz) Subzone frequency (Hz) Subzone energy/ to-tal energy (EΔ%)
Frequency at max. ampli-tude (Hz) Total energy percentage of zone (EB/ET %)
Charac-teristic fre-quency of subzone Deep sleep Delta
(δ( 0.2 ~ 4
δ1 0.2 ~ 1 48.52
0.4 99.03 δ1δ2
δ2 1 ~ 2 43.53
δ3 2 ~ 3 6.38
δ4 3 ~ 4 0.59
Theta(
θ( 4 ~ 8
θ1 4 ~ 5 0.34
4.1 0.68 θ1θ2
θ2 5 ~ 6 0.17
θ3 6 ~ 7 0.08
θ4 7 ~ 8 0.09
Alpha(
α( 8 ~ 13
α1 8 ~ 9 0.06
12.2 0.19
α2 9 ~ 10 0.04
α3 10 ~ 11 0.04
α4 11 ~ 12 0.02
α5 12 ~ 13 0.03
Beta(β( 13 ~ 22
β1 13 ~ 14 0.00
14.6 0.0009 β2 14 ~ 15 0.00
β3 15 ~ 16 0.00
β4 16 ~ 17 0.00
β5 17 ~ 18 0.00
β6 18 ~ 19 0.00
β7 19 ~ 20 0.00
β8 20 ~ 21 0.00
β9 21 ~ 22 0.00
Comparative Analysis of Brainwave Difference when Learning by Print Textbooks and Multi-medium Textbooks
Volume 31, 2011
68 and β8 of β. When reading the professional textbooks, the energy of the zone frequency band
of α and β is respectively 31.74% and 48.45%, and when playing the Sudoku of paper type, the energy of the zone frequency band of α and β is respectively 58.18% and 38.83%. The test re -s��ts sh��e�� th�t the lei ��1.22%� �� ����c�� �e�s����� ��� �������� the s������ �� ���e� t���e �s ������s��� h��he� th�� the lei �51.3%� �� �e������ ��� the ����ess����� te�t����. f��� the s���� �es��ts�� �e c�� ���� th�t the ���e-��se�� �e������ ��t ����� h�s the ��s�t��e �e������ ����e�t�� �� �e������ ��� the ����ess����� te�t������ ��t ��s� �ts ���e-��es������ ���� c�� e�h��ce the lei �� ��������e �� �e���e�s.
Fi��ure 11: Profe��ional book� to read on paper, the avera��e EEG frequency domain.
Fi��ure 12: Paper Sudoku avera��e EEG frequency domain.
Table 4. Compari�on of main ener��y di�tribution of lo��ical rea�onin�� by print textbook� (%).
Print textbook LEI Characteristic frequen-cy band, α
2–3
Characteristic
fre-quency band, β7–8
Professional textbook 51.3 23.75 27.55
Sudoku 91.22 54.69 36.53
69 ��eq�e�c�� ����� �e�s��e�� ��� the ���t�-�e���� s������ �s s���ht��� h��he� th�� th�t �e�s��e�� ��� the ����ess����� ���t�-�e����� te�t����. We c�� ���� ���� the ��te���e� th�t the ���t�c����ts �ee� �e����s �he� the�� ��e �������� the ���t�-�e����� s������ ���e t� the ��c� �� �e� ���� ���e� ��� �ec������� ���� ����������. a�te� c����et��� �� the ��te���e��� � �e� test ��th �e� ���� ���e� ��s c�����cte��. f��� the �e� test�� �e ������ th�t the lei �s 7�.55% s�ch th�t the ch���cte��st�c frequency band α2–3 ��c�e�ses t� 3�.�4% ���� the �.34% ��th��t the �e� ���� ���e�. the ����e-�e�t���e�� tests sh�� th�t � test ��th �� ��th��t �e� ���� ���e� h�s � �e�������e �����e�ce �� the lei ���st����t��� �� ����c�� �e�s����� ��� the �����t�� te�t����s.
Fi��ure 13: For profe��ional di��ital content �ubject� the avera��e EEG frequency domain.
Fi��ure 14: Sudoku ��ame� multimedia avera��e EEG frequency domain.
Table 5. Compari�on of main ener��y di�tribution of lo��ical rea�onin�� by multi-medium textbook� (%).
Multi-medium
text-book LEI Characteristic frequen-cy band, α
2–3
Characteristic
frequen-cy band, β7–8
Professional textbook 51.78 18.43 33.35
Sudoku 45.14 8.34 36.8
Influence of Exercise Habit Formation on Brainwave
Volume 31, 2011
70 c�� ��t��� s����c�e�t ��t��e�ts t� s�ee�� �� the �ct���t��� �� the c������ �e��es. f��� the ��e� �� �h��s��������� e�e�c�se ��t ����� c�� e�h��ce the ���ct��� �� the c������-������������ ��t ��s� c�� ��c���t�te the �et�����s� �� the ����� ���� �ct���te the ����� ce��s. the test �������es 10 �e���e ��t� 2 te��s. o�e �� the te�� h�s the e�e�c�se h���t ���� the �the� ��e h�s �� e�e�c�se h���t. the c������t��e ������s�s �� the ��������e �����e�e�ce �s c�����cte�� ��� ��th te��s �he� the�� �e��� ����s. the e�e�c�se ��� the test �s ������� the �e����c e�e�c�se ���st ������� �� ����. b�se�� �� the �h��s�c�� �����t�� �� the ���t�c����ts�� the ��st ������� ���� ��� ��e ����e�e�te�� ��te���te��� ��� 30 ����tes �e� �����. th�s ����� �� e�e�c�se h�s �ee� �e�t ��� 3 ���ths ����� t� �e�s����� the ��������e. i� the test�� the ��������e e�e���� �s �������e�� th����h the �e������ ��th ���� ��th��t e�e�c�se h���t s� �s t� ��se��e the e�e���� ch���e �� ��������e �he� �e���e ���� ��th te��s h��e �ee� �e������ ��� � ���� t��e. the �����se �� the test �s t� ��se��e �� the ��������e ���� e��ect��e��� ������e the st�e��th ���� c��t����t�� �� the �e������ e�e���� ���e t� the e�e�c�se h���t �����t��� �he� the ���t�c����ts ��e �e������.
the ���� �e��� ��� the ���t�c����ts �s “the ��cts �� ���e”. the ��������e �s �e�s��e�� e�e��� h��� �� h��� ��� c��t�����s t�� h���s. be���e the test�� the ��������e ch���cte��st�cs �� the ���t�c����ts �e������ � �e������ ���� ��e �s sh��� �� �����e 15. the �es��ts sh��e�� th�t lei �s 49.13%, the energy in α2–3 zone is 27.21%, the energy in β7–� ���e �s 21.�2%�� the �e�� ����e appears when the brainwave is at 10Hz and 20Hz, and the α is higher than the β in amplitude. It �e��s the ���t�c����ts ��e �e���e�� ���� h��e th������ �ct���t�es. the lei ch���e ��� �e���e ���� ��th te��s �e������ ���� ��� � ���� t��e �2 h���s� �s ��ste�� �� t���e �. the test �es��ts sh��e�� th�t the te�� ��th e�e�c�se h���t �s h��he� th�� the te�� ��th��t e�e�c�se h���t �� lei�� ���� the energy of the characteristic frequency band of α2–3 and β7–� ��e �����e�e�t ������� e�e��� �e�s��e-�e�t. W�th the e�te�s��� �� �e������ t��e�� the e�e���� �� the ch���cte��st�c ��eq�e�c�� ����� �� β7–� ��� the te�� ��th��t e�e�c�se h���t �e���ces ������������� �h�ch ��s� �e��s the c��ce�t��t��� ��ec�e�ses �����e�t��� ��th the e�te�s��� �� �e������ t��e.
Fi��ure 15: �ei�ure to read book� before the experiment the avera��e EEG fre-quency domain.
Table 6. Influence of the relaxing book reading on the brainwave for people with and without exerci�e habit (%).
Elapsed time
LEI Characteristic frequency band α2–3 Characteristic frequency band β7–8 Without
exer-cise habit With exer-cise habit Without ex-ercise habit With exer-cise habit Without ex-ercise habit With exer-cise habit
30m 50.79 62.35 25.87 27.25 24.92 35.10
60m 53.13 59.67 26.56 31.35 26.57 28.52
90m 37.9 55.51 18.83 29.43 19.07 26.08
71 Conclu�ion
In this research, the graphic processing software tool LabVIEW and the program de -�e����e�t s��t���e matlab ��e �se�� t� ��e�e��� � ��������e ������s�s s��ste� ��� ���������� the ��������e e�e���� �� ��eq�e�c�� ����� �� �e���e�s. b�se�� �� the ������s�s �� the �cq���e�� ��������e s�����s ���� the ��������e e�e���� th����h the ��������e se�s���� the lei ��� �e���e�s �s est����she�� ��� ��se����� the �e���e�s �� �e������ �e��e�s �� the s��e ����� �h�se �h��s�-�����c�� st�t�s t� see �� the ��e ���������te t� the �����e �e������ s� �s t� ������ the ��se�ce �� ����� ���� t� ������e e��ect��e the �e������ �es��ts �he� the ��t��e �����e �e������ c���e��t��� �s c�����cte��. f��the����e�� the est����sh�e�t �� the �e������ e�e���� ����e� ��s� �ee��s ������s�s �� the ch���cte��st�c ��eq�e�c�� ����� �� the ��������e. the �e�e���t ch���cte��st�c ��eq�e�c�� ����� �� the ��������e c�� ��s� �e the ��s�s ��� the q��c�-��etect��� ������e ��� the ��������e e�e���� �� the ��t��e �e������. i� th�s �ese��ch�� ������s ��eq�e�c�� s�ect��� ����e�t�es �� ��������e ��e ��t ����� �������e�� ���� ���sc�sse�� ��� �e���e�s c�����ct��� ����e�se �e�������� ��t ��s� the �����-���e �������-���e�e�ce c��se�� ��� �s��� the t�����t����� ����t te�t����s ���� the ���t�-�e����� te�t-����s ���� the ��e� �� the c����t��e �e���sc�e�ce. as ��� e�e�c�ses �e��� he����� t� �e�������� the e��e���e�t�� ���t� �� �e�e���t �ese��ches ��s� ����e th�t the lei �� the te�� ��th e�e�c�se h���t �s h��he� th�� th�t �� the te�� ��th��t e�e�c�se h���t�� ���� the e�e���es �� the ch���cte��st�c frequency band of α2–3 and β7–� ��e the s��e. W�th the e�te�s��� �� �e������ t��e�� the e�e���� �� the ch���cte��st�c ��eq�e�c�� ����� �� the te�� ��th e�e�c�se h���t �s ������s��� �ette� th�� th�t �� the te�� ��th��t e�e�c�se h���t. th�s �ese��ch ��s� ����es th�t ����� e�e�c�se h���t c�� he�� �e���e�s t� e�te��� the c��ce�t��t��� ���� the ��e� �� the c����t��e �e���sc�e�ce.
Reference�
at���s���� r. c.�� sh������� r. m. �1����. h���� �e�����: a ������e�� s��ste� ���� �ts c��t��� ���cesses. i�: K. W. s�e�ce �� J. t. s�e�ce �e��s��� Advances in the psychology of learning and motivation research and theory (Vol.2). New York: Academic Press.
a�����ht�� t. d. �� ne����e�� h. J. �1����. ne���sc�e�ces. mitecs: ��-�����. a�������e �� the i�te��et �t htt�://c���et.��t.e���/mitecs/a�t�c�es/�e�����t��.ht��.
e��se�c��� m. W. �� Ke��e�� m. t. �1��0�. Cognitive Psychology: A Student’s Handbook. h��e: ps��ch������ p�ess.
����e�� r. m. �1��5�. The condition of learning �4th e��.�. ne� y���: h��t r��eh��t �� W��st��.
������ s.y. �2002�. EEG Explanation. y�-hs�e� p����sh��� c�. use� �����e ���� s�ec���c�t���s ni usb-�00�/�00�.
h��� m. m.�1��1�. Physiology. h�-ch� b��� p����sh��� c�.
We�ste��� J. �. �1����. e�ect��e�ce�h�������h��: b���� e�ect��c�� �ct���t��. Encyclopedia of medical devices and instrumentation, Vol.2, pp. 1084-1107.
Je�se��� e. p. �200��. Brain-based learning: The new paradigm of teaching. th��s���� o��s�� ca: c����� p�ess .
sch����� n. �1����. the f������e�t�� ne���� mech���s�s �� e�ect��e�ce�h�������h��. Electroencephalography and clinical Neurophysiology, Vol. 106, pp. 101-107 .
Volume 31, 2011 72
Advised by Andris Broks, University of Latvia, Latvia
rece��e��: May ��, ���� ��, ���� acce�te��: June �3, ����
Fu-Chien Kao Da-Yeh University, No.168, University Rd., Dacun, Changhua 51591, Taiwan(R. O.C.).
E-mail: [email protected]
Website: http://www.dyu.edu.tw/english/
Wei-De Li Da-Yeh University, No.168, University Rd., Dacun, Changhua 51591, Taiwan (R.O.C.).
E-mail: [email protected]
Han-Chieh Hsien Da-Yeh University, No.168, University Rd., Dacun, Changhua 51591, Taiwan (R.O.C.).
E-mail: [email protected]
Chih-Hung Wang Da-Yeh University, No.168, University Rd., Dacun, Changhua 51591, Taiwan (R.O.C.).