R E S E A R C H
Open Access
A method for reclassifying cause of death
in cases categorized as
“
event of
undetermined intent
”
Evgeny Andreev
1, Vladimir M. Shkolnikov
1,2, William Alex Pridemore
3*and Svetlana Yu. Nikitina
4Abstract
Background:We present a method for reclassifying external causes of death categorized as“event of
undetermined intent”(EUIs) into non-transport accidents, suicides, or homicides. In nations like Russia and the UK the absolute number of EUIs is large, the EUI death rate is high, or EUIs comprise a non-trivial proportion of all deaths due to external causes. Overuse of this category may result in (1) substantially underestimating the mortality rate of deaths due to specific external causes and (2) threats to the validity of studies of the patterns and causes of external deaths and of evaluations of the impact of interventions meant to reduce them.
Methods:We employ available characteristics about the deceased and the event to estimate the most likely cause of death using multinomial logistic regression. We use the set of known non-transport accidents, suicides, and homicides to calculate an mlogit-based linear score and an estimated classification probability (ECP). This ECP is applied to EUIs, with varying levels of minimal classification probability. We also present an optional second step that employs a population-level adjustment to reclassify deaths that remain undetermined (the proportion of which varies based on the minimal classification probability). We illustrate our method by applying it to Russia. Between 2000 and 2011, 521,000 Russian deaths (15 % percent of all deaths from external causes) were categorized as EUIs. We used data from anonymized micro-data on the ~3 million deaths from external causes. Our reclassification model used 10 decedent and event characteristics from the computerized death records.
Results:Results show that during this period about 14 % of non-transport accidents, 13 % of suicides, and 33 % of homicides were officially categorized as EUIs. Our findings also suggest that 2011 levels of non-transport accidents and suicides would have been about 24 % higher and of homicide about 82 % higher than that reported by official vital statistics data.
Conclusions:Overuse of the external cause of death classification“event of undetermined intent”may indicate questionable quality of mortality data on external causes of death. This can have wide-ranging implications for families, medical professionals, the justice system, researchers, and policymakers. With our classification probability set as equal to or higher than 0.75, we were able to reclassify about two-thirds of EUI deaths in our sample. Our optional additional step allowed us to redistribute the remaining unclassified EUIs. Our method can be applied to data from any nation or sub-national population in which the EUI category is employed.
Keywords:Research methods, Missing data, External causes of death, Events of undetermined intent, ICD codes, Russia
* Correspondence:[email protected] 3
University at Albany–State University of New York, School of Criminal Justice, 135 Western Avenue, Draper Hall 219, Albany, NY 12222, USA Full list of author information is available at the end of the article
Background
In this paper we present a method for reclassifying
exter-nal causes of death categorized as“event of undetermined
intent”(EUIs). As we show in our study, the probability of
a transport accident death being classified as an EUI is very low, thus EUIs caused by external injuries are neces-sarily due to non-transport accidents, suicides, or homi-cides. In theory, not enough information exists on EUIs for medical examiners to determine cause of death,
though in some cases—especially with homicides and
sui-cides—this category may be used purposely to register the
death in this ill-defined category instead of due to a
defin-ite or likely violent cause [1–9]. In many industrialized
na-tions use of the EUI category is rare. In some nana-tions, however, the raw number of EUIs is large, the EUI death rate is high, or EUIs comprise a non-trivial proportion of all deaths due to external causes.
Overuse of the EUI category results in meaningful limitations. First, the mortality rate due to non-transport accidents, suicides, or homicides may be substantially underestimated if EUIs are ignored. This is especially problematic if the EUI category is purposely employed to artificially under-enumerate homicide or suicide deaths. As such, use of the EUI category may be considered a proxy for the quality of mortality data on external causes of death [10, 11]. Second, at both the individual and popu-lation levels, overuse of the EUI category threatens the val-idity of studies of the patterns, causes, and consequences of non-transport accidents, suicides, and homicides, and of evaluations of the impact of interventions meant to re-duce these types of mortality.
We propose a two-stage method for reclassifying exter-nally caused EUIs as non-transport accidents, suicides, or homicides. After the first stage, a sizeable proportion of EUIs may remain unclassified when we set a higher level of reliability for reclassification. Thus, we add a second op-tional stage in which we show how reclassification of the entire set of EUI deaths may be reached conditional upon an additional assumption. We illustrate our method by ap-plying it to data on nearly 3 million deaths due to external causes in Russia, a nation with generally reliable mortality data, high mortality from external causes, and a large number of deaths due to and a high rate of EUIs.
Substantively, reclassification of EUIs tends to elevate mortality from homicides and non-transport accidents to a greater extent than mortality from suicides. If these esti-mates are valid, then this changes our view of Russian rates of external causes of death, especially of important social barometers like homicide and suicide rates. Methodolo-gically, our proposed method can be applied to other na-tions, allowing for a better understanding of (1) estimates of specific external causes of death, (2) the impact of the use of the EUI category on true rates of death due to non-transport accidents, suicide, and homicide, and (3) the
impact on these causes of death of social, cultural, and economic factors and of public policy.
Use of the EUI category in Russia
Between 2000 and 2011, 15 % percent of all deaths from ex-ternal causes in Russia were categorized as events of un-determined intent. Table 1 shows that Russia is the dubious leader on this indicator among several select industrialized nations. Other industrialized nations with a meaningful proportion of all deaths from external causes placed in this category include the UK (12 %), Poland (10 %), and Sweden (8 %). While the percentage difference between Russia and the UK seems relatively minor, the Russian age-standardized death rate (SDR) for this category is 8.5 times higher than in the UK and 4.7 times higher than in Poland, the nation with the second highest SDR for this category. Therefore, the Russian problem with EUIs is not only the high proportion of all external causes of death placed in this category but the very large number of deaths. Between 2000 and 2011 there were 521,000 EUI deaths, or more than 43,000 deaths annually. This compares to 541 thou-sand deaths from suicide and 380 thouthou-sand deaths from homicide during this period. If these EUIs were classified correctly it likely would substantially increase Russian rates of non-transport accidents, suicide, and homicide.
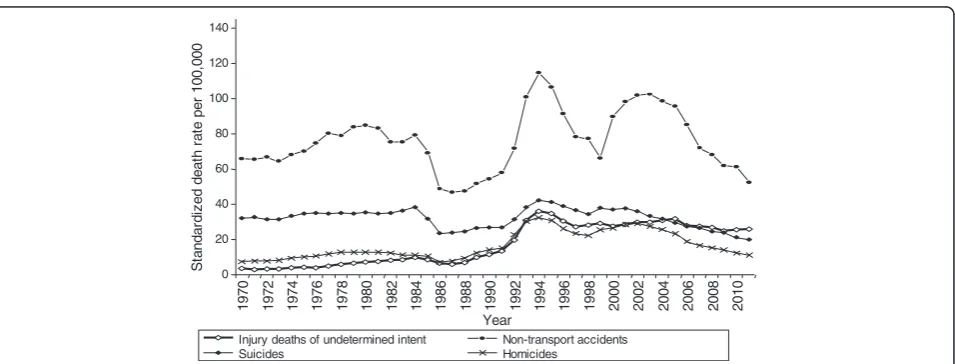
Figure 1 shows the Russian SDR due to non-transport ac-cidents, suicides, homicides, and EUIs since 1970. While EUIs generally trend with the other external causes of death, relative to these other causes EUIs (1) rose disproportion-ately following the collapse of the Soviet Union and (2) have not declined as quickly since the early 2000s. It is important to note that the similarity in trends across many causes of death in Russia, even the change occurring around the col-lapse of the Soviet Union, is only weakly related to coding practices. Instead, it is mainly explained by the abrupt and painful social, political, and economic changes. This in-cludes the major role played by alcohol, as can be seen with
the initiation of Gorbachev’s anti-alcohol campaign in 1985,
its weakening in 1988–91, termination in 1991, and
subse-quent fluctuations in consumption [12–14].
Our approach to reclassifying death events due to undetermined intent
Table 1Age-standardized death rates per 100,000 residents for several external causes of death and proportion of all external deaths categorized as due to events of undetermined intent (EUI) among select industrialized nations, 2000–2011
Nation Years Cause of death (rates per 100,000 residents) EUI % share of
all external causes All external causes Non-Transport accident Suicide Homicide EUI
Australia 2001–2011 35.5 13.7 10.3 1.1 1.2 3.4
Austria 2002–2011 40.9 14.8 14.0 0.7 1.3 3.3
Belgium 2003–2009 49.5 17.9 17.2 1.3 1.8 3.7
Canada 2000–2009 39.4 15.4 10.8 1.5 1.7 4.4
Czech Republic 2000–2011 54.6 25.3 13.4 1.0 3.5 6.4
Denmark 2000–2011 37.6 16.7 10.5 0.9 2.2 5.9
Finland 2000–2011 67.0 35.3 18.8 2.2 1.6 2.4
France 2000–2009 49.5 21.5 15.8 0.7 0.8 1.5
Germany 2000–2011 30.9 10.2 10.5 0.6 2.2 7.1
Hungary 2000–2011 68.9 28.7 23.6 1.9 1.3 1.9
Italy 2003, 2006–2010 28.2 12.1 5.4 0.9 0.1 0.4
Netherlands 2000–2011 27.2 11.0 8.6 1.0 0.4 1.3
Norway 2000–2011 41.3 22.1 11.1 0.9 0.1 0.2
Poland 2000–2011 60.9 23.2 14.7 1.4 6.0 9.8
Romania 2000–2010 59.1 27.9 11.8 2.8 1.2 2.1
Russia 2000–2011 186.2 82.2 29.1 20.8 28.0 15.1
Spain 2000–2011 30.2 11.7 6.6 0.9 0.2 0.6
Sweden 2000–2010 38.7 16.4 11.8 1.0 3.1 8.0
United Kingdom 2001–2010 28.1 11.9 6.5 0.4 3.3 11.8
United States 2000–2010 54.9 20.0 11.0 6.0 1.6 2.9
Note: We used the European population standard (World Health Organization,European health for all database, [http://data.euro.who.int/hfadb/]) and we include in the table data only for nation-years in which the ICD-10 was used. For Russia, information is based on vital statistics data available online athttp://www.demogr.nes.ru/ index.php/en/demogr_indicat/data_description. For all other nations, information is based on the WHO Mortality Database that is available online
athttp://www.who.int/healthinfo/mortality_data/en/
0 20 40 60 80 100 120 140
1970 1972 1974 1976 1978 1980 1982 1984 1986 1988 1990 1992 1994 1996 1998 2000 2002 2004 2006 2008 2010 Year
S
tandar
di
z
ed deat
h r
at
e per
100,
000
Injury deaths of undetermined intent Non-transport accidents Suicides Homicides
In our case, we estimated the classification probability using the characteristics of known non-transport accidents, sui-cides, and homicides as our training set. We then applied this to the target set: events of undetermined intent. For each death we calculated the most probable category based on its constellation of characteristics. Our estimated classi-fication probabilities (ECP) varied between 0.334 and 0.999, however, and it would make little sense to accept a classi-fication into one of the categories when the ECP is low (e.g., < 0.5). The higher the level of ECP the greater the agreement between deaths from predicted and actual causes of death, but also the higher the number of EUI deaths that cannot be reclassified using the prediction model. At every level of ECP, more EUI deaths were reclas-sified as homicides and non-transport accidents relative to EUI deaths that were reclassified as suicides. Once we set a minimum limit of ECP to 0.75, it was possible to reclassify about two-thirds of the EUI deaths. Further, if we assume that the probabilities of misclassification of causes of death for the EUI events are the same as the corresponding prob-abilities for deaths with known causes, it was possible to add an additional optional step and reclassify the entire set of EUI events into one of the three known causes.
Methods Data
Our analyses were based on anonymous micro-data on all deaths from external causes that occurred in Russia be-tween January 1, 2000, and December 31, 2011. These in-cluded 1.481 million deaths due to non-transport accidents (ICD-10 codes W00-X59), 541 thousand deaths due to sui-cide (X60-X84), 379 thousand deaths due to homisui-cide (X85-Y05, Y08, Y09), and 512 thousand deaths due to EUI (Y10-Y34). We excluded from our analysis deaths due to transport accidents (which have a low probability of being classified as an event of undetermined intent; see discussion below in the Sensitivity Analyses section) and a very small
number of deaths due to“Neglect and abandonment, and
other maltreatment syndromes”(Y06-Y07). Our total
num-ber of cases was about 2.913 million.
Each computerized death record includes the following information. (1) Month and year of death registration. (2) A code for the region (analogous to province or state) in which the death was registered, which is usually (but not always) the same as the region of permanent residence of the deceased. (3) Sex. (4) Date of death. (5) Date of birth. (6) Age at death in completed years. (7) Two ICD-10 codes for cause of death. The first ICD code classifies cause according to external cause (e.g., accidental fall or homicide) and the second code denotes the anatomic character of injury (e.g., skull fracture or open wound of thorax). (8) Two aggregated cause of death codes from the abridged Russian cause of death nomenclature corre-sponding to the ICD-10 codes. We note, however, that our
study is based on micro-data from death records, and in these records causes of death are coded by the original ICD-10 items. Thus, we depend on the original ICD-10 coding not the aggregated causes of death used by the Russian statistical agency. (9) Place of death: hospital, out-side of a hospital, unknown. (10) The person who issued the death certificate: physician, feldsher (this is a medical worker of an intermediate level between a nurse and a physician), pathologist, or forensic expert. (11) A yes/no indicator of if the deceased was in a state of alcoholic intoxication at the time of death. (12) And a yes/no indica-tor of if the identity of the deceased was known.
Methods
The multinomial logistic model Our indirect statistical
method for reclassification of EUIs is based on the use of multinomial logistic (mlogit) regression. Beginning with
the set of all deaths from the three known causes—
non-transport accident, suicide, and homicide—as our training
set, we calculated an mlogit-based linear score and a pre-dictor function equal to the estimated classification prob-ability (ECP) that the case in question belongs to one of these three categories. Presuming (for simplicity) that all explanatory variables are dichotomous variables, the multinomial regression model can be expressed as
Prðn;cause¼iÞ ¼ e
X
k Bikxnik
X
i e
X
k Bikxnik
:
In this equation, causes of death (i.e., outcomes) are
numbered i= 1, 2, 3. xikn are values of independent
di-chotomous variables for the casen. Index kruns across
independent variables. Bik are the respective regression
coefficients. One of the three outcomes (sayi= 3) is
con-sidered as a base outcome withB3k= 0. Other regression
coefficients are estimated by the mlogit procedure
ac-cording to the maximum likelihood. For every fixed n,
values of the sum X
k
Bixnik constitute the corresponding
estimated linear scores, and the three values of the
pre-diction functionPr(n, cause =i) are the estimated
prob-abilities of the three causes of death, with their total equal to 1 (these are the ECP probabilities).
As the number of deaths varies substantially across the three causes, we use weights to eliminate this difference so that the estimation procedure does not give prefer-ence according to relative sizes. As a sensitivity check we assessed two regression models with and without weights and compared their results.
used bootstrapping on the training set to estimate the
in-fluence of errors in the regression coefficients Bi on the
final result. We generated 250 vectors of coefficients Bi~
using the formulaBi~ ¼BiþSEi⋅γ, whereSEiis the
stand-ard error of the regression coefficientBi, and γis a
ran-dom variable that has a standard normal distribution. We
applied each vector of coefficients Bi~ for reclassifications
of EUIs and examined variation in the results.
Preliminary analyses indicated substantial differences in the results for men and women, thus we conducted separate analyses for each.
Independent variablesWhile a set of independent
vari-ables must be informative enough to successfully reclas-sify the EUI cases into the three causes of death, increasing the number of variables increases the risk of singularities in the Hessian matrix. Therefore, we con-structed a variable list such that the Hessian matrix would be non-singular and each variable would be
sig-nificant at p< 0.01 for at least one sex and at least one
value of the dependent variable (i.e., cause of death). After a number of experiments, we generated the follow-ing list of ten independent variables.
1. Knowledge of identity: A dichotomous variable that informs us if the identity of the person was known and/or the exact date of birth was known to the party registering the death [15].
2. Age group: 0–14, 15–24, 25–34, 35–44, 45–54, 55–64, 65+, and unknown. Although we have the exact age, allowing a continuous range did not improve the accuracy of the model.
3. Year of death: This is especially important due to substantial differences in mortality dynamics over the 2000s. There was an increase in 2000–2002, stabilization and slow decline in 2003–2005, and steeper decline in 2006–2011.
4. Type of day: A dichotomous variable coded 1 if the death occurred on Monday or on a day following a national holiday and 0 if the death occurred on any other day [8]. Any further detail on day of death did not improve the accuracy of the regression model. 5. Season of year: A categorical variable denoting
winter (December-February), summer (June-August), and a combined value for spring and autumn. Using the exact month of death did not improve the accuracy of the model.
6. Geographic region: This was based on the eight Federal Districts of Russia, with two exceptions. First, we created one additional region by combining the city of Moscow and its surrounding region (i.e., Moscow Oblast). Second, Stavropol Krai was included as part of the Southern Federal District.
Thus, the final number of geographic regions was nine.
7. Urban/rural residence: A dichotomous variable defining whether the death occurred in an urban or rural area. 8. Type of injury: While the list of ICD-10 codes for
these injuries includes 195 categories, the Russian national classification contains only 10 aggregate categories. We retained the Russian national
classification but added nine additional categories for a total of 19. Table2contains a list of our categories, together with the corresponding ICD-10 codes. 9. Presence of alcoholic intoxication at death: A
dichotomous variable coded 1 if alcohol intoxication at time of death was acknowledged on the death certificate. 10.Specific location of death: Based on ICD-10 rules
[16], the eight places of death were home, residential institution, school or other institution and public administrative area, sports and athletics area, street and highway, trade and service area, other specified places, unspecified place.
Distributions of cases by independent variables is pre-sented in Appendix C. The total number of possible combinations of the independent variables is about 1.120 million. Obviously a majority of them is not pro-vided in the dataset. This set of ten independent vari-ables appeared to be optimal. Adding other explanatory variables either did not reduce the prediction error or led to a singular Hessian matrix.
Handling missing valuesThe input data did not contain
missing values. In our mlogit model, the dependent vari-able (external cause of death) takes three well-defined values: non-transport accident, homicide, and suicide. Ex-planatory variables may have ill-defined values. For
ex-ample, age at death may be“unknown” or the anatomic
character of the injury may be “unspecified.” However,
empirical analysis shows that these ill-defined values pro-vide important information for predicting cause of death.
In such cases, therefore, we treated these“unknown”
ob-servations as specific values (i.e., unknown) rather than as
missing values (coded“.”in statistical packages) and rather
than imputing their values.
ComputationsThe mlogit analyses were conducted
separ-ately for men and women, though the variable list was the same for both (see the mlogit outputs in the Appendix A). To impute the missing cause of death, we applied the esti-mated linear scores and corresponding predictor functions to the training set of death records with known causes.
For each case, we estimated classification probabilities of
being classified as each of the three death categories—
the case to the cause of death corresponding to the highest probability.
Assessing the multinomial logistic model on well-defined cases Results of the regression based reclassifi-cation on the set of deaths with known causes (i.e., non-transport accident, suicide, or homicide) were presented
as the distribution matrix D =‖dij‖, withiandjdenoting
predicted and actual causes of death, respectively (i,j=
1,2,3). The nine elements dij show a two-dimensional
distribution of death cases by predicted and actual
causes.DjAandDiPare the marginal one-dimensional
dis-tributions by actual and predicted causes of death,
re-spectively DAj ¼
X
i
dij;DPi ¼ X
j
dij. Relative error in
prediction of the total number of actual cause of events
is equal to (DPi −DiA)/DiA, where (i= 1,2,3). The smaller
these errors, the closer the model fit of the actual population-level mortality distribution is by cause.
The matrix D was obtained from death records by count-ing death cases with any of the three estimated ECPs that were greater than or equal to a specific lower limit denoted
as ECP0. The limit ECP0can be chosen as any value
be-tween 0 and 1, with 0 corresponding to full flexibility and 1
to absolute constraint. For every case of deathn, the
candi-date cause of death corresponds to the maximum of the three ECPs. However, the final assignment to the respective cause of death depends on the maximum ECP value, such
that ECP≥ECP0. The matrix D corresponding to a specific
value of ECP0was denoted DECP0¼dECPij 0. The relative
errors of prediction diminish as the lower limit of ECP0
in-creases. A simple transition from the absolute data dECP0
ij
to a relative distribution X1
i;j dECP0
ij
dECP0 ij
permits one to
compare the latter distributions with respect to the values
of the ECP0limits.
Constructing the cause-of-death distributions for events
of undetermined intentTo reclassify the EUIs, we apply
the regression coefficients provided by the multinomial regression model on deaths with known causes. We de-note the total numbers of EUIs classified according to
the three causes asUi,i= 1, 2, 3.
First, we assess Ui for men and women without any
restriction on the level of the prediction probabilities
(i.e., ECP0= 0). Effectively, in this case the choice of
cause i is based on the maximal value of ECP without
regard to whether its absolute value was high or low.
Then, we produce a number of other variants of UECP0
i
corresponding to ECP values that are constrained to be
equal to or higher than ECP0. For our purposes, we used
ECP0values ranging from 0.5 to 0.9.
In our case it was clear that when constraints on ECP
values are flexible (e.g., no constraint at all or ECP≥0.5),
causes of death can be predicted for all or nearly all EUI cases. Under such conditions, though, a substantial propor-tion of these predicpropor-tions could be inaccurate. With stricter
constraints on the ECP value (e.g., ECP≥0.8 or ECP≥0.9),
however, a relatively high proportion of EUIs can be pre-dicted correctly, but for a substantial proportion of them prediction would be impossible because the maximal (with
respect to cause of deathi) ECP values would not be high
enough to fulfill the constraint. The importance of this in-evitable balance depends on the quality of diagnostic infor-mation contained by the set of independent variables.
Using the results of this reclassification of the set of EUIs we can re-estimate the numbers of deaths and corre-sponding death rates for non-transport accidents, suicides, and homicides. If we predetermine a higher ECP limit, then some proportion of EUIs remain unclassified. The
Table 2Russian causes of death for classifying deaths by
character of injury and their correspondence to items of ICD-10
Injury ICD-10 Code
1 Fracture of skull and facial bones S02
2 Intracranial injury S06
3 Other injuries to the head S00, S01, S03-S05,
S07-S09
4 Injuries to the neck S10-S19
5 Open wound of thorax S21
6 Other injuries to the thorax S20-S29
7 Injuries to the abdomen, lower back, lumbar spine and pelvis
S30-S39
8 Injuries to the limbs S40-S99
9 Effects of foreign body entering through natural orifice
T15-T19
10 Burns and corrosions T20-T32
11 Frostbite T33-T35
12 Poisoning by narcotics and psychodysleptics [hallucinogens]
T40
13 Toxic effect of alcohol T51
14 Toxic effect of carbon monoxide T58
15 Other poisoning by drugs, medicaments and biological substances, toxic effects of substances chiefly nonmedicinal as to source
T36-T65
16 Hypothermia and other effects of reduced temperature
T68, T69
17 Asphyxiation T71
18 Effects of lightning, drowning and nonfatal submersion, vibration, electric current and other specified effects
T75
19 Other injury, poisoning, and consequences of external causes
adjusted number of events belonging to a certain cause of death is the sum of the number of events from this cause among all events with known causes and the number of EUIs reclassified as deaths from the same cause.
It may be that when setting a reasonably high ECP0leaves
a relatively high number of cases for which cause of death cannot be predicted at the micro-level by the regression model. However, as an optional second stage we propose a
simple procedure for a population-level reclassification of
all EUIs based on an additional explicit assumption. To do this we return to the classification of cases with known causes of death. The proportion of cases classified by the
model as causeiactually caused by causejis equal toPij=
dij/DiP. From here it is obvious that DAj ¼
X
i
Pij⋅DPj .
Therefore, the proportionsPijcan be considered estimated
probabilities for cases classified by the model as causei
ac-tually caused by causej. If one assumes that the
probabil-ities of misclassification of causes of death for the EUI events are the same as the corresponding probabilities for
deaths with known causes, then the matrix PThelps to
esti-mate the population-level distribution of EUIs by causes as
UAdjj ¼ X
i
Pij⋅Uj. Again, while this population level
redis-tribution can be of substantial utility, it is an optional step that is not a necessary part of our main redistribution procedure.
Results
Within the framework of the bootstrap test, we carried out 250 random simulations for each case. In 99.2 % of the cases the predicted cause was the same as the pre-dicted cause based on the original regression coefficients. For males, if the estimated classification probability was equal to or greater than 0.75 then the predicted cause was always the same as the prediction based on the original
coefficients. For females this threshold was ECP≥0.77.
These tests provided confidence that the identified rela-tionships were not a result of chance.
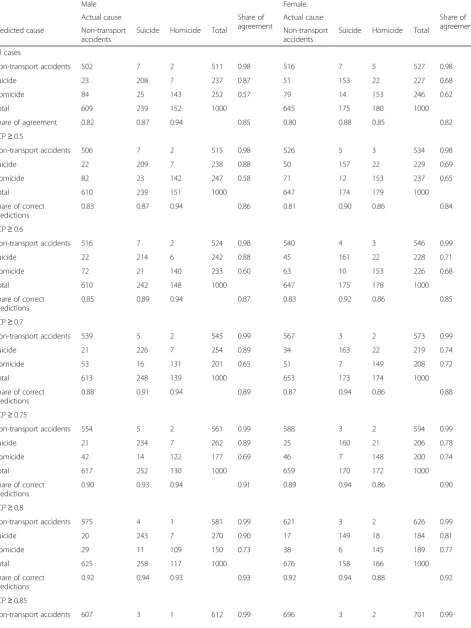
Table 3 contains the distribution of events by actual and predicted kind of event in the entire dataset and for cases with no lower limit on ECP and with ECP lower limits of 0.5, 0.6, 0.7, 0.75, 0.8, 0.85, and 0.9. In the training set of well-defined death events, the weighted model (for which results are shown in Table 3) correctly predicted the actual causes in 84.5 % (85 % for males, 82 % for females) of cases. It correctly classified 82 % of non-transport accidents, 87 % of suicides, and 92 % of homicides. The unweighted model (not shown in table) correctly classified 86 % of all cases (87 % for males, 85 % for females), including 90 % of non-transport accidents, 85 % of suicides, and 76 % of homi-cides. So, our choice of the weighted model was justified by the poor performance of the unweighted model on homi-cide cases. The table shows that the model predicted actual
homicides very well. However, the model tended also to over-predict homicide such that when the predicted cause was homicide the actual cause was sometimes different. About 8 % of all cases for males and for females were classi-fied as homicides but were in fact non-transport accidents.
Table 4 shows that additional requirements to the min-imal ECP level improved this situation, though the prob-lem remained. Indeed, the excess in predicted homicides fell more slowly than the proportion of events of undeter-mined intent that can be classified. Further investigation of the micro-level data revealed the reason for this phenomenon. It appears that there are nearly homoge-neous (in light of the model independent variables) groups of cases that cannot be separated but that contain deaths with different causes. For example, there is a subset of 47 thousand male deaths with registered intracranial injury. The true distribution of events by cause for these cases is 49 % non-transport accidents and 51 % homicides. The problem is that for each case from the first sub-group it is possible to find a case from the second sub-group that looks similarly in light of all other independent variables. However, the weighted and unweighted models classified nearly all these cases as homicides or as non-transport ac-cidents, respectively.
Although the weighted model tends to over-predict ho-micides, this tendency weakens with higher minimum limits on ECP. This implies that the EUIs for a large part of mis-classified homicides are relatively low. We can go further to understand why this is happening. First, type of injury is the most informative predictor. Second, some injuries com-monly (but not always) correspond to a certain cause of
death. The situation“usually but not always”is more
char-acteristic of homicide. For example, an open wound of the thorax in 75 % of events of determined intent corresponds
to homicides, and the group “other injury, poisoning and
consequences of external causes”corresponds to homicide
in 88 % of cases. If we interpret the category “usually but
not always”as the share of some kind of events in the range
of 66–95 %, then we found that 39 % events of determined
intent belong to this category, though 17 % of them are“
un-usual”events. For non-transport accidents and suicide, the
percentage is about 16 % and for homicide it is 33 %. Thus, when increasing the ECP the share of homicides decreases more steeply compared to the two other causes. Once ECP increases, events classified (mostly due to the type of injury) migrate from homicide to the set of unclassified events.
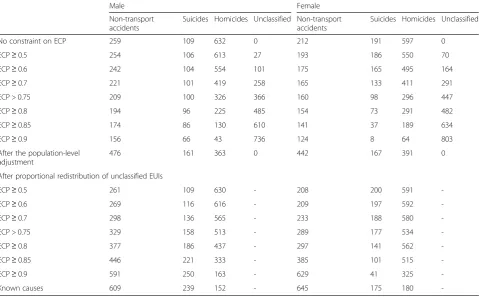
Figure 2 illustrates the distribution of reclassified EUI cases by predicted cause of event for different ECP levels. The distribution of the result of population-level adjustment of EUIs by causes is similar to the
distribu-tion by causes of EUIs reclassified with ECP≈0.85,
pro-viding further evidence of its validity.
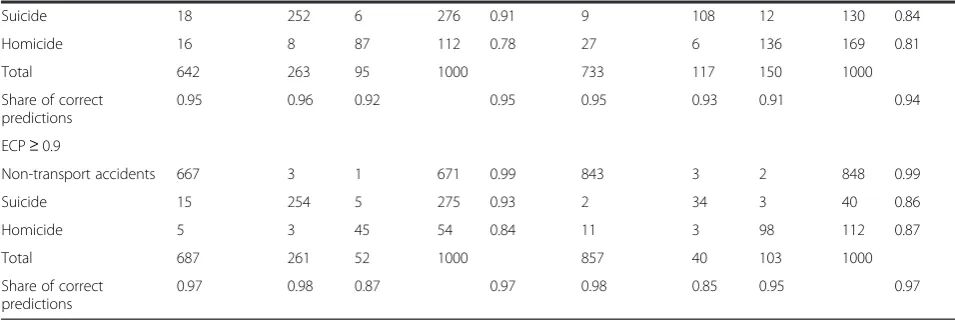
Table 3Distribution of deaths with known causes by actual and predicted cause (per 1000)
Male Female
Actual cause Share of
agreement
Actual cause Share of
agreement
Predicted cause Non-transport
accidents
Suicide Homicide Total Non-transport
accidents
Suicide Homicide Total
All cases
Non-transport accidents 502 7 2 511 0.98 516 7 5 527 0.98
Suicide 23 208 7 237 0.87 51 153 22 227 0.68
Homicide 84 25 143 252 0.57 79 14 153 246 0.62
Total 609 239 152 1000 645 175 180 1000
Share of agreement 0.82 0.87 0.94 0.85 0.80 0.88 0.85 0.82
ECP≥0.5
Non-transport accidents 506 7 2 515 0.98 526 5 3 534 0.98
Suicide 22 209 7 238 0.88 50 157 22 229 0.69
Homicide 82 23 142 247 0.58 71 12 153 237 0.65
Total 610 239 151 1000 647 174 179 1000
Share of correct predictions
0.83 0.87 0.94 0.86 0.81 0.90 0.86 0.84
ECP≥0.6
Non-transport accidents 516 7 2 524 0.98 540 4 3 546 0.99
Suicide 22 214 6 242 0.88 45 161 22 228 0.71
Homicide 72 21 140 233 0.60 63 10 153 226 0.68
Total 610 242 148 1000 647 175 178 1000
Share of correct predictions
0.85 0.89 0.94 0.87 0.83 0.92 0.86 0.85
ECP≥0.7
Non-transport accidents 539 5 2 545 0.99 567 3 2 573 0.99
Suicide 21 226 7 254 0.89 34 163 22 219 0.74
Homicide 53 16 131 201 0.65 51 7 149 208 0.72
Total 613 248 139 1000 653 173 174 1000
Share of correct predictions
0.88 0.91 0.94 0.89 0.87 0.94 0.86 0.88
ECP≥0.75
Non-transport accidents 554 5 2 561 0.99 588 3 2 594 0.99
Suicide 21 234 7 262 0.89 25 160 21 206 0.78
Homicide 42 14 122 177 0.69 46 7 148 200 0.74
Total 617 252 130 1000 659 170 172 1000
Share of correct predictions
0.90 0.93 0.94 0.91 0.89 0.94 0.86 0.90
ECP≥0.8
Non-transport accidents 575 4 1 581 0.99 621 3 2 626 0.99
Suicide 20 243 7 270 0.90 17 149 18 184 0.81
Homicide 29 11 109 150 0.73 38 6 145 189 0.77
Total 625 258 117 1000 676 158 166 1000
Share of correct predictions
0.92 0.94 0.93 0.93 0.92 0.94 0.88 0.92
ECP≥0.85
the redistribution of EUIs by causes at different classifica-tion probabilities. For men, an increase in the ECP of 0.1 leads on average to a decreased proportion of EUIs reclas-sified as suicide of 6 per 1000, for non-transport accidents of 18 per 1000, and for homicides of 109 per 1000. For women, the results of reclassification regarding homicides and non-transport accidents looks slightly more resistant, with an increase in the ECP of 0.1 leading to a decrease in their proportion of 91 and 14 per 1000, respectively. The result for suicide demonstrates greater instability than for non-transport accidents. An increase in the ECP of 0.1 leads on average to a decrease in the proportion of EUIs reclassified as suicide of 33 per 1000. The share of suicides declines from 191 per 1000 (with no constraint on ECP)
to 6 per 1000 for an ECP≥0.9.
The lower part of Table 5 has the same meaning as shown in Fig. 2 but shows results for both men and women. One can see that the distribution of the results of the population-level adjustment of EUIs for both men and
women by cause is similar to the distribution by cause of
EUIs when reclassified with ECP≈0.85. The lower part of
Table 5 helps to show that similarity between the actual distribution of known causes of reclassified EUIs increases as the ECP increases. As expected, the proportion of non-transport accidents among all deaths of undetermined in-tent is lower, and the proportion of homicides is higher, than among deaths of determined intent. The proportion of suicides is about the same.
Table 6 presents the results of calculations based on the distribution of deaths of determined intent after the add-itional optional population level correction. Similar data by sex are presented in Appendix B. Using the standardized death rates on the right side of the table we can see that at
ECP≥0.75, only 6.4 % of deaths under consideration
re-main unclassified (6.7 % for men and 6.2 % for women). The population level adjustment included the majority of these cases being reclassified as non-transport accidents. A similar situation is observed for both men and women (as seen in Appendix B). For both sexes together, the SDR from suicide is slightly higher than from homicide, but for men this difference is greater (10 per 100,000) and for women the SDR from suicide is lower than from homicide.
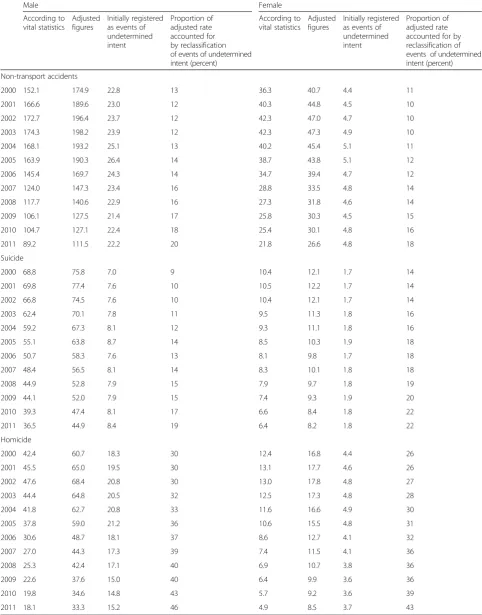
Table 7 shows annual SDRs for the years 2000–2011 for
(1) deaths officially registered as non-transport accidents, suicides, and homicides, (2) deaths officially registered as being of undetermined intent but that our model classified as non-transport accidents, suicides, or homicides, (3) the adjusted rate (i.e., the sum of these two groups), and (4) the proportion of the adjusted rate accounted for by re-classification of events of undetermined intent. The table shows that the SDRs for deaths that we classified as non-transport accidents or as suicides (but that were officially registered as EUIs) were essentially stable be-tween 2000 and 2011. Due to the decline in the death rate from officially registered suicides, however, the share of all suicides classified as events of unde-termined intent grew significantly. The male SDR for Table 3Distribution of deaths with known causes by actual and predicted cause (per 1000)(Continued)
Suicide 18 252 6 276 0.91 9 108 12 130 0.84
Homicide 16 8 87 112 0.78 27 6 136 169 0.81
Total 642 263 95 1000 733 117 150 1000
Share of correct predictions
0.95 0.96 0.92 0.95 0.95 0.93 0.91 0.94
ECP≥0.9
Non-transport accidents 667 3 1 671 0.99 843 3 2 848 0.99
Suicide 15 254 5 275 0.93 2 34 3 40 0.86
Homicide 5 3 45 54 0.84 11 3 98 112 0.87
Total 687 261 52 1000 857 40 103 1000
Share of correct predictions
0.97 0.98 0.87 0.97 0.98 0.85 0.95 0.97
Table 4Errors in estimating the total number of events in the
training set by three causes of death, and percentage of reclassified events undetermined intent
Relative error in prediction of the total number of actual cause of events (percent)
Percent of unclassified events of undetermined intent Non-transport
accidents
Suicide Homicide
No lower limit −17 4 59 0
ECP≥0.5 −16 5 56 3
ECP≥0.6 −14 5 50 10
ECP≥0.7 −11 6 38 26
ECP≥0.75 −9 6 31 38
ECP≥0.8 −7 6 24 49
ECP≥0.85 −5 6 16 62
ECP≥0.9 −2 5 5 75
deaths officially registered as homicides declined from 47.6 in 2002 to 18.1 in 2011. However, the SDR for deaths that our refined model classified as homicides (but that were officially registered as deaths of undeter-mined intent) declined at a much slower pace. There-fore, the share of all male homicides that were
classified as events of undetermined intent grew. A similar situation is observed for women.
Sensitivity analyses
First, it is possible that our exclusion of transport acci-dents when reclassifying EUIs biases our results. In
0 100 200 300 400 500 600 700 800 900 1000
ECP ≥ 0,5 ≥ 0,6 ≥ 0,7 ≥ 0,8
Population-level adjustment
≥ 0.9
Non-transport accidents Suicide Homicide
Fig. 2Distributions of the three imputed causes of death (both sexes) depending on constraints on the estimated classification probability, per 1000 cases
Table 5Results of our reclassifications of the set of events of undetermined intent using multinomial logistic regression, per 1000 cases
Male Female
Non-transport accidents
Suicides Homicides Unclassified Non-transport accidents
Suicides Homicides Unclassified
No constraint on ECP 259 109 632 0 212 191 597 0
ECP≥0.5 254 106 613 27 193 186 550 70
ECP≥0.6 242 104 554 101 175 165 495 164
ECP≥0.7 221 101 419 258 165 133 411 291
ECP > 0.75 209 100 326 366 160 98 296 447
ECP≥0.8 194 96 225 485 154 73 291 482
ECP≥0.85 174 86 130 610 141 37 189 634
ECP≥0.9 156 66 43 736 124 8 64 803
After the population-level adjustment
476 161 363 0 442 167 391 0
After proportional redistribution of unclassified EUIs
ECP≥0.5 261 109 630 - 208 200 591
-ECP≥0.6 269 116 616 - 209 197 592
-ECP≥0.7 298 136 565 - 233 188 580
-ECP > 0.75 329 158 513 - 289 177 534
-ECP≥0.8 377 186 437 - 297 141 562
-ECP≥0.85 446 221 333 - 385 101 515
-ECP≥0.9 591 250 163 - 629 41 325
-theory, some transport accidents—especially deaths due
to “Falling, lying or running in front of or into moving
object. Undetermined intent.” (Y31) and “Crashing of
motor vehicle. Undetermined intent” (Y32)—may be
re-corded as EUIs. However, these deaths make up only 1.2 % of all EUIs and 1.3 % of all transport accidents. It also would be difficult to include transport accidents in our general reclassification model due to peculiar values on some important explanatory variables. For example,
“Place of death” operates very differently in this context
and is not comparable with that for deaths due to other external causes. Nevertheless, we executed an additional mlogit model to distinguish between deaths due to transport accidents from those due to the combined group of non-transport accidents, suicides, and homi-cides. The model identifies transport accidents with a probability of error < .01. Application of the model score to EUI deaths shows that only 1.4 % can be classified as transport accidents (respective percentages for Y31 and Y32 are 1.3 and 3.6 %), while these deaths show much higher probabilities of being homicides or suicides. Re-sults are shown in Appendix D, and they suggest that in Russia transport accidents comprise a distinct group and that they have the potential to produce only a very minor impact on the distribution of EUIs and on the final distribution of external causes of death. Our deci-sion to exclude transport accidents from our reclassifica-tion is also supported by informareclassifica-tion gained from the processing of such cases and by prior research. For ex-ample, in Russia nearly all fatal transport accidents are rapidly followed by investigations by the road police (a distinct branch of the Russian police force) and by crim-inal investigators with forensic expertise, which dimin-ishes the chances for recording bias or classification as EUIs for such deaths. Further, although prior studies of the quality of cause of death diagnoses in Russia found that registration of deaths due to transport accidents has
some limitations, these are less problematic than for other types of accidents and violent deaths [1, 3, 4].
Most obviously, the percentage of deaths from “other”
and “unspecified” transport accidents comprise only 2.6
and 0.1 % of all deaths from transport accidents, respect-ively, which is much lower than corresponding categor-ies for non-transport accidents, suicides, and homicides. With respect to possible misclassification as EUIs, prior research focused on homicides and suicides but not
transport accidents [2, 5–9].
Second, the default method of redistribution is to reat-tribute deaths within sex- and age-groups propor-tionately to the numbers of non-transport accidents, suicides, and homicide in it. An important related ques-tion is how much value our model provides over this de-fault method. If our model-based results are very similar to the results from this default method of redistribution, then our model provides little added value (which would be an important finding in itself ). This default method of redistribution is a reasonable option in the absence of
any other information. A similar method is to assumea
priori that EUIs are hidden suicides [11, 17] or hidden homicides [3] or both (but not hidden non-transport ac-cidents) [18]. Prior studies of Russia, however, provide additional evidence suggesting non-proportional distri-butions. With natural causes, for example, there are strong reasons for adding ill-defined deaths from senility to the class of circulatory diseases [19, 20]. For EUIs spe-cifically, the evidence suggests possible misclassification of
homicides and suicides [1–9]. In spite of this, we are
un-aware of any studies that used the reclassification method we are proposing. Still, it is important to compare the cor-rected distribution of external causes based on our model with the default method of redistribution. We did this and our results are shown in Appendix E. The results show that our model-based redistributions differ substantially from the results of the default solution.
Table 6Distribution of deaths by cause according to officially registered vital statistics data and our reclassified figures
Number of deaths (thousand) SDR per 100,000
Total Non-transport accidents
Suicides Homicides Unclassified Total Non-transport accidents
Suicides Homicides Unclassified
Actual 2914 1481 541 379 512 160 82.2 29.1 20.7 28.0
ECP≥0.50 1605 605 686 18 89.0 32.5 37.6 1.0
ECP≥0.60 1598 601 657 58 88.6 32.3 35.9 3.2
ECP≥0.70 1589 597 593 136 88.1 32.1 32.4 7.4
ECP≥0.75 1583 593 550 188 87.8 31.9 30.1 10.3
ECP≥0.80 1576 588 502 248 87.4 31.6 27.4 13.6
ECP≥0.85 1567 580 452 315 86.9 31.2 24.7 17.3
ECP≥0.90 1558 569 404 384 86.4 30.6 22.0 21.0
After the population level adjustment
Table 7Annual sex-specific standardized death rates per 100,000 residents for non-transport accidents, suicides, and homicides in Russia according to officially registered vital statistics data and our corrected data after the population level adjustment, 2000–2011
Male Female
According to vital statistics
Adjusted figures
Initially registered as events of undetermined intent
Proportion of adjusted rate accounted for by reclassification of events of undetermined intent (percent)
According to vital statistics
Adjusted figures
Initially registered as events of undetermined intent
Proportion of adjusted rate accounted for by reclassification of events of undetermined intent (percent)
Non-transport accidents
2000 152.1 174.9 22.8 13 36.3 40.7 4.4 11
2001 166.6 189.6 23.0 12 40.3 44.8 4.5 10
2002 172.7 196.4 23.7 12 42.3 47.0 4.7 10
2003 174.3 198.2 23.9 12 42.3 47.3 4.9 10
2004 168.1 193.2 25.1 13 40.2 45.4 5.1 11
2005 163.9 190.3 26.4 14 38.7 43.8 5.1 12
2006 145.4 169.7 24.3 14 34.7 39.4 4.7 12
2007 124.0 147.3 23.4 16 28.8 33.5 4.8 14
2008 117.7 140.6 22.9 16 27.3 31.8 4.6 14
2009 106.1 127.5 21.4 17 25.8 30.3 4.5 15
2010 104.7 127.1 22.4 18 25.4 30.1 4.8 16
2011 89.2 111.5 22.2 20 21.8 26.6 4.8 18
Suicide
2000 68.8 75.8 7.0 9 10.4 12.1 1.7 14
2001 69.8 77.4 7.6 10 10.5 12.2 1.7 14
2002 66.8 74.5 7.6 10 10.4 12.1 1.7 14
2003 62.4 70.1 7.8 11 9.5 11.3 1.8 16
2004 59.2 67.3 8.1 12 9.3 11.1 1.8 16
2005 55.1 63.8 8.7 14 8.5 10.3 1.9 18
2006 50.7 58.3 7.6 13 8.1 9.8 1.7 18
2007 48.4 56.5 8.1 14 8.3 10.1 1.8 18
2008 44.9 52.8 7.9 15 7.9 9.7 1.8 19
2009 44.1 52.0 7.9 15 7.4 9.3 1.9 20
2010 39.3 47.4 8.1 17 6.6 8.4 1.8 22
2011 36.5 44.9 8.4 19 6.4 8.2 1.8 22
Homicide
2000 42.4 60.7 18.3 30 12.4 16.8 4.4 26
2001 45.5 65.0 19.5 30 13.1 17.7 4.6 26
2002 47.6 68.4 20.8 30 13.0 17.8 4.8 27
2003 44.4 64.8 20.5 32 12.5 17.3 4.8 28
2004 41.8 62.7 20.8 33 11.6 16.6 4.9 30
2005 37.8 59.0 21.2 36 10.6 15.5 4.8 31
2006 30.6 48.7 18.1 37 8.6 12.7 4.1 32
2007 27.0 44.3 17.3 39 7.4 11.5 4.1 36
2008 25.3 42.4 17.1 40 6.9 10.7 3.8 36
2009 22.6 37.6 15.0 40 6.4 9.9 3.6 36
2010 19.8 34.6 14.8 43 5.7 9.2 3.6 39
Third, our analyses can be used for two distinct applica-tions. One is to estimate the correct cause of death for any particular individual case. Another is to obtain the best es-timate of population-level incidence of each type of injury. It is intuitive to employ the estimated probability as we do for the former, but not necessarily intuitive to use a threshold on the estimated classification probability for the latter. Our primary interest is to establish more precise population-level data on external cause mortality (i.e., the second application), which is why after the individual-level reclassification of EUIs with mlogit we make the population-level adjustment on the EUI cases with the low mlogit probabilities. By employing the cutoff points in assigning cause of death our aim is to provide a more reli-able basis for the population-level distribution. When we do so, we assume that the solutions with the mlogit prob-abilities below the cutoff suggest that insufficient informa-tion is provided by the explanatory variables. With the help of combinatorics, we know that the probability of get-ting (for example) a combination of 8 accidents, 1 homi-cide, and 1 suicide in ten trials is 0.151. It is also possible to interpret the hypothetical mlogit return of (0.8, 0.1, 0.1) as a vector of classification probabilities belonging to three fuzzy sets of deaths. This three-cause proportional sharing-based approach leads to a specific distribution by cause of death. We show the results of this proportional sharing-based redistribution in Appendix E, and again it is substantially different from our model-based distribution. We thank one of our reviewers for this suggestion.
Finally, we considered the possibility of preliminary con-formal grouping because in theory it seems attractive to do separate redistributions for a few more homogeneous subgroups of EUIs within the corresponding specific cat-egories of suicide, homicide, and non-transport accidents. Two reasons, however, make it very difficult to build reli-able correspondences between EUI subgroups and the subgroups of non-transport accidents, suicides, and
homi-cides. One reason is that prior studies of Russia [1–9]
sug-gest imprecise registration of single item injuries and of violent causes, as well as high numbers of deaths due to
“other”and“unspecified”events within subgroups of
acci-dents and within subgroups of suicide and homicide. In particular, reclassification of falls of unknown intent (Y30) into unintentional falls (W00-W19), suicide by jumping (X80), and assault by pushing from high place (Y01) as-sumes these categories are reliable without false exchanges with other items. Yet we know that such exchanges are probable due to the low quality of single items and that it is better to use more reliable aggregate categories. Further, Y30 may be confused with Y31 and with Y33 and Y34, and
items Y33-Y34 (“Other specified or unspecified events.
Undetermined intent.”), which can be included in any
group, composed 31 % of all EUIs in Russia during the
period under study (2000–2011). The second reason is
that there is a formal problem due to the presence of
“other” and unspecified categories. One does not know,
for example, what part of Y33 and Y34 should be assigned to Y30 and what part of X58-X59 should be assigned to W00-W19 before estimating the regression model.
Discussion
The rate of external causes of death due to events of undetermined intent is extremely high in Russia, about 28 per 100,000 residents between 2000 and 2011. Their proportion of all deaths from external causes accelerated in the years following the collapse of the Soviet Union, and the rate has not declined at the same pace as known external causes of death over the last decade (Fig. 1 above; [1, 7, 14]). However, Russia and other East European nations are not the only countries to experience limitations in classification of external causes of death. Between 2000 and 2010, for example, Table 1 shows that the proportion of all external deaths classified as events of undetermined intent was 15 % in Russia, 12 % in the United Kingdom, 10 % in Poland, 8 % in Sweden, 7 % in Germany, and 6 % in Denmark and the Czech Republic.
This limitation has important practical, scientific, and policy implications. For example, the rate at which the
“event of undetermined intent” category is used may
pro-vide an indicator of the quality of vital statistics data, at least for external causes of death [1, 7]. There are legitimate
reasons—e.g., truly unknown intent, overworked and
un-derstaffed coroner’s offices—to use this category.
Unfortu-nately, there are reasons to believe that in some nations at some times this category may be employed to purposely misclassify homicide and suicide deaths [7, 17, 21]. Whether purposely or as an unintended consequence, an-other implication is that regular use of this category leads to under-enumeration of rates of important social indica-tors like homicide and suicide. As we show here, this under-enumeration can be substantial, and annual public reports of homicide and suicide rates rarely allude to EUIs as limitations of the reported rate. Another implication is that scholars interested in the structural covariates of homi-cide and suihomi-cide rates seem largely unaware of this category and do not account for it in their analyses, which may threaten the validity of these studies. The validity of individual-level studies of external causes of death may be similarly threatened, as are studies of interventions aimed at reducing deaths due to accident, suicide, or homicide.
a substantial portion of them are murders and that the mis-classification in some instances may be purposeful [1, 7].
A recent study by Ivanova et al. [22] made use of com-parisons between deaths from known accidents, suicides, homicides, and events of undetermined intent by employ-ing the distributions of the character of injury for deaths within the range of ages 20 to 59. Focusing on the most frequent combination of the type of injury and cause, their study offered a version of EUI redistribution, with a major-ity of EUIs being assigned either to homicides (34 %) or suicides (27 %).
Our study extends this recent work by bringing to bear a large set of informative micro-data. We were able to model the relationships between the three causes of death (non-transport accident, suicide, and homicide) and ten independent variables, which allowed us to pre-dict the cause of death for EUI cases. The model tended unambiguously to assign most of EUIs to either homi-cide or to non-transport achomi-cidents, with a smaller role of
suicide. With ECP≥0.75, 33 % of EUIs were reclassified
as homicides, 20 % as non-transport accidents, and 10 % as suicides, with 37 % remaining unclassified.
If one assumes that the probabilities of misclassifica-tion of causes of death for the EUIs are the same as the corresponding probabilities for deaths with known causes, the entire set of EUIs would be distributed with 48 % of cases assigned to non-transport accidents, 36 % assigned to homicides, and 16 % assigned to suicides. This result suggests that the proportion of hidden homicides among EUIs was 131 % higher than the corresponding proportion among the injury deaths of determined intent (36 % vs. 16 %). For suicides, these proportions are 16 % vs. 23 %, and for non-transport accidents they are 47 % vs. 62 %. Al-though we did not find strong support for the hypothesis that the EUI category is used mainly for hiding murder, the redistribution of EUIs does result in a substantial ele-vation of the official mortality figures for homicide. After the adjustment, the Russian age standardized homicide rate for 2011 is 20.0 per 100,000, which is nearly double the officially recorded value of 11.1 per 100,000. Similarly, the adjusted suicide rate of 24.9 exceeds the official rate of 20.0 by one-quarter.
There are further implications for homicide. Accord-ing to our imputation, 33 % of all (i.e., officially recorded plus hidden) homicides were initially classified as EUIs (compared to 9 % of all non-transport accident and 5 % of all suicide deaths). Between 2000 and 2011, this pro-portion increased from 28 to 44 %. This supports the concerns of some scholars [1, 7] about the quality of the Russian homicide data and the validity of the officially registered reduction in homicide mortality in Russia.
Ac-cording to Antonova’s [23] estimates, the actual number
of homicides at ages 20–39 years was about 1.5 times
higher than that registered by official data, and at ages
40–59 the actual number of homicides was nearly twice
as high as the official figure.
Beyond the quality of vital statistics data and their use by scholars, this also may be considered an important sig-nal for police (which record even fewer homicides than the vital statistics), criminal justice, and society as a whole.
While there is no doubt many“hidden”homicides are
le-gitimately classified as events of undetermined intent due to lack of biomedical and legal evidence, it is difficult to ignore the likelihood that a non-trivial proportion of them is hidden due to the weaknesses within the system for in-vestigation or other reasons.
It is not uncommon for Russian pathologists to issue a provisional death certificate, which allows for burial but does not contain the precise cause of death. Although it is assumed a qualified certificate will be issued later to be used for vital statistics registration, in practice this does not always happen. In these cases, agencies must depend on the provisional death certificates. Gavrilova et al. [1] hypothesized that the increase in deaths attributed to un-known causes was due to a growing proportion of
“Provisional” death certificates. Using data for 2011, we
found that 32 % of deaths registered via a provisional death certificate were EUIs compared to 23 % of deaths registered via a final death certificate. Nevertheless, 80 % of all EUIs are based on final death certificates, so it does not appear that categorizing deaths as due to undeter-mined intent is a function of insufficient time to make an accurate diagnosis.
Conclusions
Overuse of the external cause of death classification
“event of undetermined intent” may indicate
question-able quality of mortality data on external causes of death. This can have wide-ranging implications for fam-ilies, medical professionals, the justice system, re-searchers, and policymakers. We propose an indirect statistical method for reclassifying these deaths as non-transport accidents, suicides, or homicides, and at the population level we provide a means of further refining
the method’s outcomes. With the classification
Appendix A
Table 8Mlogit outputs (The base outcome is the last categoryHomicide)
Male Female
B SE p-value B SE p-value
1. Non-transport accidents
1.0. Intercept −3.419 0.058 0.000 −3.382 0.157 0.000
1.1. Knowledge of identity
1.1.1. Identified person 0.770 0.020 0.000 0.520 0.039 0.000
1.1.2. Unidentified person 0(*) . . 0(*) . .
1.2. Age group
1.2.1. 0–14 0.940 0.039 0.000 1.183 0.073 0.000
1.2.2. 15–24 −0.248 0.033 0.000 −0.282 0.070 0.000
1.2.3. 25–34 −0.399 0.032 0.000 −0.358 0.069 0.000
1.2.4. 35–44 −0.294 0.031 0.000 −0.298 0.069 0.000
1.2.5. 45–54 −0.050 0.031 0.111 −0.019 0.068 0.780
1.2.6. 55–64 0.248 0.032 0.000 0.173 0.069 0.012
1.2.7. 65 and older 0.618 0.032 0.000 0.586 0.068 0.000
1.2.8. unknown 0(*) . . 0(*) . .
1.3. Year of death
1.3.1. 2000–2002 −0.197 0.008 0.000 −0.278 0.014 0.000
1.3.2. 2003–2005 −0.191 0.008 0.000 −0.249 0.014 0.000
1.3.3. 2006–2011 0(*) . . 0(*) . .
1.4. Type of day
1.4.1. Monday or a day after national holiday 0.002 0.009 0.816 0.003 0.016 0.858
1.4.1. Other weekdays 0(*) . . 0(*) . .
1.5. Season of year
1.5.1. December-February −0.369 0.007 0.000 −0.261 0.014 0.000
1.5.2. June-August −0.517 0.009 0.000 −0.342 0.016 0.000
1.5.3. Other months 0(*) . . 0(*) . .
1.6. Geographic region
1.6.1. Central Federal District except Moscow −0.344 0.013 0.000 −0.467 0.023 0.000
1.6.2. North West Federal District −0.467 0.014 0.000 −0.441 0.025 0.000
1.6.3. South Federal Districtand Stavropol kray −0.624 0.015 0.000 −0.847 0.028 0.000
1.6.4. Volga Federal District −0.681 0.012 0.000 −0.670 0.021 0.000
1.6.5. Urals Federal District −0.846 0.014 0.000 −0.798 0.025 0.000
1.6.6. Siberian Federal District −1.327 0.013 0.000 −1.208 0.023 0.000
1.6.7. Far East Federal District −0.655 0.015 0.000 −0.448 0.029 0.000
1.6.8. Republics of North Caucasian Federal District −0.093 0.023 0.000 0.510 0.051 0.000
1.6.9. Moscow and Moscow region 0(*) . . 0(*) . .
1.7. Urban/rural residence
1.7.1. Rural area −0.042 0.007 0.000 −0.199 0.014 0.000
1.7.2. Urban area 0(*) . . 0(*) . .
1.8. Type of injury
Table 8Mlogit outputs (The base outcome is the last categoryHomicide)(Continued)
1.8.2. Intracranial injury 3.049 0.049 0.000 3.134 0.143 0.000
1.8.3. Other Injuries to the head 3.083 0.049 0.000 3.443 0.142 0.000
1.8.4. Injuries to the neck 2.118 0.051 0.000 1.856 0.147 0.000
1.8.5. Open wound of thorax 1.605 0.050 0.000 2.383 0.143 0.000
1.8.6. Other injuries to the abdomen, lower back, lumbar spine and pelvis 1.869 0.051 0.000 2.610 0.144 0.000
1.8.7. Injuries to the abdomen, lower back, lumbar spine and pelvis 3.276 0.052 0.000 5.517 0.144 0.000
1.8.8. Injuries to the limbs 3.332 0.049 0.000 3.972 0.142 0.000
1.8.9. Effects of foreign body entering through natural orifice 8.407 0.059 0.000 8.395 0.150 0.000
1.8.2. Burns and corrosions 7.101 0.054 0.000 7.588 0.146 0.000
1.8.3. Frostbite 9.378 0.128 0.000 10.384 0.334 0.000
1.8.4. Poisoning by narcotics and psychodysleptics [hallucinogens] 9.266 0.073 0.000 9.556 0.167 0.000
1.8.5. Toxic effect of carbon monoxide 11.758 0.114 0.000 11.828 0.231 0.000
1.8.6. Other poisoning by drugs, medicaments and biological substances, toxic effects of substances chiefly nonmedicinal as to source
9.756 0.066 0.000 9.932 0.157 0.000
1.8.7. Hypothermia and other effects of reduced temperature 10.881 0.084 0.000 11.499 0.196 0.000
1.8.8. Asphyxiation 4.332 0.049 0.000 3.552 0.142 0.000
1.8.9. Effects of lightning, drowning and nonfatal submersion, vibration, electric current and other specified effects
8.055 0.056 0.000 7.996 0.149 0.000
1.8.10. Other injury, poisoning and consequences of external causes 0(*) . . 0(*) . .
1.9. Presence of alcoholic intoxication at death
1.9.1. No −0.483 0.020 0.000 −0.942 0.037 0.000
1.9.2. Yes 0(*) . . 0(*) . .
1.10. Specific location of death
1.10.1. Home −0.349 0.008 0.000 −0.401 0.014 0.000
1.10.2. Residential institution −0.617 0.038 0.000 −0.803 0.071 0.000
1.10.3. School, other institution and public administrative area 0.098 0.025 0.000 0.117 0.051 0.022
1.10.4. Sports and athletics area −0.538 0.015 0.000 −0.295 0.032 0.000
1.10.5. Street and highway −0.369 0.046 0.000 −0.834 0.105 0.000
1.10.6. Trade and service area 2.093 0.026 0.000 1.197 0.084 0.000
1.10.7. Other specified places 0.233 0.012 0.000 −0.039 0.026 0.142
1.10.8. Unspecified place 0(*) . . 0(*) . .
2. Suicide
2.0. Intercept −4.510 0.043 0.000 −5.777 0.110 0.000
2.1. Knowledge of identity
2.1.1. Identified person 1.362 0.023 0.000 1.303 0.040 0.000
2.1.2. Unidentified person 0(*) . . 0(*) . .
2.2. Age group
2.2.1. 0–14 −1.689 0.047 0.000 −1.030 0.082 0.000
2.2.2. 15–24 0.229 0.039 0.000 0.409 0.077 0.000
2.2.3. 25–34 −0.051 0.038 0.180 0.299 0.076 0.000
2.2.4. 35–44 −0.111 0.038 0.003 0.393 0.076 0.000
2.2.5. 45–54 −0.012 0.038 0.748 0.551 0.076 0.000
2.2.6. 55–64 0.131 0.038 0.001 0.637 0.076 0.000
Table 8Mlogit outputs (The base outcome is the last categoryHomicide)(Continued)
2.2.8. unknown 0(*) . . 0(*) . .
2.3. Year of death
2.3.1. 2000–2002 −0.027 0.008 0.001 −0.189 0.013 0.000
2.3.2. 2003–2005 −0.245 0.008 0.000 −0.315 0.013 0.000
2.3.3. 2006–2011 0(*) . . 0(*) . .
2.4. Type of day
2.4.1. Monday or day following a national holiday 0.077 0.009 0.000 0.048 0.015 0.001
2.4.1. Other weekdays 0(*) . . 0(*) . .
2.5. Season of year
2.5.1. December-February −0.082 0.008 0.000 −0.205 0.013 0.000
2.5.2. June-August −0.231 0.009 0.000 −0.468 0.015 0.000
2.5.3. Other months 0(*) . . 0(*) . .
2.6. Geographic region
2.6.1. Central Federal District except Moscow 0.067 0.015 0.000 −0.539 0.024 0.000
2.6.2. North West Federal District 0.160 0.015 0.000 −0.323 0.025 0.000
2.6.3. South Federal Districtand Stavropol kray 0.131 0.016 0.000 −0.448 0.026 0.000
2.6.4. Volga Federal District 0.176 0.013 0.000 −0.390 0.022 0.000
2.6.5. Urals Federal District 0.227 0.015 0.000 −0.255 0.024 0.000
2.6.6. Siberian Federal District −0.135 0.014 0.000 −0.425 0.022 0.000
2.6.7. Far East Federal District −0.116 0.016 0.000 −0.395 0.028 0.000
2.6.8. Republics of North Caucasian Federal District −0.442 0.032 0.000 −0.296 0.061 0.000
2.6.9. Moscow and Moscow region 0(*) . . 0(*) . .
2.7. Urban/rural residence
2.7.1. Rural area 0.277 0.007 0.000 0.099 0.012 0.000
2.7.2. Urban area 0(*) . . 0(*) . .
2.8. Type of injury
2.8.1. Fracture of skull and facial bones 1.277 0.022 0.000 0.859 0.090 0.000
2.8.2. Intracranial injury 0.145 0.025 0.000 1.011 0.087 0.000
2.8.3. Other Injuries to the head −0.514 0.024 0.000 −0.088 0.087 0.313
2.8.4. Injuries to the neck 0.445 0.024 0.000 1.164 0.084 0.000
2.8.5. Open wound of thorax 0.133 0.021 0.000 1.182 0.081 0.000
2.8.6. Other injuries to the abdomen, lower back, lumbar spine and pelvis −0.218 0.026 0.000 1.151 0.085 0.000
2.8.7. Injuries to the abdomen, lower back, lumbar spine and pelvis 2.272 0.024 0.000 3.650 0.083 0.000
2.8.8. Injuries to the limbs 1.064 0.021 0.000 2.842 0.079 0.000
2.8.9. Effects of foreign body entering through natural orifice 2.211 0.054 0.000 3.484 0.111 0.000
2.8.2. Burns and corrosions 2.648 0.038 0.000 4.202 0.090 0.000
2.8.3. Frostbite 2.016 0.245 0.000 4.991 0.381 0.000
2.8.4. Poisoning by narcotics and psychodysleptics [hallucinogens] 6.100 0.058 0.000 9.162 0.118 0.000
2.8.5. Toxic effect of carbon monoxide 4.422 0.115 0.000 6.240 0.211 0.000
2.8.6. Other poisoning by drugs, medicaments and biological substances, toxic effects of substances chiefly nonmedicinal as to source
3.540 0.055 0.000 3.914 0.123 0.000
2.8.7. Hypothermia and other effects of reduced temperature 3.094 0.102 0.000 4.395 0.200 0.000
Appendix B
Table 8Mlogit outputs (The base outcome is the last categoryHomicide)(Continued)
2.8.9. Effects of lightning, drowning and nonfatal submersion, vibration, electric current and other specified effects
2.819 0.043 0.000 4.360 0.098 0.000
2.8.10. Other injury, poisoning and consequences of external causes 0(*) . . 0(*) . .
2.9. Presence of alcoholic intoxication at death
2.9.1. No 0.258 0.023 0.000 0.465 0.039 0.000
2.9.2. Yes 0(*) . . 0(*) . .
2.10. Specific location of death
2.10.1. Home 0.498 0.008 0.000 0.401 0.014 0.000
2.10.2. Residential institution 0.316 0.034 0.000 0.140 0.058 0.016
2.10.3. School, other institution and public administrative area 0.497 0.030 0.000 0.552 0.057 0.000
2.10.4. Sports and athletics area −0.916 0.021 0.000 −0.024 0.037 0.504
2.10.5. Street and highway 0.003 0.050 0.958 −1.065 0.108 0.000
2.10.6. Trade and service area 0.262 0.041 0.000 −0.266 0.124 0.031
2.10.7. Other specified places −0.376 0.014 0.000 −0.272 0.026 0.000
2.10.8. Unspecified place 0(*) . . 0(*) . .
3. Homicide the base
outcome
(*)
This parameter is set to zero because it is redundant
Table 9Distribution of deaths by sex and by cause according to officially registered vital statistics data and our reclassified figures
Number of deaths (thousand) SDR per 100,000
Total Non-transport accidents
Suicide Homicide Unclassified Total Non-transport accidents
Suicide Homicide Unclassified
Male
Actual 2284 1146 451 286 402 276.1 140.1 53.8 33.5 48.8
ECP≥0.50 1248 493 532 11 152.4 58.9 63.3 1.5
ECP≥0.60 1243 492 508 41 151.8 58.7 60.1 5.5
ECP≥0.70 1235 491 454 104 150.8 58.6 53.3 13.3
ECP≥0.75 1230 491 417 147 150.2 58.6 48.8 18.5
ECP≥0.80 1223 489 376 195 149.5 58.4 44.0 24.3
ECP≥0.85 1216 485 338 246 148.6 57.9 39.5 30.2
ECP≥0.90 1208 477 303 296 147.7 56.9 35.5 36.1
After the population level adjustment
1337 515 432 --- 163.3 61.6 51.2
---Female
Actual 630 336 91 94 110 62.0 33.4 8.6 9.4 10.7
ECP≥0.50 357 111 154 8 35.5 10.5 15.3 0.6
ECP≥0.60 355 109 148 18 35.3 10.3 14.7 1.6
ECP≥0.70 354 105 139 32 35.2 10.0 13.8 3.0
ECP≥0.75 353 102 133 41 35.2 9.7 13.3 3.9
ECP≥0.80 353 99 126 53 35.1 9.3 12.6 5.0
ECP≥0.85 351 95 114 70 35.0 8.9 11.5 6.6
ECP≥0.90 350 92 101 88 34.8 8.6 10.1 8.5
After the population level adjustment
---Appendix C
Table 10Distributions of cases by independent variables
Male Female
Non-transport accidents
Suicide Homicide Events of undetermined intent
Non-transport accidents
Suicide Homicide Events of undetermined intent
Total 100 100 100 100 100 100 100 100
Knowledge of identity
Identified person 94.20 98.42 93.74 93.07 95.03 98.87 95.31 94.87
Unidentified person 5.80 1.58 6.26 6.93 4.97 1.13 4.69 5.13
Age group
0–14 2.38 0.63 0.80 1.05 4.34 1.06 2.10 2.27
15–24 6.67 14.54 11.05 8.36 5.07 12.19 10.27 7.22
25–34 14.85 20.36 21.44 17.27 9.18 13.22 16.69 12.07
35–44 20.72 19.88 24.75 20.59 14.57 14.29 19.07 15.13
45–54 27.32 21.13 23.48 25.26 22.73 16.51 19.83 20.06
55–64 15.88 10.53 10.27 14.71 17.48 11.00 11.95 15.04
65 and older 9.85 12.36 5.80 10.38 24.85 31.47 18.51 26.60
Unknown 2.34 0.57 2.41 2.37 1.78 0.26 1.57 1.61
Year of death
2000–2002 28.95 31.44 33.40 25.14 28.46 29.89 33.55 24.31
2003–2005 30.02 27.33 30.80 27.38 29.69 26.62 30.82 26.83
2006–2011 41.03 41.24 35.80 47.48 41.85 43.49 35.64 48.86
Type of day
Monday or a day after national holiday 15.11 16.03 15.12 15.36 15.56 15.99 15.30 15.42
Other weekdays 84.89 83.97 84.88 84.64 84.44 84.01 84.70 84.58
Season of year
December-February 48.31 50.60 50.71 50.24 47.74 50.75 50.10 49.82
June-August 27.67 20.97 24.90 22.09 32.20 19.98 25.73 23.61
Other months 24.02 28.43 24.39 27.67 20.06 29.27 24.17 26.57
Geographic region
Central Federal District except Moscow 16.71 12.64 11.35 16.54 14.85 11.39 12.57 15.45
North West Federal District 11.32 9.12 9.07 10.44 11.68 9.89 9.30 11.33
South Federal Districtand Stavropol Krai 7.31 8.29 7.35 14.13 6.21 8.23 7.94 13.54
Volga Federal District 22.80 27.99 19.16 23.20 22.81 23.80 21.50 22.19
Urals Federal District 9.18 10.54 10.74 10.36 9.40 11.18 10.71 11.26
Siberian Federal District 17.44 19.63 23.64 13.14 19.52 21.62 22.24 14.62
Far East Federal District 5.36 6.08 8.35 5.77 5.66 6.04 6.82 5.17
Republics of North Caucasian Federal District 1.09 0.58 1.61 0.64 1.03 0.60 0.77 0.43
Moscow and Moscow Region 8.78 5.13 8.73 5.78 8.83 7.26 8.14 6.00
Urban/rural residence
Rural area 31.42 40.71 27.80 21.08 32.10 35.22 29.13 21.52
Urban area 68.58 59.29 72.20 78.92 67.90 64.78 70.87 78.48
Type of injury
Fracture of skull and facial bones 1.21 1.76 7.40 5.41 0.79 0.30 6.44 3.85
Intracranial injury 2.00 0.67 8.13 7.09 1.09 0.40 6.71 3.82