A THEORETICAL APPROACH TO
OPTIMIZE THE BATH PARAMETERS
OF ELECTROLESS Ni-Co-P COATING
ON THE RESPONSE OF SURFACE
ROUGHNESS
Subhasish Sarkar
Department Of Mechanical Engineering, Jadavpur University, Kolkata,West Bengal-700032, India [email protected]
Rishav Kumar Baranwal
Department Of Mechanical Engineering, Jadavpur University, Kolkata,West Bengal-700032, India [email protected]
Sameer Lamichaney
Department Of Mechanical Engineering, Jadavpur University, Kolkata,West Bengal-700032, India [email protected]
Gautam Majumdar
Department Of Mechanical Engineering, Jadavpur University, Kolkata,West Bengal-700032, India [email protected]
Abstract This paper informs the experimental study of surface roughness of the electroless Ni-Co-P coating over Copper strips. L27 orthogonal arrays in Taguchi was being used to optimize the three bath parameters (Cobalt Sulphate, Sodium Hypophosphite and temperature of the bath) with an aim to obtain optimal (minimum) surface roughness. The Analysis of Variance (ANOVA) indicated that Cobalt Sulphate and Sodium Hypophosphite played an important role in determining the surface roughness. The interaction between Cobalt Sulphate and Sodium Hypophosphite played a significant role in determining the Surface roughness of the coating as well. Scanning Electron Microscopy (SEM) was done to study the surface morphology and XRay Diffraction (XRD) analysis was done to find the phases present in the optimized coating. Energy Dispersive X-ray Spectroscopy (EDAX) analysis was done to composition of the coatings.
Keyowrds: Electroless Coating, orthogonal, Taguchi, Surface roughness, Characterisation Introduction
In order to ensure proper tribological and mechanical properties a number of ways has been invented. Electroless coating has been one of the most effective techniques as it can deposit a very uniform layer of coating in due course of time and can be plated over any form of geometry. It differs from the traditional electroplating technique as there is no external source of energy. Electroless Ni-P coatings are used on a large scale in industries due to its better corrosion, wear, hardness properties and less surface roughness and friction coefficient [Narayanan et al. (2006), Staia et al. (1996) , Sahoo (2009) ]. However these properties can be
further improved by the addition of a third element/oxides like TiO2, Co, W, Al2O3, B4C, ZrO2 to form a composite or an alloy electroless coating [Gadhari & Sahoo (2014), Ebrahimian-hosseinabadi et al. (2006),
Balaraju et al. (2006), Palaniappa & Seshadri (2008), Karthikeyan & Vijayaraghavan (2016), Huang et al.
(2007), Song et al. (2007), Alirezai et al. (2004), Guleryuz et al. (2012)]. Copper is used as substrate as copper
has a lot of applications in our daily life and is readily available for applications at a lower cost. So by electroless deposition an attempt has been made to improve the surface property of copper. However, the electroless deposition 3 depends on the electroless bath we prepare. The electroless bath generally contains a source of ions which needs to be deposited, a reducing agent, a bath stabilizer, a complexing agent in a specific metal ion concentration of the bath. The thickness of the coating is the function of all the above parameters [Narayanan et al. (2003)] and it has been noticed that the reducing agent (Sodium Hypophosphite) affects the Ni
and P deposition [Choudhury et al. (2009)] over the substrate. The deposition of P is also influenced by the
electroless alloy coatings as it imparts good magnetic properties to the substrate [Aal et al. (2008), Narayanan et al. (2003)]. It also improves the corrosion resistance and thereby protects the substrate from getting corroded in
a corrosive environment [Aixiang et al. (2005)]. The hardness of the Ni-Co-P coating was found to be better
than the substrate [Aixiang et al. (2005)]. However no mention of the surface roughness has been reported about
this particular alloy coating. In textile industries machinery parts play a very important role in maintaining the surface roughness of the yarn [Feldstein (1982)]. Hence, machinery parts with minimum surface roughness are required to be produced. In case of substances which are machined in order to give a particular design, the surface roughness of the machined substances is very high [Karagiannis et al. (2014)] which leads to increased
wear, thus reducing the life of the machined parts. We have applied the Taguchi optimisation technique to the bath parameters so that we get the minimum surface roughness in accordance to the bath parameters. Surface Roughness can cause friction and wear which is undesirable in most cases except in those where the surface roughness produces special surfaces which can increase the lubrication properties [Elansezhian et al. (2008)]. So
it is necessary to optimise roughness. The Ni-Co-P coatings were deposited over Copper substrate and the Taguchi method was applied in order to optimise these coatings in order to find the coating having the optimum surface roughness. A Taguchi orthogonal design was implied on these coatings through the design parameters which includes concentration of Cobalt Sulphate, Sodium 4 Hypophosphite and the bath temperature. Analysis of variance was carried out based on the optimised result to find the importance of each factor and their interaction with each other. The surface morphology was studied using Scanning Electron Microscope and the composition of the coating was studied using XRD and EDX analysis.
2. Taguchi Method
It is a dominant tool for designing systems based on orthogonal arrays so that the variance in the experiments is minimized. It has been applied in a wide range of experiments to optimize the output result [Basavaraja et al.
(2017), Jeyapaul et al. (2005), Singh et al. (2013)]. The use of orthogonal arrays is done to ensure reduction in
the number of experiments. It is certain to deliver quality while we are designing as per the result. Taguchi Optimization is a very effective optimisation technique as it not only saves time but also is cost efficient as it reduces the experimentation time. The parametric design of Taguchi method focuses on determining the levels of various which produces the specific output (surface roughness in the present case). We should try to accommodate as many number of factors as possible to identify the non-significant variables [Asiltürk & Akkuş (2011)]. Taguchi’s method uses Signal to Noise (S/N) ratio to check the performance of the coatings. It is represented as a logarithmic function of the objective function. It is the ratio of the mean of the factors to the variance due to errors. The S/N ratios are computed based on whether the output needs to be minimized or maximized or kept at a nominal value. Our knowledge of surface roughness allows us to use S/N ratio which outputs to minimized surface roughness, as higher Surface Roughness will cause wear and erosion of the coatings surface. The S/N ratio for such case is given as:
= −10 log ( ∗ ∑ ) (1)
Where, y is the measured data or the response for each experiment carried out. In our case y is the surface Roughness. From the earlier definition of S/N value, it can be stated that higher value of the S/N ratio will imply less prominent noise which ensures better quality.
3 Experimental Details 3.1 Coating Deposition
Table 1 Composition of the electroless bath
Bath Composition Reagents (g/L)
Nickel Source NiSO4.6H2O 5
Cobalt Source CoSO4 10/15/20
Reducing Agent NaH2PO4 20/25/30
Complexing Agent Na3C6H5O7.2H2O 15
Buffering Agent (NH4)2SO4 10
The electroless bath volume was 250 mL. The electroless coating was carried at a pH of 5 and the temperature of the bath was varied between 80°C, 85°C and 90°C. The deposition time was 60 minutes. Hence from the experiment we can conclude that the concentrations of Nickel Sulphate hexahydrate, Complexing agent and the buffering agent were fixed while the concentrations of Cobalt Sulphate (A) and Sodium hypophosphite (B) was varied. The pH of the solution was kept constant while the temperature (C) was made to vary.
3.2 Response Variable
The performance characteristics of these experiments/coatings were the surface roughness of the coatings. The bath parameters of the electroless deposition is optimised in order to get optimal (minimum) surface roughness.
3.3 Design OF Experiment
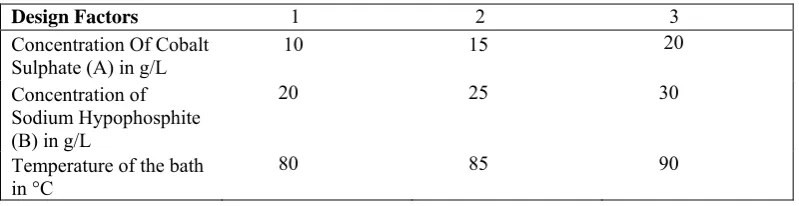
Design of Experiments is an impressive tool to determine the optimized response. Taguchi method uses orthogonal arrays for determining the optimized coating parameters. A minimum number of experiments is suggested by the orthogonal arrays in which the direct effect of all the factors at their different levels and the interaction of factors at different levels was considered to the response. Coatings’ response varied with the variation in bath temperature, concentration of the source and the concentration of the reducing agent and has been taken as our design factors. The variations in the levels of these three parameters are shown in table 2.
Table 2 Variation of the factors Levels:
Design Factors 1 2 3
Concentration Of Cobalt
Sulphate (A) in g/L 10 15
20
Concentration of Sodium Hypophosphite (B) in g/L
20 25 30
Temperature of the bath in °C
80 85 90
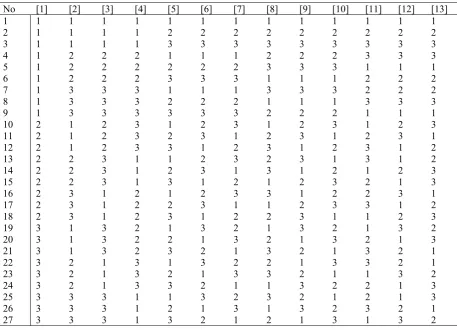
Table 3 L27 Orthogonal Arrays with design factor.
No [1] [2] [3] [4] [5] [6] [7] [8] [9] [10] [11] [12] [13] 1 1 1 1 1 1 1 1 1 1 1 1 1 1 2 1 1 1 1 2 2 2 2 2 2 2 2 2 3 1 1 1 1 3 3 3 3 3 3 3 3 3 4 1 2 2 2 1 1 1 2 2 2 3 3 3 5 1 2 2 2 2 2 2 3 3 3 1 1 1 6 1 2 2 2 3 3 3 1 1 1 2 2 2 7 1 3 3 3 1 1 1 3 3 3 2 2 2 8 1 3 3 3 2 2 2 1 1 1 3 3 3 9 1 3 3 3 3 3 3 2 2 2 1 1 1 10 2 1 2 3 1 2 3 1 2 3 1 2 3 11 2 1 2 3 2 3 1 2 3 1 2 3 1 12 2 1 2 3 3 1 2 3 1 2 3 1 2 13 2 2 3 1 1 2 3 2 3 1 3 1 2 14 2 2 3 1 2 3 1 3 1 2 1 2 3 15 2 2 3 1 3 1 2 1 2 3 2 1 3 16 2 3 1 2 1 2 3 3 1 2 2 3 1 17 2 3 1 2 2 3 1 1 2 3 3 1 2 18 2 3 1 2 3 1 2 2 3 1 1 2 3 19 3 1 3 2 1 3 2 1 3 2 1 3 2 20 3 1 3 2 2 1 3 2 1 3 2 1 3 21 3 1 3 2 3 2 1 3 2 1 3 2 1 22 3 2 1 3 1 3 2 2 1 3 3 2 1 23 3 2 1 3 2 1 3 3 2 1 1 3 2 24 3 2 1 3 3 2 1 1 3 2 2 1 3 25 3 3 3 1 1 3 2 3 2 1 2 1 3 26 3 3 3 1 2 1 3 1 3 2 3 2 1 27 3 3 3 1 3 2 1 2 1 3 1 3 2
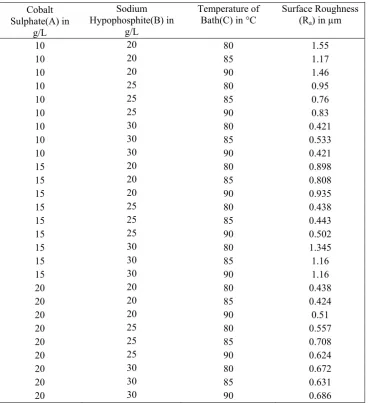
3.4 Determination of Surface Roughness
Table 4 Surface Roughness of each coating
Cobalt Sulphate(A) in
g/L
Sodium Hypophosphite(B) in
g/L
Temperature of
Bath(C) in °C Surface Roughness (Ra) in µm
10 20 80 1.55
10 20 85 1.17
10 20 90 1.46
10 25 80 0.95
10 25 85 0.76
10 25 90 0.83
10 30 80 0.421
10 30 85 0.533
10 30 90 0.421
15 20 80 0.898
15 20 85 0.808
15 20 90 0.935
15 25 80 0.438
15 25 85 0.443
15 25 90 0.502
15 30 80 1.345
15 30 85 1.16
15 30 90 1.16
20 20 80 0.438
20 20 85 0.424
20 20 90 0.51
20 25 80 0.557
20 25 85 0.708
20 25 90 0.624
20 30 80 0.672
20 30 85 0.631
20 30 90 0.686
3.5 Composite study Surface Morphology of the surface of the coating was determined by the SEM analysis. The SEM analysis was done on the SOF software in JEOL-Jsm 7610F machine. XRD analysis was done on the same software on the same machine to determine the phase present in the coating. In order to find the weight percentage of different elements present in the coating EDAX analysis was done. It was done on AZTEC software using OXFORD X-max 50 machine.
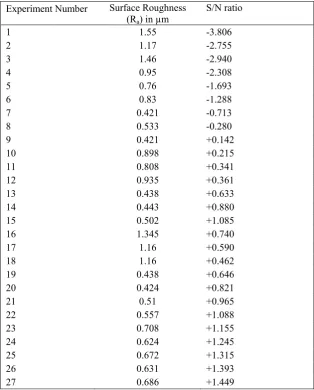
4 Results and Discussions 4.1 Signal to Noise Ratio
Table 5 S/N ratio for each run
Experiment Number Surface Roughness (Ra) in µm
S/N ratio
1 1.55 -3.806
2 1.17 -2.755
3 1.46 -2.940
4 0.95 -2.308
5 0.76 -1.693
6 0.83 -1.288
7 0.421 -0.713
8 0.533 -0.280
9 0.421 +0.142
10 0.898 +0.215
11 0.808 +0.341
12 0.935 +0.361
13 0.438 +0.633
14 0.443 +0.880
15 0.502 +1.085
16 1.345 +0.740
17 1.16 +0.590
18 1.16 +0.462
19 0.438 +0.646
20 0.424 +0.821
21 0.51 +0.965
22 0.557 +1.088
23 0.708 +1.155
24 0.624 +1.245
25 0.672 +1.315
26 0.631 +1.393
27 0.686 +1.449
S/N ratio table The Signal to Noise ratio response table for each level of factors has been shown in table 6. Table 6 Response Table
Level A B C
1. 1.7294 1.6392 -0.2415
2. 2.0129 4.0312 2.0214 3. 4.7688 2.8408 6.7313 Delta 3.0394 2.3920 6.9728
Rank 2 3 1
Figure 1 Main Effect Plot for S/N ratio
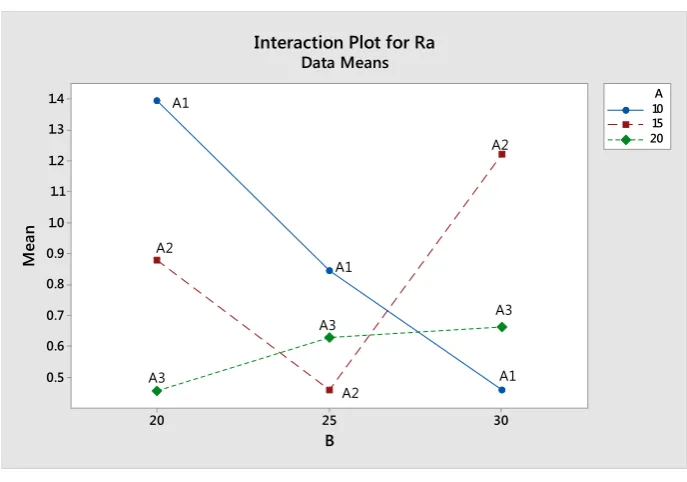
The interaction plot of A and B is shown in figure 2.
Figure 2
20 15
10 7
6
5
4
3
2
1
0
30 25
20 80 85 90
A
M
ea
n of S
N
ra
tios
B C
Main Effects Plot for SN ratios Data Means
Signal-to-noise: Smaller is better
30 25
20 1.4
1.3
1.2
1.1
1.0
0.9
0.8
0.7
0.6
0.5
B
Me
an
10 15 20 A Interaction Plot for Ra
Data Means
A1
A1
A1 A2
A2
A2
A3
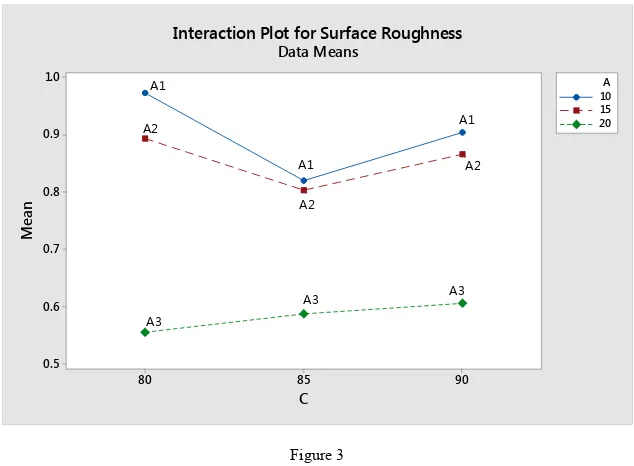
The interaction plot of A and C is shown in figure 3.
Figure 3
The interaction plot of B and C is shown in fig 4.
Figure 4
The mean of S/N ratios, the main effects plot for surface roughness and the interaction of each factor with one another at different levels is shown in the figure 1, figure 2 and figure 3-5 respectively. The interaction plots signify the extent to which the factors have interacted with each other. If the plots remain parallel to each other then it can be interpreted that no significant interactions has taken place between the two factors. If the plots intersect with each other or intercept each other a number of times then it signifies that strong interaction has taken place between the two factors. Figure 4 shows strong interaction between Cobalt Sulphate and Sodium Hypophosphite whereas figure 5 and 6 show moderate interactions between Cobalt Sulphate temperature of bath and Sodium Hypophosphite and Temperature of electroless bath respectively. The optimal minimum surface roughness obtained from this experiment is A3B2C3. The surface roughness for the optimal parameters is 0.624 µm.
4.2 Analysis Of Variance
ANOVA is an important tool to conclude results from the response. It used to find the significant factors and the significant interactions. If the p value for any factor is less than the significant value which is 0.05 then we can reject the 14 null hypothesis and conclude that there is no difference in the populations. A factor having p value less than 0.05 is significant in determining the surface roughness of the coating. The F ratio is the ratio of
90 85 80 1.0 0.9 0.8 0.7 0.6 0.5 C Me an 10 15 20 A
Interaction Plot for Surface Roughness Data Means A1 A2 A3 A2 A1 A1 A2 A3 A3 90 85 80 1.0 0.9 0.8 0.7 0.6 C Me an 20 25 30 B
Interaction Plot for Surface Roughness Data Means B1 1 B 1 B B2 2 B B2 B3 3
regression mean square and mean square error. It is the measure of a factor’s significance. A higher value of F ratio signifies higher significance of the factor.
Table 7 ANOVA Results
Source Degree Of
freedom
Sum of
Squares Mean Square F ratio
p-Value
A 2 0.97050 0.485249 55.44 0.000
B 2 0.83761 0.418805 47.85 0.000
C 2 0.06004 0.030018 3.43 0.084
A*B 4 1.95294 0.488235 55.78 0.000
A*C 4 0.02730 0.006824 0.78 0.569
B*C 4 0.03514 0.008786 1.00 0.459
ERROR 8 0.07002 0.008753
TOTAL 26 2.95107
From table 7, based on p-value and F-ratio, it is inferred that the factors A and B will have good effect on the surface roughness of the coating. The interaction between the factors A and B will have significant impact on the surface roughness of the coatings.
4.3 Microstructural aspect and composition study
The SEM micrographs of the substrate and coating with optimal parameters are shown in figure 6 and 7 respectively.
Figure 6
The image 6 shows the presence of long grains which then gets deposited by globular particles on the surface of the coating. XRD was done to identify the various phases in the coatings in the as-deposited form. The XRD analysis showed that the coating in the as-deposited form was amorphous in nature. The highest peak was observed at 50.6° which was of Co3P. The coating is dense with very low porosity.
Fig. 8 XRD pattern of the as-deposited Ni-Co-P coating.
EDAX analysis is done to calculate the percentage of the elements present in the coating. Fig 9 shows the EDAX analysis of the coating, where Nickel has more weight percentage with respect to others. EDAX analysis shows high percentage of Cobalt was deposited.
Figure 8 EDAX ANALYSIS of Optimized Ni-Co-P coating
10 20 30 40 50 60 70 80 90 100
0 500 1000 1500 2000 2500 3000 3500
Co3P
Intensity
Table 8 shows the percentage distribution of each element in the coating. Table 8 Composition of the coating
Element Weight Percentage
Nickel 63.68 Cobalt 10.03 Phosphorus 8.05 Carbon 15.51 Oxygen 2.73
5 Conclusion
L27 Orthogonal arrays in Taguchi was been successfully applied to the bath parameters to optimise the surface
roughness. The concentration of Cobalt Sulphate and the concentration of the reducing agent Sodium Hypophosphite was been the significant factors in determining the surface roughness of the coating which has been shown by the p-value, calculated from ANOVA. The interaction between the above mentioned factors is important as well for determining the surface roughness. The minimum optimized surface roughness was obtained for A3B2C3 (20 g/L of Cobalt Sulphate, 25 g/L of Sodium Hypophosphite and 90ºC). The surface roughness decreased from 1.33 µm to 0.624 µm which is 47% of the initial roughness, thus improving the surface smoothness by 53%. The XRD results show that the coating is in amorphous state with the presence of Co3P phase. The SEM analysis reveals the globular form of the particles present in the coatings. EDX analysis
indicates that the coating contained just over 8% of Phosphorus and over 10% of Cobalt. Cobalt deposition slows the rate of deposition of Phosphorus.
6 Acknowledgement
We appreciate the help provided by the Metallurgical and Material department of Jadavpur University for providing XRD facilities to us. We also thank Professor Tapendu Mondal for providing us with the required facilities to carry on the SEM and EDAX analysis and Jhumpa De for helping us in the measurement of surface roughness.
References
[1] T.S.N.S. Narayanan, I. Baskaran, K. Krishnakaveni & S. Partjiban, Deposition of electroless Ni–P graded coatings and evaluation of their corrosion resistance, Surface and Coatings Technology, 200:3438-3445, 2006.
[2] M.H. Staia, E. Castillo, E.S. Puchi, B. Lewis & H.E. Hintermann, Wear performance and mechanism of electroless Ni-P coating, Surface and Coatings Technology, 87:598–602, 1996.
[3] P. Sahoo, Wear behaviour of electroless Ni–P coatings and optimization of process parameters using Taguchi method, Materials and Design, 30:1341–1349, 2009.
[4] P. Gadhari & P. Sahoo. Effect of process parameters on microhardness of Ni‒P‒Al2O3 composite coatings, Procedia Materials Science, 6:623–632, 2014.
[5] M. Ebrahimian-hosseinabadi, K. Azari-dorcheh & S.M.M. Vaghefi, Wear behavior of electroless Ni–P–B4C composite coatings, Wear, 260:123–127, 2006.
[6] N.J. Balaraju, S.M. Jahan, C. Anandan & K.S. Rajam, Studies on electroless Ni–W–P and Ni–W–Cu–P alloy coatings using chloride-based bath, Surface and Coatings Technology, 200: 4885–4890, 2006.
[7] M. Palaniappa & S.K. Seshadri. Friction and wear behavior of electroless Ni–P and Ni–W–P alloy coatings, Wear, 265:735–740, 2008. [8] S. Karthikeyan & L. Vijayaraghavan. Influence of Nano Al2O3 Particles on the Adhesion, Hardness and Wear Resistance of
Electroless NiP Coatings, International Journal of Materials, Mechanics and Manufacturing, 4:106–110, 2016.
[9] Y. Huang, K. Shi, Z. Liao, Y. Wang, L. Wang & F. Zhu, Studies of electroless Ni–Co–P ternary alloy on glass fibers, Materials Letters, 61:1742–1746, 2007.
[10] Y.W. Song, D.Y. Shan & E.H. Han, Comparative study on corrosion protection properties of electroless Ni-P-ZrO2 and Ni-P coatings on AZ91D magnesium alloy, Materials and Corrosion, 58(7):506–510, 2007.
[11] Sh. Alirezai, S.M. Monirvaghefi, M. Salehi & A. Saatchi, Effect of Alumina content on surface morphology and hardness of Ni-P-Al2O3 electroless composite coatings, Surface and Coatings Technology, 184(2-3):170-175, 2004.
[12] L.F. Guleryuz, S. Ozan, D. Uzunsoy & R. Ipek, AN INVESTIGATION OF THE MICROSTRUCTURE AND MECHANICAL PROPERTIES OF B4C REINFORCED PM MAGNESIUM MATRIX COMPOSITES, Powder Metallurgy and Metal Ceramics. 51(7-8): 456–462, 2012.
[13] T.S.N.S. Narayanan, K. Krishnaveni & S.K. Seshadri, Electroless Ni–P/Ni–B duplex coatings: preparation and evaluation of microhardness, wear and corrosion resistance, Materials Chemistry and Physics, 82:771–779, 2003.
[14] B.S. Choudhury, R.S. Sen, B. Oraon & G. Majumdar, Statistical study of nickel and phosphorus contents in electroless Ni–P coatings, Surface Engineering, 25:410-414, 2009.
[15] Y. Gao, L. Huang, Z.J. Zheng, H. Li & M. Zhu, The influence of cobalt on the corrosion resistance and electromagnetic shielding of electroless Ni–Co–P deposits on Al substrate, Applied Surface Science, 253:9470–9475 , 2007.
[16] A.A. Aal, A. Shaaban & Z.A. Hamid, Nanocrystalline soft ferromagnetic Ni–Co–P thin film on Al alloy by low temperature electroless deposition, Applied Surface Science, 254:1966–1971, 2008.
[17] T.S.N.S. Narayanan, S. Selvakumar & A. Stephen, Electroless Ni–Co–P ternary alloy deposits : preparation and characteristics, Surface and Coatings Technology, 172:298- 307, 2003.
[18] Z. Aixiang, X. Weihao & X. Jian, Electroless Ni–Co–P coating of cenospheres using [Ag(NH3)2]+ activator, Materials Letters, 59:524–
528, 2005.
[20] S. Karagiannis, P. Stavropoulos, C. Ziogas & J. Kechagias , Prediction of surface roughness magnitude in computer numerical controlled and milling processes using neural networks by considering a set of influence parameters: An aluminium alloy 5083 case study, Journal of ENGINEERING MANUFACTURE, 228(2):233-244, 2014.
[21] R. Elansezhian, B. Ramamoorthy & P.K. Nair, Surface & Coatings Technology Effect of surfactants on the mechanical properties of electroless (Ni–P) coating, Surface and Coatings Technology, 203:709–712, 2008.
[22] D.K. Basavaraja, M.G. Skanda, C. Soumya, & V. Ramesh, Experimental Investigation on the Effects of Electroless Nickel Phosphorus Deposition , pH and Temperature with the Varying Coating Bath Parameters on Impact Energy by Taguchi Method, International Journal of Industrial and Manufacturing Engineering, 6:698–704, 2017.
[23] R. Jeyapaul, P. Shahabudeen & K. Krishnaiah, Quality management research by considering multi-response problems in the Taguchi method–a review, The International Journal of Advanced Manufacturing Technology, 26:1331– 1337, 2005.
[24] A Singh, S Datta, S Sankar, T Singha & G Majumdar, Optimization of bead geometry of submerged arc weld using fuzzy based desirability function approach, Journal of Intelligent Manufacturing, 24: 35–44, 2013.