OUTLIER DETECTION FOR DYNAMIC
DATA STREAMS USING WEIGHTED
K-MEANS
DEEVI RADHA RANI
Department of CSE, K L University, Vaddeswaram, Guntur, Andhra Pradesh, India.
NAVYA DHULIPALA
Department of CSE, K L University, Vaddeswaram, Guntur, Andhra Pradesh, India.
TEJASWI PINNIBOYINA
Department of CSE, K L University, Vaddeswaram, Guntur, Andhra Pradesh, India.
PADMINI CHATTU
Department of IT, Vignan University, Vadlamudi, Guntur, Andhra Pradesh, India.
Abstract :
This paper presents a new k-means type clustering algorithm that can calculate weights to the variables. This method is efficient for dynamic data streams in order to overcome the global optimum problems. The variable weights produced by the algorithm measures the importance of variable in clustering and can be used in variable selection in which the data items with similar properties are grouped into clusters, the new approach of applying this weighted k-means on dynamic data streams is carried out in order to have efficient outlier detection within the user specific threshold value.
Keywords: Chunks, Clustering, Data Mining, Dynamic Data Streams.
1. Introduction
Clustering is a process of partitioning a set of data into clusters such that data items in the same cluster are more similar to each other and dissimilar data items in different cluster. Similarity is measured by using different statistical measures. In k-means clustering the data items are grouped together by predetermining the k value, so if the k-value is taken as very high there may be inconsistency in data and if the value is too low some useful data may be missing and these methods is efficient for smaller datasets.
platform (or window) dynamically such data streams have features like huge or infinite volume of data, many number of scans, demanding fast (often real time) response time. As the input is dynamic data stream and data is taken with respect to time and the random samples are selected by using sampling algorithm.
By applying k-means the sample clusters are formed and then by re-assigning weights to variables in the data items then new clusters are formed, even though we may have some data points which have dissimilar properties called outliers which are treated as noisy or irrelevant data to that phase only, since it is dynamic data, these outliers are compared with the newly arrived data items in the next phase again the iteration is carried out. The outliers present in the previous phase may become as inliers in the i+1 phase this process is carried out until the user specified threshold value is reached. Most of the outlier detection techniques are efficient for small datasets but not for the numerical and categorical values of the large dataset. To overcome the above problem we use different clustering algorithms.
Using Gower’s similarity coefficient [Gower, (1971)] and other dissimilarity measures [Gowda and Diday, (1991)] the standard hierarchical clustering methods can handle data with numeric and categorical values [Anderberg, (1973); Jain and Dubes, (1988)] [13]. The k-means type clustering algorithm cannot select variables automatically because they treat all variables equally in clustering process. The k-means type clustering process minimizes the cost function.
The variable weights produced by W-k-means [4] measure the importance of variables in clustering. The small weights assigned to the variables reduce or eliminate the effect of insignificant (or noisy) data. These weights can be used in variable selection in data mining applications where large and complex data sets are often involved.
2. Related Work
Desarbo el.at [12] introduced the method for variable weighting in k-means clustering using SYNCLUS algorithm. The SYNCLUS is the first clustering algorithm that uses weights for both variable groups and individual variables in the clustering process.
The SYNCLUS clustering process is divided into two stages. Starting from an initial set of variable weights, SYNCLUS first uses the k-means clustering process to partition data into k clusters. It then estimates a new set of optimal weights by optimizing a weighted mean-square, stress-like cost function. The two stages iterate until the clustering process converges to an optimal set of variable weights. The weakness of SYNCLUS is time consuming computationally.
De Soete [3] proposed a method to find optimal variable weights for ultra metric and additive tree fitting. This method was used in the hierarchical clustering methods to solve the variable weighting problem. Since the hierarchical clustering methods are computationally complex, De Soete’s method cannot handle large data sets.
Makarenkov and Legendre [3] extended De Soete’s method to find optimal variable weighting for the k-means clustering. The basic idea is to assign each variable a weight wi in calculating the distance between two objects and find the optimal weights by optimizing the cost function.
Friedman and Meulman [5] recently published a method to cluster objects on subsets of attributes. A distance measure is proposed for use in cluster analysis. Using this measure in conjunction with usual distance based clustering algorithms encourages the detection of subgroups of objects that preferentially cluster on subsets of the attribute variables. The relevant attribute subsets for each individual cluster can be different and partially overlap with those of other clusters.
As such, p*L weights are computed in the optimization process, where p is the total number of variables and L is the number of clusters. We may have dissimilar data items and they are treated as outliers in that phase as the data is dynamic, so it may be compared with the other data items with respect to time series and it may treat as inliers in the i+1 phase and the iterations are carried until the user specified threshold limit is reached.
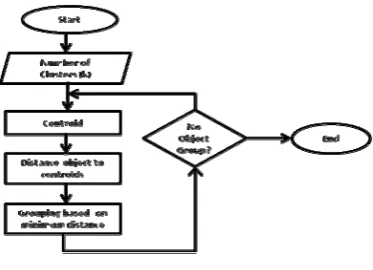
3. The k-means Algorithm
1. Select k points as initial centroids. 2. Repeat
3. Form k clusters by assigning each point to its closest centroid. 4. Recomputed the centroid of each cluster.
5. until centroids do not change.
Fig. 1. k-means process.
The above algorithms have certain drawbacks like:
• K-Means cannot converge to a global optimum. • The initial parameters influence the results of k-means. • K-means type algorithm cannot select variables automatically.
4. The W-k-means Algorithm
In this process we first consider X as a single data set sample that consist of m objects, where X= { } of K clusters. We further classify the r variables for the objects in the cluster.
1. We perform the k-means clustering by considering the initial data point and its nearest center.
S= (1)
Where = Centroid for the ith object. In order to determine the centroid approximately we calculate the membership function M which depends on the value of h that can be either {0 or 1}, where
h =argmin k ( (2)
2. As the data is varying dynamically we are assigning weights to the k-means equation in order to recompute the cluster center.
W(S)= (3)
4. These are grouped together as data chunks and the data irrelevant to that chunk is defined outliers and the number of phases required to perform is determined. The number of phases is assumed to be always less than no of points in the data stream.
Require O: Till how many chunks to test outlier.
Require γ and β: constants that should satisfy the condition: γ+ 4(1+4 (β + γ)) ≤γβ and to make sure that every
phase reads at least one more data point and by c approximation algorithm β≥ 2c (1+ γ )+ γ. The α and β values are taken as constants.
Compute Lj: Each phase has a lower bound value associated with it where = β j.
Compute Fj: Each phase has a facility cost associated with it.
Where = / (k (1+ log n)). In this way the iterations are performed so that outliers are defined efficiently.
5. Experiment and Result Analysis
We perform the experiment on sample data set in order to compute weighted k-means technique for clustering. In this data set we obtain 14 data items that consist of 5 objects and 3 variables ). We first perform the clustering by identifying the initial centroid and its standard deviation. After identifying the final centroid we assign weights to the objective function in order to reduce the optimization problem and remove the noisy data for the dynamic data streams.
For dynamic data set, the variables are assigned after creating the cluster. So we perform the weighted k-means for the newly assigned object until the optimized value is obtained.
In the weighted k-means clustering process, first we assign the initial weights to the variable and then perform the objective function. As the data is dynamic stream, we reassign centroid the number of iterations takes place in order to find the automated variable weights to the samples.
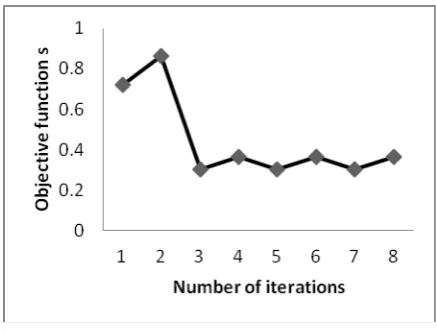
Fig 2 represents the curve for weighted k-means; where the vertical axis (y-axis) represents the objective value and the horizontal axis (x-axis) represent the number of iterations of weights.
Fig 2. Graph representing the iterations for final weight.
dynamic stream and compared until user specified limit is reached and then they are declared as outliers, so that the useful information cannot be missing.
Table 1. Comparing the results before and after assigning weights
Num No Weights Fixed Weights
1 0.7225 0.3032
2 0.8649 0.3630
3 0.6241 0.2621
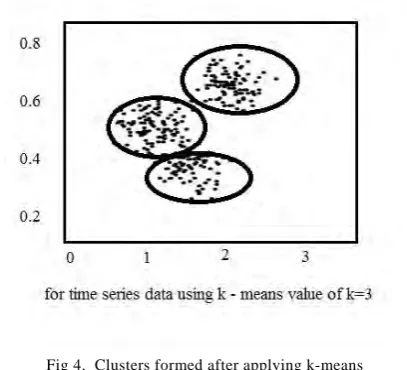
In this process Fig 3, represents the minimized value for the sample data by comparing the data set with fixed weights and without weights for dynamic data streams with respective to time.
Fig 3. Graph representing the minimized value obtained by considering no weights and fixed weights.
In this with respective to time, the samples are taken and by applying k-means since the value of k is taken as 3 the clusters are formed and it is not efficient for huge data set as the data is portioned and by applying weights, the clusters are formed by reassigning the weights and the outliers are identified since the data is dynamic.
.
Fig 4. Clusters formed after applying k-means
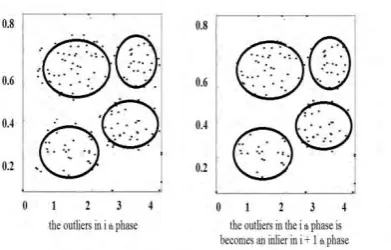
Fig 5. Clusters formed after applying weights with outliers
The outliers in the ith phase is compared with the newly arriving data and it becomes as inliers in the i+1 phase so that the useful information cannot be missing and it iterated until user specified threshold value is reached.
Fig 6. Clusters formed after applying weights with outliers in ith phase and i+1 phase.
In this way the dynamic data stream can be minimised by applying weighted k-means.
6. Conclusion
In this paper, we are assigning weights to the variables by using weighted k-means for the dynamic data streams. The k-means process cannot select the variables automatically for clustering and it is not efficient for large data sets, weights are assigned to the variables even though we have some outliers. So the clustering process is again recomputed with the newly arriving data that becomes as inliers so that useful information may not be loosed and it is carried out until the user specified threshold values is reached. The experiment results shows that weighted k-means is more efficient for detecting outliers.
Acknowledgements
We like to express our gratitude to all those who gave us the possibility to carry out the paper. We would like to thank Mr.K.Satyanarayana, chancellor of K.L.University, Dr.K.Raja Sekhara Rao, Dean, and K.L.University for stimulating suggestions and encouragement. We have further more to thank
Prof.S.Venkateswarlu, Dr.K.Subrahmanyam, Dr.G.Rama Krishna, who encouraged going ahead with
References
[1] Carlos Ordonez,” Clustering Binary Data Streams with K means”, ACM, June 13, 2003, San Diego, CA, USA.
[2] Charu C. Aggarwal, Philip S. Yu, “Outlier Detection for High Dimensional Data”, Proc. of the 2001 ACM SIGMOD int. conf.
on Management of data, May 2001, pp 37-46, Santa Barbara, California, United states.
[3] G. De Soete, “OVWTRE: A Program for Optimal Variable Weighting for Ultra metric and Additive Tree Fitting,” J.
Classification, vol. 5, 1988, pp 101-104.
[4] Joshua Zhexue Huang, Michael K. Ng, Hongqiang Rong, and Zichen Li, “Automated Variable Weighting in k-Means Type
Clustering”, IEEE Transactions on Pattern Analysis and Machine Intelligence, vol 27, May 2005, pp 657-668.
[5] J.H. Friedman and J.J. Meulman, “Clustering Objects on Subsets of Attributes,” J. Royal Statistical Soc. B., 2002.
[6] Kittisak Kerdprasop, Nittaya Kerdprasop, and PairoteSattayatham, ”Weighted K-Means for Density-Biased Clustering”,
Springer-Verlag Berlin Heidelberg, pp. 488-497, 2005.
[7] Knorr, E. M., Ng, R.T. “Algorithms for Mining Distance-Based Outliers in Large Datasets”, Proc. 24th VLDB, 1998.
[8] M. H. Marghny, Ahmed I. Taloba, “Outlier Detection using Improved Genetic K-means”, International Journal of Computer
Applications, Volume 28– No.11, August 2011
[9] Manzoor Elahi, Kun Li , Wasif Nisar, Xinjie Lv ,Hongan Wang , “Efficient Clustering-Based Outlier Detection Algorithm for
Dynamic Data Stream”, In Proc. Of the Fifth International Conference on Fuzzy Systems and Knowledge Discovery (FSKD.2008).
[10] R. Gnanadesikan, J. Kettenring, and S. Tsao, “Weighting and Selection of Variables for Cluster Analysis,” J. Classification,
vol. 12, 1995 pp. 113-136.
[11] S. Selim and M. Ismail, “K-Means-Type Algorithms: A Generalized Convergence Theorem and Characterization of Local
Optimality,” IEEE Trans. Pattern Analysis and Machine Intelligence, vol. 6, no. 1, 1984, pp. 81-87.
[12] W.S. Desarbo, J.D. Carroll, L.A. Clark, and P.E. Green, “Synthesized Clustering: A Method for Amalgamating Clustering
Bases with Differential Weighting Variables,” Psychometrika, vol. 49, 1984, pp. 57-78.
[13] Zhexue Huang, “Extensions to the k-Means Algorithm for Clustering Large Data Sets with Categorical Values”, Kluwer