Lincoln
University
Digital
Thesis
Copyright
Statement
The
digital
copy
of
this
thesis
is
protected
by
the
Copyright
Act
1994
(New
Zealand).
This
thesis
may
be
consulted
by
you,
provided
you
comply
with
the
provisions
of
the
Act
and
the
following
conditions
of
use:
you
will
use
the
copy
only
for
the
purposes
of
research
or
private
study
you
will
recognise
the
author's
right
to
be
identified
as
the
author
of
the
thesis
and
due
acknowledgement
will
be
made
to
the
author
where
appropriate
you
will
obtain
the
author's
permission
before
publishing
any
material
from
the
thesis.
An analysis of home ranges, movements, foods, and breeding of
kereru (Hemiphaga novaeseelandiae) in a rural-urban landscape
on Banks Peninsula, New Zealand
A thesis
submitted in partial fulfilment
of the requirements for the Degree of
Master of Science
at
Lincoln University
By
H. Maaike Schotborgh
Lincoln University
\" 2005
._.~.; ... .; ~ .. ~--. :::~;::>;:.:.::~~
Frontispiece
Abstract
Aspects of kereru (Hemiphaga novaeseelandiae) ecology were studied on Banks Peninsula, New Zealand, from February 2004 until March 2005 (13 months). Telemetry equipment was used to locate 15 radio-tagged kereru. Characteristic of the human-modified landscape where this study took place is a mosaic of farmland, peri-urban areas, townships, native forest patches, and conifer plantations. Main study sites were at Church Bay and Orton Bradley Park.
This study is part of the Kaupapa Kereru Programme which aims to enhance the kereru population on Banks Peninsula, and also contributes to national efforts to enhance kereru populations in human-modified landscapes. Before this study, little was known of kereru ecology in landscapes such as on Banks Peninsula.
The breeding season extended from,mid-July 2004 to at least March 2005. Sixty-seven percent of tagged kereru bred and seven chicks fledged from 20 nesting attempts (35% success rate). Breeding success was higher compared with kereru populations on mainland New Zealand, but not as successful as a relatively predator-free population or for populations in areas where predators were controlled. Kereru nested in native forest patches and in areas frequently occupied by humans.
Home ranges, estimated using cluster analysis, were significantly smaller during the breeding season than during the non-breeding season. Home ranges (1.8-22.2 ha) and core areas (0.01-0.28 ha) were significantly smaller than those found in the Whirinaki Forest Park (13.9-704.2 ha, and 1.1-26.7 ha respectively). Home range overlap was less at Orton Bradley Park than at Church Bay. Home range overlap was generally less during the breeding season than during the non-breeding season at both study sites. During the non-breeding season, six of 10 kereru moved away from Orton Bradley Park for about two months perhaps as a result of insufficient food. Daily movements were mostly less than 500 m at both study sites. Presence of kereru was regulated by food availability, except during the breeding season when kereru also required suitable nesting sites.
The Church Bay and Orton Bradley Park study sites appeared to contain all required resources as home ranges were within these sites. However, more predation events occurred at Orton Bradley Park reducing its quality.
Increased food availability across Banks Peninsula should allow kereru to colonise new areas. Additional (native) fruiting food species should improve carrying capacity of areas, diet choice of kereru, and indirectly improve species composition in forest patches through improved seed dispersal by kereru. Seed dispersal of native plant species occurred only during mid to late summer, and mostly within 500 m from foraging locations.
Acknowledgements
This thesis was sponsored with assistance and funding from the Kaupapa Kereru Programme, a collaborative effort between Ngai Tahu, Lincoln University, the Department of Conservation, and Landcare Research.
To my parents who suggested I travel to New Zealand to trace the footsteps of Tante Bolletje and Oom Walter!
I would like to take the opportunity to acknowledge and thank Kerry-Jayne Wilson and Shaun Ogilvie for introducing me to the Kaupapa Kereru Programme, getting me involved in such an interesting and applied study, and being my supervisors. I am grateful to the Kaupapa Kereru Programme's Committee which I enjoyed working with. Terry Greene; thank you for being my external supervisor, your help catching and tagging kereru, answering my questions, and reviewing my drafts. Peter Dilks, thank you for your help catching kereru. Ralph Powlesland; thank you for providing me with your knowledge and instructions for leg jesses and harnesses. Les Moran; thank you for giving me instructions on building mist net rigs and the type of mist nets to use. Lewis Jennings and Alistair Galbraith; thank you for making the mist net rig and fixing my gear as quickly as you did - it made the walk in the bush a lot easier. Leeston Saddlery; thank you for making the leg jesses.
I would like to thank the Orton Bradley Park Board, and Bruce Farmer, for allowing us to radio tag kereru in the Park and have access to the Park during my study.
A special thanks to the community of Banks Peninsula which allowed me to access their properties to wander after the tagged kereru. This study could not have been so detailed without such access, and I truly enjoyed tramping around such beautiful places! Special thanks to residents in the Diamond Harbour and Charteris Bay areas. I would like to thank farm owners in Kaituna Valley, Puaha, Port Levy, and Purau Bay for allowing me to access their property and exchanging stories about kereru.
A tremendous thank-you to people I worked with who made my time spent on this study more than worth while:
Te Ari Prendergast; It was good to have you come out to check your artificial nests and cameras in the same area as I was tracking my kereru. Always good to learn about native trees, to adjust 22's and 28's cameras on the 7-m stick which were too short!
Headmaster Leon Fife, Director of Kereru Intelligence in Church Bay, I was lucky enough to have an extra hand in the field and working with you taught me how to think for two, txt, and that you were a pretty tough guy in all kinds of weather!
- Alison Lister; I really appreciate your help smoothing out parameters, indexing Jacob, counting foods and kereru numbers.
- Brad Case; thank you for your advice on Arc GIS and answering my questions.
- Andy South; thank you for your advice on how to use certain applications in Ranges 6.
Tbesepeople, among others, have supported me throughout and I would like to thank you:
- Mum & Dad, WoutR & Kelly, Annemiek, Leontien, Kees & Inez & Co; All comes to a good ending regardless of the bumps on the way. I'm very thankful you were there supporting me throughout. Dankje weI!
- Pammetje and Walt; it all unfolds as it should, it has been an interesting ride in the mean time: I'm loving it and I'm learning how to write my pages!
- Kirke; It is truly good to have a mentor - It's like enchiladas!
- Gerard & Els; thank for the beautiful gift you gave me! Good spirits.
- Rachel and Khiry; Evolution made the kereru, God crafted European settlers who destroy native
forests, and if the two would not have come together on Banks Peninsula we would not have met. A good friend for 3 years now. Thanks for all your (knee) support and listening to all my stories!
- Walter & Ann for giving me my degree in my pigeon hole before I even started; it's hanging on my wooden wall. Jan & Bill; it's always good to talk to you about what I've been up to and if the kereru already laid eggs yet. ..
- Tasl? & Martijn and Ann & Mike - it feels really good to have a Kiwi family to fall back on! - Mandy; positive and determined and therefore good support. She'll be right!
- Beol-crew: Te Ari, Ruth, Kirsten, Ben, Jo, Jenny, Nicola, Shona, Dale, and Brendan. Its good to feel respected while being Dutch and doing my own thing, bake pizzas and watch PumpJ am vids while talking to the kitty. Ruth and Chris, thanks for looking over my drafts!
- Sofia, Lizzie, Annie; cookies or any food would do actually!
- Farm Road kids, especially flat 5: Da Crew (I love you guys for who you are ... buttah ... did you .... )
ABSTRACT ... III
ACKNOWLEDGEMENTS ... V
LIST OF TABLES ... XII
LIST OF FIGURES ... XIII
CHAPTER 1 INTRODUCTION ... 1
1.1 THESIS JUSTIFICATION AND KNOWLEDGE GAP ... 1
1.2 AIM AND OBJECTIVES ... 2
1.3 SUMMARY OF PRESENT KNOWLEDGE ... 3
1.3.1 Status ... 3
1.3.2 Diet ... 3
1.3.3 Home ranges and movements ... 4
1.3.4 Aspects of breeding ecology .. : ... ... 5
1.3.5 Kereru: seed dispersers of native tree species ... 5
1.4 OUTLINE OF TillS THESIS ... 6
CHAPTER 2 CAPTURE AND RADIO-TAGGING OF KERERU (HEMIPHAGA NOVAESEELANDIAE) ... 7
2.1 INTRODUCTION ... 7
2.2 CAPTUREPROCEDURE ... 7
2.2.1 Permits ... 7
2.2.2 Constructing mist net rigs ... 7
2.2.3 Capture sites ... 8
2.2.4 Removal of kereru from the mist nets ... 9
2.2.5 Measurements ... 9
2.2.6 Attachment of radio transmitters, aluminium bands, and coloured leg jesse(s) .. 10
2.2.7 DNA samples ... ... 12
2.2.8 Radio tracking methodology and data collection ... 13
2.2.9 Pilot study ... 13
2.2.9.1 Autocorrelation ... 14
2.2.9.2 Time for independent sampling ... 14
CHAPTER 3 DESCRIPTION OF STUDY SITES ... 16
3.1 BANKS PENINSULA: GEOGRAPHY AND HISTORY ... 16
3.2 STUDY SITES ... 17
3.2.1 Methodology ... ... 17
3.2.2 Results ... 17
3.2.2.1 Study site: Church Bay ... 17
3.2.2.2 Orton Bradley Park ... 19
3.2.2.3 Mount Herbert Reserve, Kaituna Valley ... 20
3.2.2.4 Whites Road, Puaha (near Little River) ... 21
3.2.2.5 Port Levy ... 22
CHAPTER 4 TIMING OF THE REPRODUCTIVE CYCLE OF KERERU (HEMIPHAGA NOVAESEELANDIAE) IN THE LYTTELTON HARBOUR BASIN, BANKS PENINSULA ... 23
4.1 INTRODUCTION ... : ... 23
4.2 METHODOLOGY ... ; ... 24
4.2.1 Timing of the reproductive cycle ... 24
4.2.2 Breeding pairs and nesting attempts ... ... 24
4.2.3 Nest height and tree species preference ... 25
4.2.4 Nest sites and areas of human occupancy ... ... 25
4.3 RESULTS ... 25
4.3.1 Timing of the reproductive cycle ... 26
4.3.2 Breeding pairs and timing of nesting attempts ... 26
4.3.3 Nest height and tree species used for nest building ... ... 28
4.3.4 Nest sites and areas of human occupancy ... ... 28
4.4 DISCUSSION ... 30
CHAPTER 5 FOODS EATEN BY KERERU (HEMIPHAGA NOVAESEELANDIAE) IN THE LYTTELTON HARBOUR BASIN, BANKS PENINSULA ..•... 33
5.1 INTRODUCTION ... 33
5.2 METHODOLOGY ... 34
5.2.1 Number of kereru available for observation .... ... 35
5.2.2 Food species eaten ... ... 35
5.2.4 Food types eaten ... 36
5.2.5 Importance offood species eaten at different study sites ... 36
5.3 RESULTS ... 37
5.3.1 Number of kereru available for observation .. ... 37
5.3.2 Food species eaten ... ... 37
5.3.3 Relative importance offood species ... 39
5.3.4 Food types eaten ... 40
5.3.4.1 Crop content of a dead kereru ... 40
5.3.5 Importance offood species eaten at different study sites ... 41
5.4 DISCUSSION ... 43
5.4.1 Key results regarding the list offood species ... 43
5.4.2 Key results regarding the reproductive cycle ... 45
CHAPTER 6 HOME RANGE AND MOVEMENT ANALYSIS OF KERERU (HEMIPHAGANOVAESEELANDIAE) IN THE LYTTELTON HARBOUR BASIN, BANKS PENINSULA ... 48
6.1 INTRODUCTION ... 48
6.2 METHODOLOGy ... 49
6.2.1 Home range and core area estimation ... 49
6.2.1.1 Minimum convex polygon method ... 50
6.2.1.2 Cluster analysis ... 51
6.2.1.3 Reliability of estimated MCP areas and home range sizes ... 51
6.2.2 Correlation between home ranges and core areas (cluster analysis) ... 52
6.2.3 Seasonal differences in home range size ... 53
6.2.4 Home range overlap between seasons ... 53
6.2.5 Travel distance and timing of movement ... ... 53
6.2.6 Use of areas within study sites ... 54
6.3 RESULTS ... 54
6.3.1 Home range and core area estimation ... 54
6.3.2 Correlation between home ranges and core areas (cluster analysis) ... 56
6.3.3 Seasonal difference in home range sizes ... 56
6.3.4 Home range overlap between seasons ... 56
6.3.5 Travel distance and timing of movements ... ' ... 57
6.4 DISCUSSION ... 60
6.4.1 Home ranges and core areas ... ... 60
6.4.3 Difference in home ranges between the non-breeding and breeding seasons ... 62
6.4.4 Home ranges overlap between seasons ... 63
6.4.5 Travel distances and timing of movements ... ... 63
6.4.6 Importance of landscape features over time ... 65
CHAPTER 7 A POPULATION ESTIMATE FOR KERERU (HEMIPHAGA NOVAESEELANDIAE) AT CHURCH BAY AND ORTON BRADLEY PARK IN THE LYTTELTON HARBOUR BASIN, BANKS PENINSULA ... 67
7.1 INTRODUCTION ... 67
7.2 METHODOLOGy ... ; ... 68
7.2.1 Estimation of the kereru population ... 68
7.2.2 Mortality records ... : ... 69
7.3 RESULTS ... 69
7.3.1 Estimation of the number of kereru ... 69
7.3.2 Mortality records ... ... 70
7.4 DISCUSSION ... 71
CHAPTER 8 GENERAL DISCUSSION ... 73
8.1 How DOES THIS STUDY FIT INTO THE LONG-TERM VISION OF THE KAUPAPA KERERU PROGRAMME AND NATIONAL RESEARCH ON KERERU ECOLOGy? ... 73
8.2 QUALITY OF STUDY SITES FOR KERERU ... 73
8.3 How CAN THE KERERU POPULATION BE INCREASED ON BANKS PENINSULA? ... 7 5 8.4 How WELL DOES THE CURRENT POPULATION DISPERSE SEEDS? ... 75
8.5 WHAT IS ESSENTIAL TO ALLOW KERERU TO EXPAND THEIR RANGE ON BANKS PENINSULA? ... 77
8.6 KEy RESULTS FOR KERERU MANAGEMENT ON BANKS PENINSULA ... 77
8.7 MANAGEMENT RECOMMENDATIONS ... 79
8.8 STRENGTHS AND WEAKNESSES OF THIS STUDy ... 80
8.9 ENTHUSIASM OF THE COMMUNITy ... 81
8.10 FuTURE RESEARCH ... : ... 81
REFEREN CES ... 85
Appendix 1. Appendix 2. Appendix 3. Appendix 4. Appendix 5.
Appendix 6.
Appendix 7. Appendix 8.
Appendix 9.
Appendix 10.
Capture information, measurements, and sex of the radio-tagged kereru .... 89 Detailed description of study site vegetation types ... 90 Data sheet used for data collection in this study ... 96 List of plant species ... 97 Relative importance of food species as calculated for Church Bay and Orton Bradley Park. Proportions of =0.4 (considered relatively more used) are highlighted ... 98 Home range and core area estimated using cluster analysis and MCP
method ... 99 Home range overlap ... : ... 100 The number of data points at which the area-location curves showed
stability for the Minimum Convex Polygon (MCP) method and cluster
analysis ... 101 Percentages of location data used to define the home ranges and core areas.
List of Tables
Table 4.1. Sex of kereru breeding in Church Bay and Orton Bradley Park ... 25 Table 4.2. Recorded of kereru nests at Church Bay and Orton Bradley Park with the fate and
the stage of failure of each nest ... 27 Table 4.3. Nest sites, vegetation types, and origin of tree species used for nesting ... 28 . Table 4.4. Summary of fledge rates of three studies conducted on reproductive success of
kereru, including the present study ... 31 Table 4.5. Summary of predation rates of three studies conducted on reproductive success of
kereru, including the present study ... 32 Table 5.1a. Proportion of kereru feeding on each food species. Proportions of =0.4
(considered relatively more used) are highlighted ... 39 Table 5.1b. Proportion of feeding observations on each food species. Proportions of =0.4
(considered relatively more used) are highlighted ... 40 Table 5.2. The number of native and intro~uced food species eaten at the study sites Church
Bay, Orton Bradley Park, Puaha, and Port Levy ... .42 Table 6.1. Estimates of the home ranges and core areas using MCP and cluster analysis ... 55 Table 6.2. Percentage of MCP area that is included in the home range (estimated using cluster
analysis) ... 55 Table 6.3. Breeding and non-breeding season home range estimated for breeding kereru ... 57 Table 6.4. Proportions of home range overlap of kereru in Church Bay and Orton Bradley
Park during the non-breeding and the breeding seasons ... 58 Table 6.5. Proportion in each distance category of distances travelled by kereru during the
non-breeding and the breeding seasons ... 59 Table 7.1. Estimation of kereru numbers at Church Bay and Orton Bradley Park during
List of Figures
Figure 2.1. Design of the mist net construction. Not drawn to scale ... 8
Figure 2.2. Banks Peninsula with the location of the catch sites in Church Bay and Orton Bradley Park (Programme, 2005) ... 9
Figure 2.3. A) At a catch site in Orton Bradley Park, the mist net was placed between conifer trees used for roosting and poroporo bushes used for foraging at the time; B) handling was a two-person effort where one held the kereru while the other attached the backpack-like transmitter to the bird ... 10
Figure 2.4. A) top view of radio transmitter with the label and antenna; B) side view of radio transmitter as it was attached to kereru, including the design of the nylon cord with the weak link emergency release mechanism. Not drawn to scale ... 12
Figure 2.5. View of jess with slits. When attached to the bird's leg it protruded about 4 cm like a flag. Not drawn to scale ... 12
Figure 3.1. Banks Peninsula with the location of the study sites Church Bay, Orton Bradley Park, Mount Herbert Reserve, Port Levy, and Puaha. Map source: Oral History Project, Kaupapa Kereru Programme, 2005 ... 18
Figure 3.2. The Church Bay study site with the vegetation types ... 19
Figure 3.3. Orton Bradley Park with the borders of the vegetation types within the study site (only patches of vegetation used by tagged kereru is shown on the right-hand side of the figure) ... 21
Figure 4.1. Timing of the reproductive cycle as recorded for kereru' on Banks Peninsula ... 26
Figure 4.2. The kereru recorded nesting with the number and timing of nesting attempts for each pair ... 27
Figure 4.3. Maps of A) Church Bay and B) Orton Bradley Park showing locations of nests and areas occupied by humans ... 29
Figure 5.1. The number of kereru available for behavioural observation and the number of kereru observed eating each week. ... 37
Figure 5.2. The food species eaten by kereru each week, during the study period from February 2004 to March 2005 ... 38
Figure 5.3. Proportion of native versus introduced species eaten by kereru ... 38
Figure 5.4. The food species and parts eaten by kereru over time ... 41
Figure 5.5. Summary of the food types eaten over time ... ~ ... .41
Figure 6.1. Utilisation plot used to determine the percentage of data included in the core area estimation of the cluster analysis ... 52 Figure 6.2. The number oflong-distance movements (>1.5 kIn between two consecutive
locations) made by each kereru ... 59 Figure 6.3. Areas used by at least one kereru during the study period, with the percentage of
location data in check category and the number of kereru which used each
Chapter 1
Introduction
1.1 Thesis justification and knowledge gap
Populations of the endemic kereru or New Zealand pIgeon (Hemiphaga
novaeseelandiae) have declined drastically throughout New Zealand since the start of European settlement. Over the last two centuries, settlers have destroyed large tracts of native forest habitat and hunted kereru extensively (Clout, 1988; Wilson, 1998). Kereru populations were further reduced through predation of adult kereru and nests and competition for food by introduced mammals such as brush-tailed possums (Trichosorus vulpecula), rats (Rattus spp.) and stoats (Mustela erminea) (Clout, 1988; Pierce, 1993; Clout et al., 1995; Pierce & Graham, 1995; Mander et al.;J998).
On Banks Peninsula, European settlers deforested 700,000 ha of native forest in less than a century and, by 1920, only 800 ha of old-growth forest remained (Wilson, 1998). Since then, native forest started to regenerate in pockets and at the end of the 20th century the total area of regenerated, native forest patches and other areas with native vegetation was approximately 28,000 ha (Wilson, 1998). The current rural-urban landscape on Banks Peninsula, similar to rural-urban landscapes elsewhere in New Zealand, is characterised by a mosaic of farmland, peri-urban areas, townships, regenerating native forest patches and conifer plantations. The native remnant and regenerating forest fragments range in size from a few hectares to about 1000 ha.
Consequently, little is known of kereru ecology in highly fragmented, human-modified landscapes (Clout et aI., 1995; Mander et al., 1998); no information was available on the
home ranges, or daily distances travelled, reproductive success, timing of the breeding cycle, or population size. The apparent abundance of kereru on Banks Peninsula suggests these birds have adapted to modifications of the landscape in the last two centuries.
Kereru remain culturally important to New Zealanders (Clout et al., 1995; Wright et al.,
1995; Young, 1995; Higgins & Davies, 1996). On Banks Peninsula, kereru are culturally important to Te Runanga 0 Ngai Tahu and the local community. In 2000, the Banks Peninsula
Runanga approached the Department of Conservation to assess the status of the kereru population on Banks Peninsula; the collaborative Kaupapa Kereru Programme (KKP) was initiated by Te Runanga 0 Ngai Tahu in collaboration with the Department of Conservation,
Landcare Research and Lincoln University. The aims of KKP are to increase kereru numbers on Banks Peninsula by: 1) enhancing the landscape for kereru, 2) sustaining andlor improving the seed dispersing role of kereru, 3) working within a timeframe of 5 to 10 years so that changes in the kereru population can be detected, 4) promoting the KKP within the community, and 5) focussing on peri-urban areas so the community can experience the results ofKKP.
There is a national demand for know ledge on how kereru utilise resources available to them in a human-modified landscape with a high deciduous component (Mander et al., 1998;
Wilson, 1998). This study, initiated by the Kaupapa Kereru Programme, provides essential information on aspects of kereru ecology specifically for the Banks Peninsula population, supplements national research efforts on kereru ecology, and provides management advice for kereru populations in rural-urban landscape such as on Banks Peninsula.
1.2 Aim and objectives
The objectives as identified for this study were to:
1. Determine annual and seasonal home ranges and movement patterns of individual kereru, and identify changes between seasons for the study population.
2. Describe seasonal changes in the use of food species and food type.
3. Describe the timing of the reproductive cycle for kereru on Banks Peninsula. 4. Determine seasonal changes in the use of study sites.
5. Describe the proximity of nest sites to areas frequently used by humans. 6. Estimate the population baseline for population trend monitoring.
1.3 Summary of present knowledge
1.3.1 Status
Kereru inhabit lowland native forests throughout New Zealand (Higgins & Davies, 1996). The species is currently listed as 'endangered bird species in gradual decline' (Hitchmough,2002).
1.3.2 Diet
Kereru are generalist feeders and traditional in their use of food sources (Beveridge, 1964; McEwan, 1978; Clout, 1990; Pierce & Graham, 1995; Mander et at., 1998; Ridley,
1998). Kereru diet consists of a combination of plant parts (i.e., leaves, flowers, buds, young shoots, and fruits) from different plants, to a single plant part from one individual plant, depending on the seasonal availability (Beveridge, 1964; Clout et at., 1986; Clout & Hay, 1989; Clout et at., 1991; Clout & Tilley, 1992; Mander et at., 1998; Ridley, 1998). They
consume whole podocarp seeds plus the fibrous parts of fruits of tree species such as kahikatea (Dacrycarpus dacrydioides) , matai (Podocarpus spicatus) , miro (Podocarpus ferrugineus), and tawa (Beilschmiedia tawa) (Beveridge, 1964). Studies suggest kereru switch
to flowers, buds, and fruit when these become available, possibly due to -their higher nutrient content.
1984). Kereru are attracted to suburban gardens by exotic specIes such as tree lucerne
(Chamaecytisus palmensis) , guava (Psidium cattleyanum), plum trees (Prunus spp.), and other fruiting trees (McEwan, 1978). Numerous records are available of kereru feeding on fruit from plum and cherry trees (Prunus spp.), and leaves from apple trees (Malus spp.) (Dawson, 1950; Taylor, 1950; Gibb, 1970). Kereru browsing on foliage of exotic trees can remove significant amounts of leaves (Clout & Hay, 1989). Exotic conifer plantations are used by kereru only when native forest is adjacent or when certain food types (e.g., of introduced plant species such as Leycesteria formosa and Rubus fructicosus or native species such as Fuchsia excorticata) are available within the plantation (Clout & Gaze, 1984). Kereru, in landscapes without sufficient native food species, might rely on introduced species for survival.
Locations of food sources, whether native or introduced species, directly regulate movements and home ranges (Clout & Gaze, 1984; Clout et al., 1986; Clout et al., 1991; Pierce et al., 1993).
1.3.3 Home ranges and movements
In the past 30 years, radio tracking studies throughout New Zealand, mainly conducted
in landscapes with native forests, suggest kereru occupy home ranges which vary in size according to the location of seasonally available food sources (Clout & Gaze, 1984; Wilson et
al., 1988; Clout, 1990; Pierce & Graham, 1995; Bell, 1996; Mander et al., 1998; Hill, 2003). Home ranges may shift during the year or between seasons, may be as small as 1-2 ha, and may be a circuit of seasonal home ranges spread out over distances of up to 18-20 km (Clout
et aI., 1991; Bell, 1996; Mander et al., 1998). Telemetry studies show kereru are capable of travelling over 100 km in approximately seven weeks (unpublished Kereru News, August
1.3.4 Aspects of breeding ecology
The timing of the reproductive cycle of kereru appears to be strongly related to availability and quality of food (Clout et al., 1995; Pierce & Graham, 1995; Powlesland et al., 2003).
During periods of nutritional stress, breeding attempts might be delayed (e.g., due to poor fruiting seasons of native trees or food competition with possum), or kereru may not attempt to nest at all (Pierce & Graham, 1995). The number of re-nesting attempts is thought to be affected by food availability (Mander 1998).
The onset of the breeding season (or reproductive cycle; display flights, egg-laying, and chick hatching and fledging) is associated with an influx of male kereru performing display flights to defend territories and nest sites, although display flights can be recorded throughout the breeding season (Mander et al., 1998). The timing of the breeding season varies with
latitude: Northland kereru are known to breed year-round with a peak in summer (Pierce &
Graham, 1995); kereru at Pelorus Bridge breed only during the summer months (Clout et al.,
1995). Food quality affects the length of the chick rearing stage and the duration chicks are fed after fledging (Clout et ai., 1995; Mander et ai., 1998).
Kereru lay only one egg for every nesting attempt, but might attempt to nest up to four times in one breeding season when the food supply is plentiful (Clout et al., 1988; Clout et al., 1995; Pierce & Graham, 1995; Mander et al., 1998). Studies show survival of adult kereru
and nests is currently limited mainly by predation (Pierce, 1993; Clout et al., 1995;
Powlesland et al., 2003). Predator control efforts have resulted in an increase in nesting
success on mainland New Zealand (Bums et al., 2000; Powlesland et al., 2003). Graham and
Pierce (1995) and Powlesland et al. (2003) found success rates (i.e., chicks fledging) of
approximately 19 to 25% in areas where predators were not controlled. In areas where predators were controlled and on an off-shore island (i.e., both areas relatively predator-free), the success rates were 75 and 63% respectively (Pierce & Graham, 1995; Powlesland et al.,
2003).
1.3.5 Kereru: seed dispersers of native tree species
kereru, for example: miro, karaka (Corynocarpus laevigatus), kahikatea, puriri (Vitex lucens), tawa, and taraire (B. taraire) (Clout & Hay, 1989; Ridley, 1998). Due to local extinctions of seed dispersing birds such as kokako (Callaeas cinerea) and tui (Prosthemadera
novaeseelandiae) , and total extinction of species such as the piopio (Turnagra capensis) , various native forest ecosystems rely entirely on kereru as seed dispersal vectors (Clout, 1990). Kereru are also the only widespread bird species capable of dispersing the seeds of tree species whose fruits are too large (> 12 mm) for other native birds species to swallow (i.e., tui and bellbird (Anthornis melanura) (Gibb, 1970; Clout & Hay, 1989; Clout, 1990; Mander et al., 1998). In addition, tui and bellbird are primarily nectar feeders, supplementing their diet with invertebrates and fruits.
Little knowledge is available of the extent to which kereru disperse seeds in fragmented landscapes (Mander et al., 1998), seed dispersal distances, which native and introduced species benefit, and if potential weed species are being dispersed (Burrows, 1994a, b). From an ecological viewpoint, maintenance andi or enhancement of kereru populations is necessary to ensure ongoing seed dispersal and to maintain natural regeneration processes of native forests.
1.4 Outline of this thesis
This thesis is written as separate papers. There will inevitably be some overlap between chapters.
Chapter 2
Capture and radio-tagging of kereru
(Hemiphaga novaeseelandiae)
2.1 Introduction
To investigate kereru (Hemiphaga novaeseelandiae) ecology in the rural-urban landscapes on Banks Peninsula, the movement and behaviour of 15 radio-tagged kereru were recorded between February 2004 and March 2005 (13 months). This Chapter outlines the capture and radio-tagging procedures and data collection methodology.
2.2 Capture procedure
2.2.1 Permits
Capture of kereru, collection of feather samples, and radio tagging was conducted with the approval of the Department of Conservation (DOC; Low Impact, Collecting and Research Application Permit, CAI3957FAU, Hitchmough 2002 classifications; www.doc.govt.nz) and the Lincoln University Animal Ethics Committee (permit no. 30). A kereru banding permit was obtained (R. O. Cossee, Manager, New Zealand National Banding Scheme, DOC, Head Office, Wellington) under K-J. Wilson's (Bio-Protection and Ecology Division, Lincoln University) existing permit (no. 0298).
2.2.2 Constructing mist net rigs
The name 'mist net' refers to the fact that the nets become almost invisible to the eye while used against a dark background. Where possible, rigs were placed on opposite sides of a tree or bush utilised by kereru. On several occasions two mist nets of the same size were attached, one beneath the other on one net rig, to create a larger catching surface.
..
,....
.
.~.
•
.
.
.
..
I
6morl2m
BypuUing the rope the net moves
up / dow·n along tile poles
I
Some tension on the rope mounting system and
.lflf",,_
\"
~
Guy linesI
...
Vertical rope
\+ ... --~ mounting
system
+---+ guy lines allows for stability of the construction <t~---+
Figure 2.1. Design of the mist net construction. Not drawn to scale.
2.2.3 Capture sites
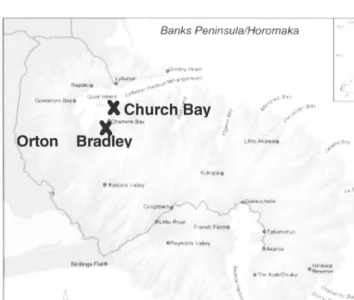
Capture of kereru took place at two sites in Charteris Bay and one site in Church Bay, in the Lyttelton Harbour basin on Banks Peninsula (Figure 2.2). Requirements for capture sites were a tree or bush that: 1) was used by several kereru on a daily basis, 2) was below a height of 7 m, and 3) was located in a site suitable for mist netting (Figure 2.3a). In the weeks before the capture (January 2004), direct observations and information from local residents revealed that several kereru were foraging in fruit trees (mostly plums trees; Prunus spp.) and poroporo bushes (Solanum aviculare and S. laciniatum). Capture sites were located near these food sources. Appendix 1 summarises the capture data. The rural-urban landscape on Banks
. -, \~ i' -:. ~ ,.' •
,
Peninsula, the study sites and the vegetation types at each study site, are described in Chapter
3 and Appendix 2.
Banks PeninsulalHoromaka
J I t.''lrf''ti I. t'· .'
X
Church
~
Bay
Bra~I;~
,
.
...
I"~
•
...
,,, "",
..
.,f " tf\ I
Figure 2.2. Banks Peninsula with the location of the catch sites in Church Bay and Orton
Bradley Park.
2.2.4 Removal of kereru from the mist nets
At least two experienced DOC staff and/or Lincoln University personnel were present at
the capture sites at all times to supervise bird handling. Captured kereru were extracted from
the net as quickly as possible to avoid unnecessary stress; one person extracted a bird from the
net, while another held onto it to prevent the bird flapping its wings and injuring itself. No
captured kereru were harmed during the process. Kereru were placed in a soft, lightweight
cotton bag for transportation to a nearby site where the bird was processed (Figure 2.3b).
2.2.5 Measurements
While in the soft cotton bag, the captured kereru were weighed to the nearest five
the nearest millimetre: length of the bill, longest tail feather, and longest primary wing feather
(O'Donnel & Dilks, 1988) (Appendix 1). Callipers were used to measure the length of the bill
(upper mandible) from the base of the feathers to the tip to the nearest 0.1 mm. A metric ruler
was used to measure the tail and primary feathers to the nearest 1 mm.
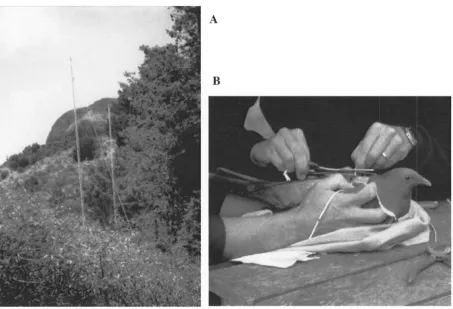
Figure 2.3. A) At a catch site in Orton Bradley Park, the mist net was placed between conifer
trees used for roosting and poroporo bushes used for foraging at the time; B) handling was a
two-person effort where one held the kereru while the other attached the backpack-like
transmitter to the bird.
2.2.6 Attachment of radio transmitters, aluminium bands, and coloured leg Jesser s)
The radio transmitters used were Sirtrack Ltd® transmitters (Private Bag 1403, Goddard
Lane, Havelock North, New Zealand). The transmitter design allowed it to be mounted on the
back of the kereru, held in place with a nylon cord harness with a built-in weak link release
mechanism of biodegradable cotton. This backpack-like design (Karl & Clout, 1987) has been
Each transmitter weighed 18 grams; less than 4% of the bird's body mass (Kenward, 2001; Millspaugh & Marzluff, 2001). The 2/3 AA lithium cell batteries had an estimated average life of 18 months (± 4 months). The transmitters had an antenna of approximately 20 cm to amplify the pulsed signal. Each transmitter was tested before it was attached to the kereru, and the frequency channel and fine tuning recorded (Figure 2.3b; Appendix 1). The transmitters were programmed to deliver pulsed signals on a unique frequency, 40 pulses per minute, for 12 hours per day (the start of the 12 hour interval commenced when the transmitter was turned on manually with a magnet switch at 7 a.m. each capture day; New Zealand summer time). The VHF (very high frequency; 160 mHz) receivers used to receive the signal were a Regal 1000 VHF receiver and a TR-4 receiver (manufactured by Telonics Telemetry-Electronics Consultants (932 E. Impala Ave, Mesa, Arizona 85204-6699, USA)). The transmitted signal was received via handheld, collapsible, three element yagi antennas (Kenward, 2001; Millspaugh & MarzIuff, 2001).
Each capturedkereru was initially banded on one leg with a 'K' size band (Appendix 1). However, as these bands seemed slightly tight around some of the kereru's legs, OS' size bands were used on the remainder of the birds. No specific leg was used to band each kereru but the band was placed on the tarsus (tarso-metatarsus). When the bird was to receive only one leg jess, the band was placed on the same leg as the bird's leg jess (see below).
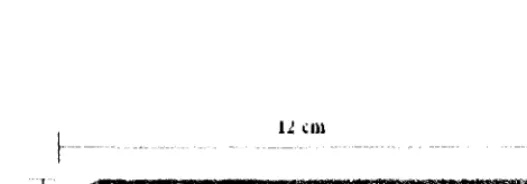
A unique colour combination of one or two coloured jesses (red, blue, yellow, green, and orange) was attached to one or both leges) of each kereru in; only one per leg (Figure 2.5, Appendix 1). When attached around the kereru's leg, the jess protrudes about 4 cm, like a flag. Jesses were made of PVC-coated nylon (2 mm thick x 2 cm x 10 cm). Leg jesses are not known to influence kereru behaviour or mortality rate and have been used in previous studies (Powlesland et aI., 1992).
Lincoln University
A
Ph0332S2811TR4 Ch22
B
Label clarifying the owner, phone number, and the unique frequency of the transmitter
Sleeves through which the harness is attached to Ule transmitter
+----1
Nylon cord harnessI
Weak-link emergency release mechanism
Figure 2.4. A) top view of radio transmitter with the label and antenna; B) side view of radio transmitter as it was attached to kereru, including the design of the nylon cord with the weak link emergency release mechanism. Not drawn to scale.
~-- -\
~1
" ,,- '-' -, " <.. ~.><~. ~~"'~"'tr,-,,"~___ _ · c ,0: ',c.'
_ ~ _ ~ ' . "- ">::> ~_ ~' "" 1 ~ ~~ " \ ~ ~ "
I I
1 ~I
I \
JllIl1 I ~ IIUlI ! ~ 1I~l\ 1 ~ nUll .~(I IIUII
Figure 2.5. View of jess with slits. When attached to the bird's leg it protruded about 4 em like a flag. Not drawn to scale.
2.2.7 DNA samples
About five contour feathers from the breast area were collected from each captured kereru. These samples have been stored for potential DNA extraction.
.•.• " • • • . • ir
,:~:;,;;::.K,~·::
" <- -- -~ ~-,.-:
-. -. ,
2.2.8 Radio tracking methodology and data collection
Telemetry equipment was used to locate the 15 tagged kereru during fortnightly field trips, 4 to 5 days each, from February 2004 to March 2005 (13 months). An attempt was made to locate tagged kereru visually at least once on each field day (White & Garrott, 1990; Kenward, 2001; Millspaugh & Marzluff, 2001). The physical location of tagged kereru in the field and distances between tagged kereru determined which birds were tracked more regularly. Priority was given to collect data from kereru with known locations. A handheld global positioning unit (GPS) was used to record locations as close to any kereru as possible. When it was obvious a kereru was in a defined area but not visible, the location was estimated using triangulation (White & Garrott, 1990; Kenward, 2001; Millspaugh & Marzluff, 2001). Data in each of the following chapters were collected while radio tracking kereru as described in here. See Appendix 3 for the data sheet used.
In addition to the collection of location data for the purpose of home range and movement analysis, records were obtained of behaviour using the following terms:
•
Roost: to perch or settle for sleep•
Fly: to travel through the air•
Feed/ eat: to take food or to swallow food•
Preen: to smooth feathers with bill•
Brooding: to incubate eggs or nestlings•
Twigging: to move small branches for nest making.Records were also obtained of the food species and food types when kereru were feeding. The number of untagged kereru encountered while tracking and observing tagged kereru was recorded to estimate the population (see Chapter 7). Additional data collected during the breeding season included the sex of each breeding kereru, the number of display flights performed by male kereru, the number of nesting attempts for each breeding pair, hatching records, fledging records, and nest fates (see Chapter 4).
2.2.9 Pilot study
independence of location data (e.g., to avoid autocorrelation which is a basic assumption for most home range estimation techniques and statistical analysis) (Kenward, 2001; Millspaugh
& Marzluff, 2001). During the pilot study, the error of location data was also assessed.
2.2.9.1 Autocorrelation
Auto-correlated data sets are created when: 1) the animal has too little time to move between two observations, 2) the animal simply does not move between consecutive observations, or 3) the animal periodically returns to a previously used portion of its range (Millspaugh & Marzluff, 2001). Data collected without autocorrelation should reflect the importance of areas within home ranges. In addition, auto-correlated data generally
underestimates the home range size (Millspaugh & Marzluff, 2001). Location data collected for individual kereru during this study are most likely auto-correlated due to the following biological characteristics of kereru, because they: 1) were observed to remain in the same location for up to 1.5 hours (pers. obs.), and 2) frequently returned to previously used locations within their home range.
2.2.9.2 Time for independent sampling
2.2.9.3 Error
Location data were collected using a GPS whenever tagged kereru were within 10 m of the observer. Whenever the error was 10 m or less, it was ignored. Terrain and weather circumstances limited the accuracy of triangulation when kereru could not be approached. In these situations, the location of tagged kereru was estimated using triangulation.
Chapter 3
Description of study sites
3.1 Banks Peninsula: geography and history
Banks Peninsula was shaped by a history of volcanic eruptions and subsequent erosion (Wilson, 1998). The three main volcanoes (Lyttelton, Herbert, and Akaroa) , although inactive, are still recognisable in the landscape. Characteristic for Banks Peninsula are the numerous harbours and inlets around its perimeter. Before human settlement, the landscape was mostly covered in native forests at lower elevations, and sub-alpine vegetation and scrub in the higher valleys and ridges above 800 m a.s.!. (Wilson, 1998). Maori had cleared one-third of the forest on the Peninsula when the Europeans arrived from 1840 onwards (Wilson,
1998). The Settlers deforested 700,000 ha of the original native forest for farming, in less than a century. They also introduced mammals such as cattle, sheep, goats, and possums to New Zealand which caused damage to forests via browsing. By 1920, only about 800 ha of old-growth forest remained. Clearing of the native forests destroyed habitats suitable for New Zealand's native birds such as kereru (Hemiphaga novaeseelandiae).
Areas with native remnant forest patches that were of no economic use for agriculture (e.g., steep slopes and river beds that were not cleared of native forest) started to regenerate and forest cover increased in size despite browsing of the forest understorey by stock (Wilson, 1998). At the end of the 20th century, the total area of regenerated native forest and other native vegetation was about 28,000 ha (Wilson, 1998). Conifer plantations cover an additional 2,000 ha.
This chapter describes the study sites used by the tagged kereru.
3.2 Study sites
3.2.1 Methodology
Limited information on kereru home ranges and movements in rural-urban landscapes made it difficult to estimate in advance the area over which kereru would move (see Chapter 1). I attempted to estimate the study area using the location data collected of all kereru as described in Chapter 2. This approach would include areas visited by kereru while excluding areas where kereru were not located (i.e., distinguish discrete areas used by kereru).
The term 'vegetation type' was used to distinguish the boundary of three-dimensional compositions of plant species. At least one tagged kereru had to use all or part of each vegetation type for it to be included in this study. The location data were plotted onto an aerial photograph of Banks Peninsula (obtained from the Department of Conservation, Christchurch) using ArcGIS (ESRI, 2004); topographic map references 260-M36, M37, N36, N37, 1985; 1980). Contour lines were drawn around each vegetation type and borders were distinguished using the aerial photograph and field observations. When vegetation types were geographically adjacent, they were grouped to form study sites.
3.2.2 Results
Five different study sites were distinguished: Church Bay, Orton Bradley Park, Mount Herbert Reserve, Port Levy, and Puaha (Figure 3.1). A description of each study site follows below. A description of vegetation types at study sites Church Bay and Orton Bradley Park is presented in Appendix 2.
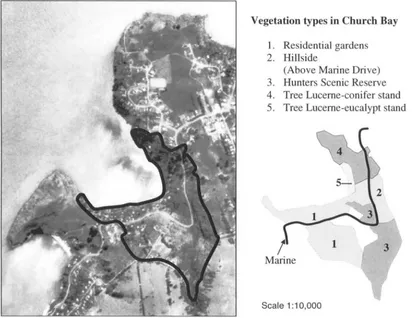
3.2.2.1 Study site: Church Bay
Five vegetation types were distinguished at Church Bay (430
37' S - 1720
Diamond Harbour area on the south side of Lyttelton Harbour Basin, Banks Peninsula (Figure
3.1 and 3.2). The Bay's aspect is north-northwest with land outcrops outward to sea on either
side. The distance between the outcrops is approximately 500 m. For about 650 m, the Church
Gully Stream flows from the upper margins of the study site (150 m a.s.l.) along the centre of
the Bay to the beach. Relatively steep slopes in places (i.e., cliffs and rock faces) make access
difficult in the higher areas. Towards the beach, accessibility improves (e.g., residential area).
Marine Drive follows the contour of the Bay at about 50 m above sea level. Power and
telephone lines and poles are present along the road and between residences.
Approximately half of the area consists of residential houses with gardens. These
residential gardens contain native and introduced plant species, with only small
«
0.5 ha)areas with pasture. The eastern side contains a conifer-eucalypt block (Appendix 2). The
remaining middle-part of the Bay is the Hunter Scenic Reserve, which was planted with
native trees around 1970 (K-J. Wilson, pers. comm.). Public access in the Church Gully
Stream area is limited (Appendix 2).
Banks PeninsulalHoromaka
.;., .... ..,.(, .,·1
'!Jo' ."'1
X
Church
"
Bay
;..
ltil &I ,s;
Orton
Bradle
Park
X
X
Port
Lew
"mM.Mount
Herbe
'
rt
Reser
~ ItIt t
...
• .,h"m
• '. II 0" u
Figure 3.1. Banks Peninsula with the location of the study sites Church Bay, Orton Bradley
Park, Mount Herbert Reserve, Port Levy, and Puaha. Map source: Oral History Project,
Vegetation types in Church Bay
1. Residential gardens 2. Hillside
(Above Marine Drive)
3. Hunters Scenic Reserve 4. Tree Lucerne-conifer stand
5. Tree Lucerne-eucalypt stand
Marine
Scale 1:10,000
Figure 3.2. The Church Bay study site with the vegetation types.
3.2.2.2 Orton Bradley Park
Orton Bradley Park is located in Charteris Bay (430
39' S - 1720
43' E), on the south
side of Lyttelton Harbour, Banks Peninsula (Figure 3.1 and 3.3), and contains 12 vegetation
types used by tagged kereru (Appendix 2). The Park is within the catchment of the Te Wharau
Stream and has relatively flat areas closer to the coast on the northern side, with rolling and
steep hillsides towards Mount Herbert (919 m a.s.l.) and Mount Bradley (855 m a.s.l.) where
the Park's boundaries end. The distance from the coastal area to the Park's southern
boundaries on the mountain ridge is approximately five km; the width is approximately two
km. The total surface area is approximately 640 ha (Wilson, 1992). In 1981, the Park became
protected (Wilson, 1992). The Park is open to the public and facilities available are walkways,
horse tracks, and recreational areas (i.e., camp, picnic, and play sites). During lambing season
and periods with high fIre risk, public access is limited.
The vegetation in the Park consists of open pasture, exotic conifer and hardwood
and mixed hardwood canopies, scattered plants on rock outcrops, and small areas of second-growth hardwoods regenerating through bracken (Wilson, 1992). The conifer plantations are present along the eastern side bordered by pasture as well as stands of regenerating native vegetation (Figure 3.3). Native scrub and forest are found in locations with limited access or low intensity of farming activities: stream beds, steep and inaccessible hillsides and in and amongst growths of introduced scrub and tree species. The Park contains a group of historic buildings, the manager's house and garden, and farm buildings (i.e., woolshed, and garage; Figure 3.3). From the entrance of the Park, a one km public access road runs past the historic and farming buildings, to give access to recreational areas. Where the Park borders Charteris Bay Road, residential gardens with native and introduced plant species are present (see Appendix 2).
3.2.2.3 Mount Herbert Reserve; Kaituna Valley
The Mount Herbert Reserve (240 ha; 43° 70' S - 172° 75' E) (Figure 3.1) is one of the few patches of original forest which has not been burned since European settlement. It has been grazed periodically by stock in the last 120 years but was reserved in 1915 (Kelly, 1972; Wilson, 1992). Most of the native forest vegetation is re-growth, except on the steep sites. The broadleaved mixture of the upper bush is similar throughout (i.e., broadleaf being dominant), but with characteristic species increasing at the wet (i.e., pate (Schefflera digitata), fuchsia (Fuchsia excorticata)) and dry ends (i.e., akiraho (Olearia paniculata), red matipo
(Myrsine australis)) (Kelly, 1972). In areas above 500 m, Hall's totara (Podocarpus totara) is abundant and locally dominant. In the lower areas, matai (Podocarpus spicatus), totara, and in some areas kahikatea (Podocarpus (Dacrycarpus) dacrydioides), are characteristic. Mahoe
:....
\~: :
.
~...
..
... .• ' 3b \
.'
.'
"
.
.
'oad
. . ,
d \
••••••••••••••••• Walkway
.~ Scale 1 :15,000
Vegetation types in Orton Bradley Park:
1 a-c Poroporo - Conifer
2 Tree lucerne - eucalypt
3a-d Native and introduced tree stands 4a-b Residential gardens
Figure 3.3. Orton Bradley Park with the borders of the vegetation types within the study site
(only patches of vegetation used by tagged kereru are shown on the right-hand side of the
figure).
3.2.2.4 Whites Road, Puaha (near Little River)
The Hikuika Stream runs along Whites Road in Puaha, near Little River (430
74' S
-1720
83' E) (Figure 3.1). The Stream has a zone (10 to 30 m) with scrub and trees on either
about 200 m. Tree species growing here are tree lucerne (Chamaecytisus palmensis), willow
(Salix spp.), kamahi (Weimannia racemosa), kowhai (Sophora microphylla), conifer species
(Pinus spp.l Macrocarpa spp.), and kanuka (Kunzea ericoides). Maximum height of the trees is about 15 m. Presence of stock resulted in little re-growth and open grassy areas. This study site is on private land.
3.2.2.5 Port Levy
Along Wharf Road is a block of farmland (about 6 ha of pasture) (430
66' S - 1720
Chapter 4
Timing of the reproductive cycle of kereru
(Hemiphaga novaeseelandiae)
in
the Lyttelton Harbour Basin, Banks Peninsula
4.1 Introduction
The onset of breeding in kereru starts with male kereru (Hemiphaga novaeseelandiae)
performing display flights about a month before egg-laying (Mander et al., 1998). The timing
of the breeding season is related to adequate food availability (Clout et al., 1995; Mander et al., 1998). Incubation time is 28 to 30 days (Mander et al., 1998). During the egg-phase, male
kereru incubate from mid . morning. until late afternoon; the female takes over from late afternoon until mid morning. Chicks are brooded for the first days after hatching and then left unattended while being fed up. to three times a day by both parents until fledging. Food quality and quantity affects the length of the chick rearing stage which was previously recorded to be four to seven weeks (Clout et al., 1995; Mander et al., 1998). Chicks fledge
when weighing approximately 400 g, and are fed for at least a week after fledging, mostly by the male parent (Mander et al., 1998).
The timing of the reproductive cycle of kereru in the rural-urban landscape on Banks Peninsula was assessed to compare it with the timing of the reproductive cycle elsewhere in New Zealand, to supplement current knowledge, and to help determine the importance of food species and food types eaten before and during the breeding season (see Chapter 5). The timing of the breeding season was also used to analyse differences in home ranges and movements of kereru between the non-breeding and breeding seasons (see Chapter 6).
4.2 Methodology
Kereru were radio tracked as described in Chapter 2 and data regarding the reproductive cycle were collected while tracking (i.e., number of display flights performed by make kereru, start of egg-laying, chick hatching and fledging, and nest fate). When a breeding pair laid an egg, or when a chick was present in a nest, it was regarded as a nesting attempt.
The identical plumage and similar behaviour of male and female kereru outside the breeding season made it difficult to sex birds before the breeding season (Mander et al.,
1998). The sex of tagged kereru was determined by records of display flights performed by male kereru and the incubation roster of male/female kereru (Mander et al., 1998).
4.2.1 Timing a/the reproductive cycle
The non-breeding season was from the start of this study until male kereru began performing display flights. The start of the reproductive cycle for the 2004-2005 breeding season was defined as the period when male kereru first performed display flights, until the end of the final nesting attempts (see section 4.2.2). The date at which eggs were laid and chicks hatched and fledged, were recorded whenever possible.
4.2.2 Breeding pairs and nesting attempts
4.2.3 Nest height and tree species preference
To analyse the height range at which kereru nested and tree species used, the number of nesting attempts in each vegetation type (see Chapter 3) was recorded, as well as the tree species' origin (i.e., native or introduced) in which each nest was built, and the nests' approximate height above the ground.
4.2.4 Nest sites and areas of human occupancy
Disturbance of nesting sites by humans during the early stages of the reproductive cycle was thought to cause nest abandonment (Mander et ai., 1998). The distance of nesting sites to
the following categories of areas with human activity, was measured: 1) walkway, 2) recreational area, 3) road, 4) beach front, and 5) residential garden. ArcGIS 9.0 was used to create a map representing the nest sites and areas of human occupancy.
4.3 Results
Two tagged male and two tagged female kereru bred at Church Bay. At Orton Bradley Park, three tagged males and three tagged females bred (see Table 4.1). At each study site, one of the breeding pairs had both the male and female tagged (kereru 18 and 38 at Church Bay; kereru 20 and 30 at Orton Bradley Park) while the remaining tagged kereru paired up with untagged kereru.
Table 4.1. Sex of kereru breeding in Church Bay and Orton Bradley Park
Study site where kereru Kereru Sex was breeding no. {male I female}
10 m
Church Bay 18 m
36 f
38 f
20 f
22 f
Orton Bradley Park 24 f
28 m
30 m
4.3.1 Timing of the reproductive cycle
The timing of the reproductive cycle is summarised in Figure 4.1. The breeding season (or reproductive cycle) began in mid July 2004 and continued until at least the end of March 2005. The peak: of male kereru performing display flights was in the first month of the breeding season in July and August, before the first nesting attempts were recorded. Males continued to perform display flights throughout the breeding season. At least one breeding pair attempted to nest in each field week from early September onwards. Chicks began hatching and fledging in October and November. The reproductive cycle was still underway in the final field week in March with at least one kereru incubating.
Breeding cycle of tagged kereru on Banks Peninsula
Months Julyl Aug I Sept I Oct I Nov I Dec I Jan I Feb I Mar Display flights I
Nesting attempts I
Chicks hatching I I
Chicks fledged I I I I I I
,
Figure 4.1. Timing of the reproductive cycle as recorded for kereru on Banks Peninsula.
4.3.2 Breeding pairs and timing of nesting attempts
Ten out of fifteen (67 %) kereru were observed frequently enough to confirm breeding, forming eight breeding pairs; the remaining kereru were not observed regularly enough to determine if they bred. Of two breeding pairs, both female and male kereru were radio-tagged (kereru 18-38 and 20-30); of six other pairs, either the male or female was radio-tagged (Table 4.1, Figure 4.2). All known pairs re-nested (except one female (kereru 22) that died due to predation; Figure 4.2) and a total of 20 nesting attempts was recorded (average of 2.5 nests for each pair).
Of all 20 nesting attempts, seven fledged chicks (35% success rate). The other nesting attempts failed either at egg stage (12) or chick stage (1) due to abandonment, predation, or the egg falling through the nest (T.A. Prendergast, pers. comm.). These nest failures caused a gap in the period during which chicks were hatching, from mid-February onwards, and in the period chicks were fledging in parts of December, February, and from March onwards (T.A. Prendergast, pers. comm.) (Figure 4.2 and Table 4.2).
"
-'-'---:-'-;
, ' . - ' "
!: .. ,-~--,~
2004 I 2005
Kereru Sept I Oct 1 Nov I Dec I Jan I Feb I Mar
no. Nesting attempt no.
Church 10 I 1 I 2
J
I 3 I18 + 38 1 I 2 I 3 I I 4 I
Bay
36 1 I 2 I
20 + 30 1 I I 2 I 3 I I 4 I
Orton 22
I
18I
Bradley 24 I I 2 I
Park 28
I
1I
32 I 1 I I 2 I
a: Breeding female was preyed upon while brooding a 1 O-day old chick which terminated the nesting attempt.
b: Kereru continued to incubate beyond final field day.
2b
I
Figure 4.2. The kereru recorded nesting with the number and timing of nesting attempts for each pair.
Table 4.2. Records ofkereru nestS' at Church Bay and Orton Bradley Park with the fate and the stage of failure of each nest
Tagged kereru Nesting
Nest fate Stage at which
no. + sex attempt no. nest failed
1 Preyed on Egg
10m 2 Abandoned Egg
3 Chick fledged N/A
Church 1 Egg fell through nest Egg
Bay 18/38 m/f 2 Egg fell through nest Egg
3 Preyed on Egg
4 Chick fledged N/A
36 f 1 Unknown Egg
2 Chick fledged N/A
1 Preyed on Egg
20/30 m/f 2 Preyed on Egg
3 Abandoned Egg
4 Abandoned EgQ
Orton 22 f 1 Preyed on Chick
Bradley
24 f 1 Chick fledged N/A
Park 2 Chick fledQed N/A
28m 1 Abandoned Egg
2 underway (eQQ stage) N/A
32m 1 Chick fledged N/A
2 Chick fledged N/A
'-'
...
-..•. , ...:~~;;.~:~.;.~~:~~
4.3.3 Nest height and tree species usedfor nest building
Of 20 nesting attempts, 13 nests were built in native trees and seven in introduced tree species (Table 4.3). Nine nests were built in native vegetation types, and 11 nests were built in vegetation types with introduced species but four of these 11 were in native trees (Table 4.3).
Nest heights varied between 2-15 m with a mean of 7.4 m; mean nest height was 6.2 m in Church Bay and 9.4 m in Orton Bradley Park. The lowest nest was in native tree species (2 m) and highest were two nests in introduced tree species (15 m).
Table 4.3. Nest sites, vegetation types, and origin of tree species used for nesting.
Vegetation types* used for nest No. of nesting Nest heisht (m.) in the tree s~ecies
buildins at each stud~ site attem~ts Native Introduced Church Bay*
Hunter Native Reserve (Scenic Reserve) 5 10,10,4,4,2
Tree lucerne - eucalypt stand 2 10,15
Residential gardens 1 5
Tree lucerne - conifer stand 1 5
Orton Bradley Park*
Te Wharau Stream (play/ campgrounds) 4 5 8,15,8 Regenerating natives (kowhai stand) 4 8,4,10,10
Andersons' Road park 2 7,4
Tree lucerne -eucaly~t block 1 3
Total no. of nests 20 13 7
*: see Chapter 3 for a desctiption of the study sites and vegetation types
4.3.4 Nest sites and areas of human occupancy