MINIMIZATION OF CORD WASTAGES
IN BELT INDUSTRY USING DMAIC
SHAILESH N. KHEKALE1, A. S. CHATPALLIWAR2, Dr. NILESHSINGH V. THAKUR3 1
PG Student, 1,2Department of Industrial Engineering, 3Department of Computer Science and Engineering, Shri Ramdeobaba Kamla Nehru Engineering College, Nagpur, India.
1
[email protected], 2[email protected], 3[email protected]
Abstract:
Manufacturing processes tend to produce operational wastages due to various reasons, which can be reduced by identifying and eliminating those using Six Sigma methodologies. In the presented work, DMAIC (Define, Measure, Analyze, Improve and Control) has been used to reduce cord wastages in belt manufacturing. Core issues, pain areas or processes related to cord wastages are identified to formulate the problem. Later the concerned data is collected to examine the current performance and process capability; also the root causes are identified. Solutions are found out from improvement point of view, and various tools are properly implemented for tracking the processes. This study reports reduction in cord wastages in belt manufacturing through reduction in DPMO (Defects per Million Opportunities) from 549531 to 17240, also the Sigma Level is improved from 1.37 to 3.6.
Keywords: Six Sigma; Belt Industry; Cord Wastages.
1. Introduction
Waste minimization plays very important role in manufacturing industry. In today’s competitive scenario price, services, promptness, performance of the product are major factors. Waste affects price of the product and decreases the profit level of the company or industry. Therefore process industries always try to reduce operational wastages. Any process does not produce pure final product, there are always some unwanted by-products which add cost to the final product and do not add value to the final product, these are called as operational wastages. To tackle this problem Six Sigma is very useful methodology. Six Sigma is statistical business improvement approach deals with finding and eliminating defects and their causes in every business operation and focusing the goal most important to costumers. Six Sigma is a high-performance, data-driven approach to analyze the root causes of business problems and solving them [1]. From the statistical point of view, the term Six Sigma is defined as having less than 3.4 DPMO or a success rate of 99.9997 % where Sigma is a term used to represent the variation about the process average [3]. In the business world, Six Sigma is defined as a business strategy used to improve business profitability, to improve the effectiveness and efficiency of all operations to meet or exceed customer’s needs and expectations [2]. In Six Sigma approach there are two tools namely: DMAIC and DFSS. The overall approach to solve problem by using DMAIC methodology which includes conversion of practical problem in to statistical problem and finding statistical solution, these statistical solutions are converted into practical solutions and are implemented properly in the organizations [6]. The company involved in this study is Belt Manufacturing Industry. It is one of leading industry in the Vidarbha region in central India. It produces world class automotive belts and Hoses. In this study different tools of Six Sigma have been used with objective to reduce operational wastages. The paper is organized as follows: Section 2 discusses the problem definition and the methodology. Complete implementation is elaborated in the section 3. Finally the results and discussion is presented in section 4 followed by the references.
2. Problem Definition and Methodology
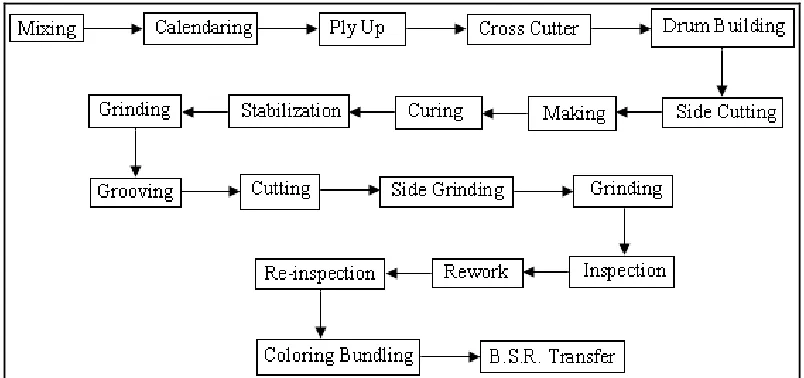
cutting operation. After cutting operation, number of belts obtained is less as per required number of belts. This develops shorter profit of margin. In this study, stress is given only on cord wastages.
3. Six Sigma DMAIC Methodology
DMAIC is a closed-loop process that eliminates unproductive steps, often focuses on new measurements, and applied technology for continuous improvement [3]. Implementation of DMAIC Methodology took place in five phases as outlined earlier and established at Motorola. Problem identification and definition takes place in define phase. After identifying main processes, their performance is calculated in measure phase with the help of data collection. Root causes of the problem are found out in analysis phase. Solutions to solve problem and implementing them are in improve phase. Improvement is maintained in control phase.
3.1.Define Phase
This phase determines the objective and scope of the study. Information about the present processes is collected, determination of customers and deliverables to customers are also determined.
3.1.1. Project Charter, Project Plan and Process Flow Map
The Project Charter defines the scope, objectives, deliverables and overall approach for the work to be completed. It is a critical element for initiating, planning, executing, controlling, and monitoring the study. It is the absolute master document for the study and as such it should be the single point of reference on the study for goals and objectives, scope, organization, estimates, deliverables, and budget [7]. Table 1 shows the details of project title, business case, problem statement, in scope, out scope, expected customer benefit.
Table 1: Scope, Objectives and Deliverables for Belt Industry
Project Title Reduction of operational wastages of belt ( fabric, cord, In process wastages)
Business Case Due to excess wastages production cost increases, reduces the profit margin.
Problem Statement Cord wastage in belt manufacturing from period April 2009 to June 2009, Cord wastages = 2.1% (Avg.) In Scope Cord wastages: Drum Building
Out Scope All other manufacturing process Expected Customer Benefit Reduction in manufacturing cost.
3.1.2. SIPOC
SIPOC is a way to record key process information at a high-level using a structured method. A SIPOC diagram is a tool often used by teams to identify the key elements of a process improvement project before work begins. The tool name prompts you to capture the Suppliers (the 'S' in SIPOC) of your process, the Inputs (the 'I') to the process, the Process (the 'P') you are improving/capturing, the Outputs (the 'O') of the process, and the Customers (the 'C') that receive the process outputs [8]. The purpose of a SIPOC Diagram is to define and document the Suppliers, Inputs/Requirements, Key Process Steps, Outputs/Requirements, Customers, and Critical-to-Quality elements of a business process. It also gives a high level understanding of the process, the process steps (sub processes) and their correlation to each other [3]. Table 2 describes the transformation process of inputs from suppliers to output. To understand the problem clearly and to identify all the relevant elements of this study, SIPOC diagram was used. For Belt Manufacturing, different suppliers i.e. Planning- department, stores, HR etc. supply inputs, e.g. planning sheet, raw material to the process which gives output such as Belt of definite specification to the B.S.R. and end customer.
Table 2: SIPOC of Belt Manufacturing
Supplier Input Process Output Customer
Planning Planning sheet Belt Manufacturing
BELT of define specification
End Customer
Stores Bias fabric Production Yield
Reports
B.S.R.
HR Man power Test Report -
R & D specification Fabric & Cord wastage report
- Engineering Spares for machine In process
wastage report
-
Purchase Cord - -
After focusing on the operations in Belt manufacturing unit, drum building is found as pain area where cord wastage was occurred. After finding the pain area, we found critical factors responsible for wastages. Critical to quality (CTQ) of the cord wastage and critical factors are summarized in Table 3.
Table 3: CTQ Specification Table
CTQ Operation Definition Driver Defect Definition Cord wastage (Wt. of cord
wastage/wt. of total cord issued ) × 100
Drum building Wt. of wastage cord
3.2.Measure Phase
This phase presents the detailed process mapping, operational definition, data collection chart, evaluation of the existing system, assessment of the current level of process performance etc. [4]. In the measure phase, performance of process in pain areas is determined and operations data was collected.
To collect the data, plan for data collection was prepared and the data was collected for cord wastage for the period August 2009 to November 2009 which is given in Table 4.
Table 4: Month-wise Data of Cord Wastage
Month May
2009
June 2009
July 2009
August 2009
September 2009
October 2009
November 2009 Cord Wastage
(%) kg
1.7 1.6 1.9 1.88 1.94 1.81 1.79
3.2.1. Normality Test
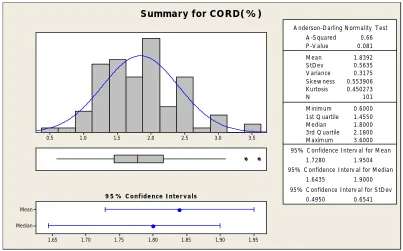
(Figure 2) is used to determine the normality of cord wastage data. It is found that data of cord wastage was normal as p value for the data is greater than 0.05.
3.5 3.0 2.5 2.0 1.5 1.0 0.5 Median Mean 1.95 1.90 1.85 1.80 1.75 1.70 1.65
A nderson-D arling N ormality T est
V ariance 0.3175 S kew ness 0.553906 K urtosis 0.450273
N 101
M inimum 0.6000
A -S quared
1st Q uartile 1.4550
M edian 1.8000
3rd Q uartile 2.1800
M aximum 3.6000
95% C onfidence Interv al for M ean 1.7280
0.66
1.9504 95% C onfidence Interv al for M edian
1.6435 1.9000
95% C onfidence Interv al for S tD ev
0.4950 0.6541
P -V alue 0.081
M ean 1.8392
S tD ev 0.5635
9 5 % C onfidence Inter v als
Summary for CORD(%)
Figure 2: Normality Test of Cord Wastage before DMAIC Methodology
3.2.2. Process Capability Test
After the normality test, performance of the drum building process is calculated with respect to cord wastage by taking the help of process capability test (Figure 3). DPMO is calculated by process capability test as 549531. From this DPMO value, Sigma level was found as 1.37.
3 . 5 3 . 0
2 . 5 2 . 0
1 . 5 1 . 0
0 . 5
L S L T a r g e t U S L
P ro ce s s D a ta
S a m p le N 1 0 1
S tD e v (O v e ra ll) 0 . 5 6 4 8 9
LS L 0 . 7
T a rg e t 1 . 2
U S L 1 . 8
S a m p le M e a n 1 . 8 3 9 2 1
O v e ra ll C a p a b ility
C p m 0 . 2 0
P p 0 . 3 2
P P L 0 . 6 7 P P U -0 . 0 2 P p k -0 . 0 2
O b s e rv e d P e rfo rm a n ce P P M < LS L 9 9 0 0 . 9 9 P P M > U S L 4 8 5 1 4 8 . 5 1 P P M T o ta l 4 9 5 0 4 9 . 5 0
E xp . O v e ra ll P e rfo rm a n ce P P M < LS L 2 1 8 6 3 . 9 7 P P M > U S L 5 2 7 6 6 7 . 5 9 P P M T o ta l 5 4 9 5 3 1 . 5 6
P R O C E S S C A P A B I L I T Y O F C O R D W A S T A G E
Figure 3: Process Capability Test of Cord Wastage before DMAIC Methodology
3.3.Analyze Phase
3.3.1. Cause and Effect Diagram
A cause and effect diagram (Figure 4) for cord wastage presents a chain of causes & effects, sorts out causes & organizes relationship between variables.
Figure 4: Cause and Effect Diagram of Cord Wastage
The relationship between CTQ and root causes is represented by Y = f (X1, X2, X3, …, Xn), Where, Y = CTQ, &
X1, X2, X3,…,Xn = Potential root causes Cord Wastage (Y)
Y= f(x)
X1 = Condition of cord bobbin X2 = Tension setting in Drum Building X3 = Synchronization of drum and cord speed X4 = Condition of cord laying pulleys X5 = Use of left over bobbins
Following Pareto chart (Y-axis- cord wastage) illustrates above reason and also shows their influence on the cord wastages. Tension setting in drum building, synchronization of drum cord speed, and use of left over bobbins played important roles in cord wastages. The Pareto chart (Figure 5) is prepared to prioritize defects and to find out probable causes. Specific data collected was analyzed to prioritize root causes and the same was validated by using statistical techniques. After analyzing the data, it is found out that tension setting in drum building and left over cord were the major causes for high cord wastage.
3.4.Improve Phase
The Improve phase is the fourth step in DMAIC improvement cycle and its aim is to find and implement measures that would solve the problem. Proposed solutions to the cord wastages are given in Table 5.
Table 5: Proposed Solutions for Cord Wastages
CTQ Cause Validated Proposed Solutions Cord
wastage
Tension setting in Drum Building.
Proper maintenance of Tension unit.
Proper training should be given to operator for specification about different weights. Monitoring operator wise shift wise and machine wise shout be carried out.
Left over cord Consume Left over cord in rubber sleeves as well as for small drums. Condition of cord
bobbin
Highlight poor winding on bobbins or poor bobbin conditions to supplier. For that proper instructions must be given to operators to carry out quality checking of cord bobbins before use.
Synchronization of drum and cord speed.
Proper training and instruction must be given to operators for using specified speed of drum and cord pulley.
Regular maintenance of unit should be carried out. Condition of cord
lying pulley
Regular cleaning of pulley track.
Regular maintenance of pulley to avoid play.
After discussing above solutions with the Company’s Manager and Engineers, solutions were categorized according to different criteria. Points were allotted to different criteria according to their impact on the problem. Different Employees gave different points to criteria according to their approach as shown in the Table 6. Points are given so that summation of all the points must be 1.
3.4.1. Solution Prioritization Matrix [9]
It is one of the tools of brainstorming session. For this weight-age criterion for four employees of organization is prepared. The scale is prepared for solution prioritization matrix. The Scale is- 1 – Poor, 2 – Average, 3 – Acceptable, 4 – Good, 5 – Better, 6 – Best, and 7 – Excellent. Scale points given for consume leftover cord is shown in Table 7.
Table 6: Weight-age Criteria Table.7: Scale Points (consume leftover cord)
Criteria Easy Cost effective
Quick Impact on CTQ
Total Employees Easy Cost effective
Quick Impact on CTQ
Manager 0.15 0.35 0.15 0.35 1 Manager 3 4 3 3
Engineer1 0.2 0.25 0.15 0.4 1 Engineer1 2 3 5 2
Engineer2 0.1 0.25 0.35 0.3 1 Engineer2 3 2 4 3
Engineer3 0.3 0.2 0.4 0.1 1 Engineer3 2 3 2 4
Total 0.75 1.05 1.05 1.15 4 Total 10 12 14 12
Average 0.1875 0.2625 0.2625 0.2875 1 Average 2.5 3 3.5 3
As per weight-age criterion Solution Prioritization Matrix is prepared in Table 8. These solutions are rigorously implemented.
Table 8: Solution Prioritization Matrix of Cord Wastages
Solution Easy Cost
effective
Quick Impact on CTQ
Total
Monitor tension setting 0.46 0.75 0.92 0.86 3.04 To improve bobbin condition 0.28 0.92 0.525 0.72 2.44 Condition of cord lying pulleys 0.28 0.525 0.39 0.72 1.92 Use leftover cord with joint.( Consume
solution dip cord in rubber sleeve taken out from sleeves rework)
0.56 1.05 0.525 0.143 3.575
3.4.2. Normality Test
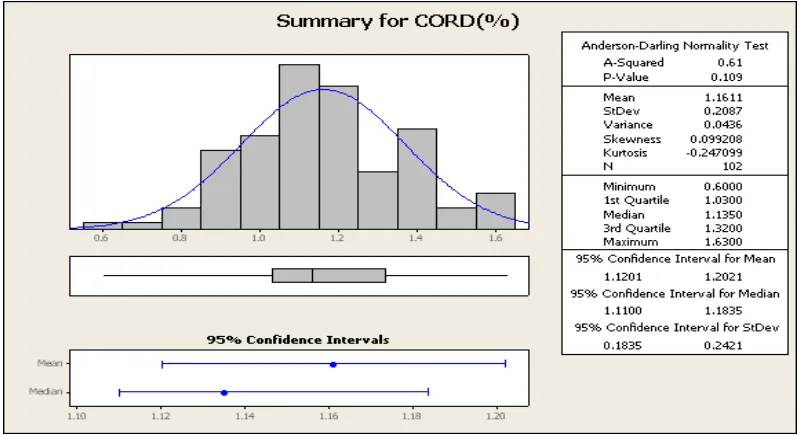
After implementing solutions, cord wastage data collected from 1st January 2010 to 30th April 2010 is analyzed. Its normality test (Figure 6) is carried out with the help of Minitab Software. It is found that data was normal because p value in the normality test is greater than 0.05.
Figure 6: Normality Test of Cord Wastage after DMAIC Methodology
3.4.3. Process Capability Test
After the normality test, performance of the drum building process is calculated with respect to cord wastage taking the help of process capability test as shown in Figure 7. DPMO was calculated by process capability test of cord wastage data and DPMO is 17240. From this DPMO value, Sigma level is found as 3.6.
Figure 7: Process Capability Test of Cord Wastage after DMAIC Methodology
3.5. Control Phase
show month wise cord wastage from the month of May 2009 to April 2010. Cord Wastage is decreased from the month of Jan 2010.
Figure 8: Graph showing Month-wise Cord Wastage
4. Result and Discussion
The Six Sigma based methodology has been used to optimize the variables of cord wastage. The results obtained are in the form of improvement for cord wastage in DPMO (Previous=549531, Improved= 14908), Sigma level (Previous =1.37, Improved=3.6). It has been found that organization achieved breakthrough in reducing cord wastage due to Six Sigma DMAIC Methodology. Six Sigma was found to be the greatest motivator behind moving everyone in the organization and bringing radical transformation. People in the workplace have developed the required statistical thinking with their involvement in this particular study. Benefits of implementation have been found to be enormous in this case study. However further research is possible in the direction of what the people and organization has to sacrifice for getting this breakthrough in their process. As no gains possible without companying improvement in work habit Six Sigma is continues improvement process involving all operations in the work place and more such opportunities are potentially available in the work place.
References
[1] Blakeslee Jr. J. A. (1999). Implementing the Six Sigma solution. Quality Progress, 32 (7), pp. 77–85.
[2] Hekmatpanah M., Sadroddin M., Shahbaz S., Mokhtari F. and Fadavinia F. (2008). Six Sigma Process and its Impact on the Organizational Productivity. World Academy of Science, Engineering and Technology, 43.
[3] Antony, J. and Banuelas R. (2002). Key ingredients for the effective implementation of six Sigma program. Measuring Business Excellence, 6(4), pp. 20–27.
[4] Pande Peter S. The Six Sigma Way, Tata McGraw-Hill Edition.
[5] http://www.kayoprojectmanagement.com/Sample%20Project%20Charter.pdf
[6] http://www.jsksolutions.com/downloads/What%20is%20SIPOC%20and%20why%20use%20it.pdf
[7] Desai T. N. and Shrivastava R. L. (2008). Six Sigma – A New Direction to Quality and Productivity Management, Proceedings of the World Congress on Engineering and Computer Science 2008 WCECS 2008, October 22 - 24, 2008, San Francisco, USA.
[8] Lynn Vining et al. (2006). January 5, Quality Management Coordinator, Clinical Outcomes and Resource Management.